 RSS Feed
 by Calculated Risk on 1/07/2011 08:30:00 AM
Showing posts with label Employment. Show all posts
Showing posts with label Employment. Show all posts
Friday, January 07, 2011
December Employment Report: 103,000 Jobs, 9.4% Unemployment Rate
From the BLS:
The unemployment rate fell by 0.4 percentage point to 9.4 percent inPayroll for October payroll was revised up 38,000, and November was revised up 32,000 (total of 70,000). (edit)
December, and nonfarm payroll employment increased by 103,000, the U.S. Bureau of Labor Statistics reported today.
The following graph shows the employment population ratio, the participation rate, and the unemployment rate.
 Click on graph for larger image.
The unemployment rate decreased to 9.4% (red line).
The Labor Force Participation Rate declined to 64.3% in December (blue line). This is the lowest level since the early '80s. (This is the percentage of the working age population in the labor force. The participation rate is well below the 66% to 67% rate that was normal over the last 20 years.)
The Employment-Population ratio increased to 58.3% in December (black line).
 The second graph shows the job losses from the start of the employment recession, in percentage terms aligned at maximum job losses. The dotted line is ex-Census hiring.
 For the current employment recession, employment peaked in December 2007, and this recession is by far the worst recession since WWII in percentage terms, and 2nd worst in terms of the unemployment rate (only the early '80s recession with a peak of 10.8 percent was worse).
This was slightly below expectations, although the upward revision to October and November were signficant. I'll have much more soon ...
Friday, December 03, 2010
Seasonal Retail Hiring: Retailers remain cautious
by Calculated Risk on 12/03/2010 01:01:00 PM
According to the BLS employment report - and combining October and November - retailers hired seasonal workers at above the pace of last year, but well below the pre-crisis levels.
 Click on graph for larger image.
Typically retail companies start hiring for the holiday season in October, and really increase hiring in November. Here is a graph that shows the historical net retail jobs added for October, November and December by year (not seasonally adjusted).
This really shows the collapse in retail hiring in 2008 and modest rebound in 2009.
Retailers hired 433 thousand workers (NSA) net in October and November. This is above the 367 hired last year in October and November, but well below the pre-crisis average of close to 550 thousand for the same two months.
Note: this is NSA (Not Seasonally Adjusted), retailers employed 28 thousand fewer workers in November than October seasonally adjusted.
This suggests retailers are still cautious about the holiday season.
Earlier employment posts:
• November Employment Report: 39,000 Jobs, 9.8% Unemployment Rate
• Employment Summary and Part Time Workers, Unemployed over 26 Weeks
• Graphics Gallery for Employment
November Employment Report: 39,000 Jobs, 9.8% Unemployment Rate
by Calculated Risk on 12/03/2010 08:30:00 AM
From the BLS:
The unemployment rate edged up to 9.8 percent in November, and nonfarm payroll employment was little changed (+39,000), the U.S. Bureau of Labor Statistics reported today.The following graph shows the employment population ratio, the participation rate, and the unemployment rate.
 Click on graph for larger image.
The unemployment rate increased to 9.8% (red line).
The Employment-Population ratio declined to 58.2% in November matching the cycle low set in 2009 (black line).
The Labor Force Participation Rate was steady at 64.5% in November (blue line). This is the percentage of the working age population in the labor force. The participation rate is well below the 66% to 67% rate that was normal over the last 20 years.
 The second graph shows the job losses from the start of the employment recession, in percentage terms aligned at maximum job losses.
The dotted line is ex-Census hiring. The two lines have joined since the decennial Census is over.
For the current employment recession, employment peaked in December 2007, and this recession is by far the worst recession since WWII in percentage terms, and 2nd worst in terms of the unemployment rate (only the early '80s recession with a peak of 10.8 percent was worse).
This is a very disappointing employment report and far below expectations. I'll have much more soon ...
Friday, November 05, 2010
Seasonal Retail Hiring off to fast start in October
by Calculated Risk on 11/05/2010 02:21:00 PM
According to the BLS employment report, retailers hired seasonal workers at about the pre-crisis pace in October.
 Click on graph for larger image.
Typically retail companies start hiring for the holiday season in October, and really increase hiring in November. Here is a graph that shows the historical net retail jobs added for October, November and December by year.
This really shows the collapse in retail hiring in 2008 and modest rebound in 2009.
Retailers hired 150.9 thousand workers (NSA) net in October. This is about the same level as in 2003 through 2006. Note: this is NSA (Not Seasonally Adjusted), retailers hired 28 thousand workers SA in October.
This suggests retailers are fairly optimistic about the holiday season.
Earlier employment posts:
Employment-Population Ratio, Part Time Workers, Unemployed over 26 Weeks
by Calculated Risk on 11/05/2010 10:04:00 AM
Here are a few more graphs based on the employment report ...
Percent Job Losses During Recessions, aligned at Bottom
 Click on graph for larger image.
This graph shows the job losses from the start of the employment recession, in percentage terms - this time aligned at the bottom of the recession (Both the 1991 and 2001 recessions were flat at the bottom, so the choice was a little arbitrary).
The dotted line shows payroll employment excluding temporary Census workers.
Employment-Population Ratio
The Employment-Population ratio declined to 58.3% in October from 58.5% in September. This is disappointing news.
 This graph shows the employment-population ratio; this is the ratio of employed Americans to the adult population.
Note: the graph doesn't start at zero to better show the change.
The Labor Force Participation Rate also declined to 64.5% in October from 64.7% in September. This is the percentage of the working age population in the labor force. The participation rate is well below the 66% to 67% rate that was normal over the last 20 years.
When the employment picture eventually improves, people will return to the labor force and the participation rate will increase from these very low levels. Right now workers are leaving the labor force, and even though that is keeping the reported unemployment rate from rising, it is really unwelcome news.
Part Time for Economic Reasons
 From the BLS report:
The number of persons employed part time for economic reasons (some-The number of workers only able to find part time jobs (or have had their hours cut for economic reasons) declined to 9.154 million in October, from the record 9.472 million in September. This is still very high.
times referred to as involuntary part-time workers) fell by 318,000
over the month to 9.2 million, partially offsetting large increases in
the prior 2 months. These individuals were working part time because
their hours had been cut back or because they were unable to find a
full-time job.
These workers are included in the alternate measure of labor underutilization (U-6) that decreased to 17.0% in October from 17.1% in September. The high for U-6 was 17.4% in October 2009. Still grim.
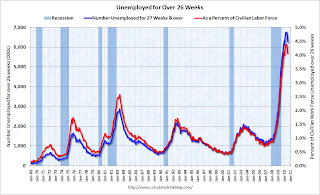
Unemployed over 26 Weeks
 This graph shows the number of workers unemployed for 27 weeks or more.
 According to the BLS, there are 6.206 million workers who have been unemployed for more than 26 weeks and still want a job. This was up from 6.123 million in September. It appears the number of long term unemployed has peaked ... although this may be because people are giving up.
The number of long term unemployed is staggering - still over 6 million people who are looking for a job.
Summary
The underlying details of the employment report were mixed. The positive included the 151,000 payroll jobs added, the upward revisions to August and September, a slight uptick in hours worked and average hourly earnings, and a slight decline in part time workers (and slight decline in U-6 unemployment).
The negatives include the declines in the employment-population ratio and the participation rate, the increase in workers unemployed for over 26 weeks, and the unemployment rate still flat at a very high level.
This report was a clear improvement from the previous four months, but this was still a fairly soft report.
October Employment Report: 151,000 Jobs, 9.6% Unemployment Rate
by Calculated Risk on 11/05/2010 08:30:00 AM
From the BLS:
Nonfarm payroll employment increased by 151,000 in October, and the unemployment rate was unchanged at 9.6 percent, the U.S. Bureau of Labor Statistics reported today.Both August and September payroll employment were revised up.
 Click on graph for larger image.
This graph shows the unemployment rate vs. recessions. The unemployment rate has been stuck at 9.6% for three straight months.
Nonfarm payrolls increased by 151 thousand in October. The economy has gained 829 thousand jobs over the last year, and still lost 7.5 million jobs since the recession started in December 2007.
 The second graph shows the job losses from the start of the employment recession, in percentage terms (as opposed to the number of jobs lost).
The dotted line is ex-Census hiring. The two lines have joined since the decennial Census is over.
For the current employment recession, employment peaked in December 2007, and this recession is by far the worst recession since WWII in percentage terms, and 2nd worst in terms of the unemployment rate (only the early '80s recession with a peak of 10.8 percent was worse).
This is an improved employment report compared to recent months. I'll have much more soon ...
Wednesday, November 03, 2010
ADP: Private Employment increases by 43,000 in October
by Calculated Risk on 11/03/2010 08:15:00 AM
ADP reports:
Private-sector employment increased by 43,000 from September to October on a seasonally adjusted basis, according to the latest ADP National Employment Report® released today. The estimated change of employment from August to September was revised up from the previously reported decline of 39,000 to a smaller decline of 2,000.Note: ADP is private nonfarm employment only (no government jobs).
Since employment began rising in February, the monthly gain has averaged 34,000 with a range of -2,000 to +65,000 during the period. October’s figure is within this recent range and is consistent with the deceleration of economic growth that occurred in the spring. Employment gains of this magnitude are not sufficient to lower the unemployment rate.
The consensus was for ADP to show an increase of about 20,000 private sector jobs in October, so this was above consensus.
The BLS reports on Friday, and the consensus a 60,000 increase in payroll jobs in October, on a seasonally adjusted (SA) basis and for the unemployment rate to stay steady at 9.6%.
Friday, October 08, 2010
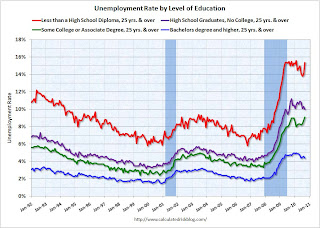
Unemployment by Level of Education and Employment Diffusion Indexes
by Calculated Risk on 10/08/2010 12:34:00 PM
By request ...
 Click on graph for larger image in new window.
This graph shows the unemployment rate by four levels of education (all groups are 25 years and older).
Note that the unemployment rate increased sharply for all four categories in 2008 and into 2009.
Unfortunately this data only goes back to 1992 and only includes one previous recession (the stock / tech bust in 2001). Clearly education matters with regards to the unemployment rate - but education didn't seem to matter as far as the recovery rate in unemployment following the 2001 recession. All four groups recovered slowly.
Earlier this year, the group with "less than a high school diploma" recovered a little better than the more educated groups - possibly because of the tax credit related increase in construction - but that changed in September as the unemployment rate increased sharply.
For the group with some college or an associate degree, the unemployment rate is at a new high for this employment recession.
Diffusion Indexes
This is a little more technical ...
 The BLS diffusion index for total private employment declined to 49.8 from 54.1 in August. For manufacturing, the diffusion index declined to 46.3 from 48.2 in August.
Both indexes are down sharply from earlier this year.
Think of this as a measure of how widespread job gains are across industries. The further from 50 (above or below), the more widespread the job losses or gains reported by the BLS. From the BLS:
Figures are the percent of industries with employment increasing plus one-half of the industries with unchanged employment, where 50 percent indicates an equal balance between industries with increasing and decreasing employment.The increases in the diffusion indexes in 2009 and earlier this year, was a clear positive in the monthly employment reports. However the decrease in the diffusion indexes over the last few months (falling below 50% for both in September), is disappointing.
Earlier employment posts today (with many graphs):
Employment-Population Ratio, Part Time Workers, Unemployed over 26 Weeks
by Calculated Risk on 10/08/2010 09:50:00 AM
Here are a few more graphs based on the employment report ...
Percent Job Losses During Recessions, aligned at Bottom
 Click on graph for larger image.
This graph shows the job losses from the start of the employment recession, in percentage terms - this time aligned at the bottom of the recession (Both the 1991 and 2001 recessions were flat at the bottom, so the choice was a little arbitrary).
The dotted line shows the impact of Census hiring. As of the end of September, there were only 6,000 temporary 2010 Census workers still on the payroll. So the gap between the solid and dashed red lines is almost completely gone.
Part Time for Economic Reasons
 From the BLS report:
The number of persons employed part time for economic reasons (sometimes referred to as involuntary part-time workers) rose by 612,000 over the month to 9.5 million. Over the past 2 months, the number of such workers has increased by 943,000. These individuals were working part time because their hours had been cut back or because they were unable to find a full-time job.The number of workers only able to find part time jobs (or have had their hours cut for economic reasons) was at 9.472 million in September, up sharply from August.
This is a new record high, and is obviously bad news.
These workers are included in the alternate measure of labor underutilization (U-6) that increased to 17.1% in September from 16.7% in August. The high for U-6 was 17.4% in October 2009. Grim.
Employment-Population Ratio
The Employment-Population ratio was steady at 58.5% in September (the same as in August).
 This graph shows the employment-population ratio; this is the ratio of employed Americans to the adult population.
Note: the graph doesn't start at zero to better show the change.
The Labor Force Participation Rate was also steady at 64.7% in September. This is the percentage of the working age population in the labor force. The participation rate is well below the 66% to 67% rate that was normal over the last 20 years.
When the employment picture eventually improves, people will return to the labor force and the participation rate will increase from these very low levels. And that will put upward pressure on the unemployment rate.
Unemployed over 26 Weeks
 The blue line is the number of workers unemployed for 27 weeks or more. The red line is the same data as a percent of the civilian workforce.
According to the BLS, there are 6.123 million workers who have been unemployed for more than 26 weeks and still want a job. This is 4.0% of the civilian workforce. It appears the number of long term unemployed has peaked ... Although this may be because people are giving up.
The number of long term unemployed is staggering - still over 6 million people who are looking for a job.
Summary
The underlying details of the employment report were grim. The number of private sector jobs increased modestly by 64,000, otherwise ...
The negatives include the loss of 18,000 jobs ex-Census, the sharp increase in part time workers for economic reasons (and jump in U-6 unemployment rate), hours worked were flat (down for manufacturing workers), the employment-population ratio and labor force participation were flat at very low levels, and the unemployment rate was flat at a very high level.
Overall this was a weak report.
September Employment Report: 18K Jobs Lost ex-Census, 9.6% Unemployment Rate
by Calculated Risk on 10/08/2010 08:30:00 AM
Note: This will be the last "ex-Census" report this decade.
From the BLS:
Nonfarm payroll employment edged down (-95,000) in September, and the unemployment rate was unchanged at 9.6 percent, the U.S. Bureau of Labor Statistics reported today. Government employment declined (-159,000), reflecting both a drop in the number of temporary jobs for Census 2010 and job losses in local government. Private-sector payroll employment continued to trend up modestly (+64,000).Census 2010 hiring decreased 77,000 in September. Non-farm payroll employment decreased 18,000 in September ex-Census.
Both July and August payroll employment were revised down. The change in total nonfarm payroll employment for July was revised from -54,000 to -66,000, and the change for August was revised from -54,000 to -57,000.
 Click on graph for larger image.
This graph shows the unemployment rate vs. recessions.
Nonfarm payrolls decreased by 95 thousand in August. The economy has gained 334 thousand jobs over the last year, and lost 7.75 million jobs since the recession started in December 2007.
 The second graph shows the job losses from the start of the employment recession, in percentage terms (as opposed to the number of jobs lost).
The dotted line is ex-Census hiring. The two lines have joined since the decennial Census is almost over.
For the current employment recession, employment peaked in December 2007, and this recession is by far the worst recession since WWII in percentage terms, and 2nd worst in terms of the unemployment rate (only early '80s recession with a peak of 10.8 percent was worse).
Note: The preliminary benchmark payroll revision is minus 366,000 jobs. This is a little larger than the normal adjustment (last year was especially large). The actual adjustment will be made in February 2011. This is the preliminary estimate of the annual revision, from the BLS: "The benchmark adjustment, a standard part of the payroll survey estimation process, is a once-a-year re-anchoring of the sample-based employment estimates to full population counts available principally through unemployment insurance (UI) tax records filed by employers with State Employment Security Agencies."
This is another weak employment report. I'll have much more soon ...
For more, see next post: Employment-Population Ratio, Part Time Workers, Unemployed over 26 Weeks
Wednesday, October 06, 2010
Seasonal Retail Hiring Outlook: "Dim"
by Calculated Risk on 10/06/2010 03:30:00 PM
Typically retail companies start hiring for the holiday season in October, and really increase hiring in November. Here is a graph that shows the historical net retail jobs added for October, November and December by year and a forecast for 2010.
 Click on graph for larger image in new window.
This really shows the collapse in retail hiring in 2008 and the weak recovery in 2009. This also shows how the season has changed over time - back in the '80s, retailers hired mostly in December. Now the peak month is November, and many retailers start hiring seasonal workers in October.
From Stephanie Clifford and Catherine Rampell at the NY Times: Dim Outlook for Holiday Jobs
As the economy sputters, prospects are dimming for unemployed workers who were banking on a seasonal retail job to carry them through the holidays. ...Last year - looking at the graph - retailers held back on hiring in October and waited until November (as Challenger Gray expects to happen again this year). The increase to 600,000 is significant, but still below the levels of 1992 through 2007 - except for the recession year of 2001.
The recruiting firm Challenger, Gray & Christmas, forecasts that retailers will add up to 600,000 jobs in October, November and December, compared with a net gain of 501,400 holiday jobs over the same three months in 2009.
...
Challenger Gray expects that companies may wait to hire until November or December — once they have a feel for how much consumers are willing to spend.
This hiring will be watched closely, and I suspect seasonal hiring will be stronger than in 2009, but well below the 700+ thousand jobs in 2004 through 2007.
Note: Clifford and Rampell also note that the supply chain for retailers is long - and many retailers placed orders earlier this year when the outlook seemed brighter to some (not to those paying attention!).
While retailers are just now making plans for Christmas hiring, they had to make plans for Christmas merchandise months ago, and that lag might create some inventory problems.Last year the retailers ran lean on inventory, but if this year is slow, there will be plenty of discounting.
ADP: Private Employment decreases by 39,000 in September
by Calculated Risk on 10/06/2010 08:15:00 AM
ADP reports:
Private-sector employment decreased by 39,000 from August to September on a seasonally adjusted basis, according to the latest ADP National Employment Report® released today. The estimated change of employment from July to August was revised up from the previously reported decline of 10,000 to an increase of 10,000.Note: ADP is private nonfarm employment only (no government jobs).
The decline in private employment in September confirms a pause in the economic recovery already evident in other data. A deceleration of employment occurred in all the major sectors shown in The ADP Report and for all sizes of payroll.
...
Unlike the estimate of total establishment employment to be released on Friday by the Bureau of Labor Statistics (BLS), today’s ADP National Employment Report does not include the effects of federal hiring — and now firing — for the 2010 Census.
The consensus was for ADP to show an increase of about 23,000 private sector jobs in September, so this was way below consensus.
The BLS reports on Friday, and the consensus is for no change in payroll jobs in September, on a seasonally adjusted (SA) basis, with the loss of around 78,000 temporary Census 2010 jobs (+78,000 ex-Census).
Saturday, October 02, 2010
September Employment Report Preview
by Calculated Risk on 10/02/2010 08:50:00 AM
1) The consensus is for a headline payroll number of zero (no net payroll jobs added or lost) and for the unemployment rate to increase to 9.7% in September from 9.6% in August.
Goldman Sachs is forecasting a minus 50,000 headline payroll number and an increase in the unemployment rate to 9.7%.
2) My estimate is the decennial Census workforce was reduced by 78,000 in August. This suggests a consensus headline payroll number of +78,000 ex-Census.
 Click on graph for larger image in new window.
This graph shows the number of Census workers paid each week. The red labels are the weeks of the BLS payroll survey.
The Census payroll decreased from 83,955 for the week ending August 14th to 6,038 for the week ending September 18th.
So my estimate for the impact of the Census on September payroll employment is minus 78 thousand (this will probably be close).
With temporary payroll employment down to 6,038, September will be the last month with a significant decennial Census adjustment.
3) The unemployment rate is dependent on both job creation and the participation rate (both numbers from the household survey - payroll employment is from the establishment survey).
Usually the participation rate - the percent of the civilian population in the labor force - falls when the job market is weak. And a decline in the participation rate puts downward pressure on the unemployment rate (and the opposite is true when the participation rate increases).
Right now the participation rate is very low at 64.7%, and a further decline would be considered bad employment news (even if the unemployment rate declined slightly). An increase in the participation rate, combined with a weak labor market, could lead to a jump in the unemployment rate. This is something to watch closely.
4) In August the unemployment rate was 9.643% unrounded (reported as 9.6%), so it won't take much of an increase to reach the consensus 9.7% for September.
5) This will be the last employment report before the two day FOMC meeting on Nov 2nd and 3rd. Anything close to the consensus will probably all but guarantee QE2 (barring a significant upside surprise for Q3 GDP to be reported on October 29th).
Thursday, September 23, 2010
Weekly Initial Unemployment Claims increase
by Calculated Risk on 9/23/2010 08:30:00 AM
The DOL reports on weekly unemployment insurance claims:
In the week ending Sept. 18, the advance figure for seasonally adjusted initial claims was 465,000, an increase of 12,000 from the previous week's revised figure of 453,000. The 4-week moving average was 463,250, a decrease of 3,250 from the previous week's revised average of 466,500.
 Click on graph for larger image in new window.
This graph shows the 4-week moving average of weekly claims since January 2000.
The dashed line on the graph is the current 4-week average. The four-week average of weekly unemployment claims decreased this week by 3,250 to 463,250.
The 4-week moving average has been moving sideways at an elevated level for about 10 months - and that suggests a weak job market.
Friday, September 03, 2010
Employment-Population Ratio, Part Time Workers, Unemployed over 26 Weeks
by Calculated Risk on 9/03/2010 09:50:00 AM
Here are a few more graphs based on the employment report ...
Percent Job Losses During Recessions, aligned at Bottom Click on graph for larger image.
This graph shows the job losses from the start of the employment recession, in percentage terms - this time aligned at the bottom of the recession (Both the 1991 and 2001 recessions were flat at the bottom, so the choice was a little arbitrary).
The dotted line shows the impact of Census hiring. In August, there were only 82,000 temporary 2010 Census workers still on the payroll. The number of Census workers will continue to decline - and the remaining gap between the solid and dashed red lines will be gone soon.
Employment-Population Ratio
The Employment-Population ratio increased to 58.5% in August from 58.4% in July.  This graph shows the employment-population ratio; this is the ratio of employed Americans to the adult population.
Note: the graph doesn't start at zero to better show the change.
The Labor Force Participation Rate increased to 64.7% from 64.6% in July. This is the percentage of the working age population in the labor force. This increase was mostly because of the an increase in the teen participation rate (related to the very weak teen participation rate during the summer). The participation rate is well below the 66% to 67% rate that was normal over the last 20 years.
As the employment picture improves, people will return to the labor force, and that will put upward pressure on the unemployment rate.
Part Time for Economic Reasons 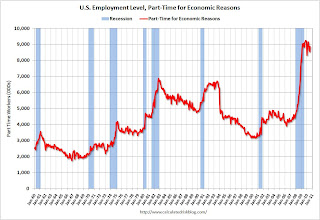 From the BLS report:
The number of persons employed part time for economic reasons (sometimes referred to as involuntary part-time workers) increased by 331,000 over the month to 8.9 million. These individuals were working part time because their hours had been cut back or because they were unable to find a full-time job.The number of workers only able to find part time jobs (or have had their hours cut for economic reasons) was at 8.9 million in August. This increase was bad news.
The all time record of 9.24 million was set in October 2009.
These workers are included in the alternate measure of labor underutilization (U-6) that increased to 16.7% in August from 16.5% in July.
Unemployed over 26 Weeks
 The blue line is the number of workers unemployed for 27 weeks or more. The red line is the same data as a percent of the civilian workforce.
According to the BLS, there are 6.249 million workers who have been unemployed for more than 26 weeks and still want a job. This is 4.1% of the civilian workforce. It appears the number of long term unemployed has peaked ... hopefully not because people are giving up.
Summary
The underlying details of the employment report were mixed. The positives: the upward revisions to the June and July reports, a slight increase in hours worked for manufacturing employees (flat for all employees), an increase in hourly wages, and the decrease in the long term unemployed. Other positives include the slight increase in the employment-population ratio and the participation rate.
The negatives include the hiring of only 60,000 ex-Census, the increase in the unemployment rate (including U-6), and the increase in part time workers for economic reasons.
Overall this was a weak report and is consistent with a sluggish recovery.
Earlier employment post today:
Wednesday, September 01, 2010
ADP: Private Employment decreases 10,000 in August
by Calculated Risk on 9/01/2010 08:15:00 AM
ADP reports:
Private sector employment decreased by 10,000 from July to August on a seasonally adjusted basis, according to the latest ADP National Employment Report® released today. The estimated change of employment from June to July was revised down slightly, from the previously reported increase of 42,000 to an increase of 37,000.Note: ADP is private nonfarm employment only (no government jobs).
The decline in private employment in August confirms a pause in the recovery already evident in other economic data.
...
Unlike the estimate of total establishment employment to be released on Friday by the Bureau of Labor Statistics (BLS), today’s figure does not include the effects of federal hiring — and now firing — for the 2010 Census.
The consensus was for ADP to show an increase of about 20,000 private sector jobs in August, so this was below consensus.
The BLS reports on Friday, and the consensus is for a decrease of 90,000 payroll jobs in August, on a seasonally adjusted (SA) basis, with the loss of around 116,000 temporary Census 2010 jobs (+26,000 ex-Census).
Thursday, August 19, 2010
Weekly initial unemployment claims at 500,000, highest since November 2009
by Calculated Risk on 8/19/2010 08:30:00 AM
The DOL reports on weekly unemployment insurance claims:
In the week ending Aug. 14, the advance figure for seasonally adjusted initial claims was 500,000, an increase of 12,000 from the previous week's revised figure of 488,000. The 4-week moving average was 482,500, an increase of 8,000 from the previous week's revised average of 474,500.
...
The advance number for seasonally adjusted insured unemployment during the week ending Aug. 7 was 4,478,000, a decrease of 13,000 from the preceding week's revised level of 4,491,000.
 Click on graph for larger image in new window.
This graph shows the 4-week moving average of weekly claims since January 2000.
The four-week average of weekly unemployment claims increased this week by 8,000 to 482,500.
The dashed line on the graph is the current 4-week average. This is the highest level for initial claims - and also for the 4-week average - since November 2009.
Friday, August 06, 2010
Employment Report: Temporary Help and Diffusion Index
by Calculated Risk on 8/06/2010 04:09:00 PM
This post is a little more technical ...
Earlier employment posts today (with many graphs):
Temporary Help
From the BLS report:
The number of jobs in temporary help services showed little movement (-6,000) over the month.The following graph was used early this year as the basis for several optimistic employment forecasts (I disagreed).
 Click on graph for larger image in new window.
This graph is a little complicated. The red line is the three month average change in temporary help services (left axis). This is shifted four months into the future.
The blue line (right axis) is the three month average change in total employment (excluding temporary help services).
Unfortunately the data on temporary help services only goes back to 1990, but it does appear that temporary help leads employment by about four months.
The thinking was that before companies hire permanent employees following a recession, employers first increase the hours worked of current employees and also hire temporary employees. After the number of temporary workers increased sharply late last year, some people thought this might be signaling the beginning of a strong employment recovery.
I was skeptical and joked that "We're all temporary now!" As this graph shows, the hoped for surge in overall hiring didn't happen. There are a number of reasons why employment growth is sluggish following the credit bust - mostly related to excess capacity in many sectors, and the excess supply of houses (usually new residential investment is one of the key sectors for employment at the beginning of a recovery).
This will be my last post with this graph.
Note: the temporary hiring for the Census is excluded from this graph.
Diffusion Index
 The BLS diffusion index for total private employment was steady at 55.6 in July. For manufacturing, the diffusion index is at 50.0; down from 53.0 in June, and down sharply from 65.9 in May.
Think of this as a measure of how widespread job gains are across industries. The further from 50 (above or below), the more widespread the job losses or gains reported by the BLS. From the BLS:
Figures are the percent of industries with employment increasing plus one-half of the industries with unchanged employment, where 50 percent indicates an equal balance between industries with increasing and decreasing employment.The increase in the diffusion index earlier this year was one of the clear positives in the monthly employment reports. The decrease in the diffusion index over the last few months (falling to 50% for manufacturing in July), is disappointing.
Employment-Population Ratio, Part Time Workers, Unemployed over 26 Weeks
by Calculated Risk on 8/06/2010 09:50:00 AM
Here are a few more graphs based on the employment report ...
Percent Job Losses During Recessions, aligned at Bottom
Longer. Deeper. And flat at the bottom. Unfortunately that describes the 2007 employment recession. Click on graph for larger image.
This graph shows the job losses from the start of the employment recession, in percentage terms - this time aligned at the bottom of the recession (Both the 1991 and 2001 recessions were flat at the bottom, so the choice was a little arbitrary).
The dotted line shows the impact of Census hiring. In July, there were 196,000 temporary 2010 Census workers on the payroll. The number of Census workers will continue to decline - and the gap between the solid and dashed red lines will be gone in a few months.
Employment-Population Ratio
The Employment-Population ratio decreased to 58.4% in July from 58.5% in June. This had been increasing after plunging since the start of the recession, and the recovery in the Employment-Population ratio was considered a good sign - but the ratio has now decreased for three consecutive months.  This graph shows the employment-population ratio; this is the ratio of employed Americans to the adult population.
Note: the graph doesn't start at zero to better show the change.
The Labor Force Participation Rate decreased to 64.6% from 64.7% in June. This is the percentage of the working age population in the labor force. This decline is very disappointing, and the rate is well below the 66% to 67% rate that was normal over the last 20 years.
The reason the unemployment rate was steady at 9.5% was because people left the workforce - and that is not good news. As the employment picture improves, people will return to the labor force, and that will put upward pressure on the unemployment rate.
Part Time for Economic Reasons  From the BLS report:
The number of persons employed part time for economic reasons (sometimes referred to as involuntary part-time workers) was essentially unchanged over the month at 8.5 million but has declined by 623,000 since April. These individuals were working part time because their hours had been cut back or because they were unable to find a full-time job.The number of workers only able to find part time jobs (or have had their hours cut for economic reasons) was at 8.53 million in July. This small decline was a little bit of good news.
The all time record of 9.24 million was set in October 2009.
These workers are included in the alternate measure of labor underutilization (U-6) that was steady at 16.5% in July.
Unemployed over 26 Weeks
 The blue line is the number of workers unemployed for 27 weeks or more. The red line is the same data as a percent of the civilian workforce.
According to the BLS, there are 6.,572 million workers who have been unemployed for more than 26 weeks and still want a job. This is 4.3% of the civilian workforce, just below the record set last month. (note: records started in 1948). The number of long term unemployed might have peaked ... perhaps because people are giving up.
Summary
The underlying details of the employment report were mixed. The positives: a slgiht increase in hours worked and in hourly wages, and the slight decreases in part time workers (for economic reasons) and in the long term unemployed.
The negatives include the weak hiring of only 12,000 ex-Census, the declines in the participation rate and employment-population rate, and the significant downward revision to the June employment report.
Overall this was a weak report.
Earlier employment post today:
July Employment Report: 12K Jobs ex-Census, 9.5% Unemployment Rate
by Calculated Risk on 8/06/2010 08:30:00 AM
From the BLS:
Total nonfarm payroll employment declined by 131,000 in July, and the unemployment rate was unchanged at 9.5 percent, the U.S. Bureau of Labor Statistics reported today. Federal government employment fell, as 143,000 temporary workers hired for the decennial census completed their work. Private-sector payroll employment edged up by 71,000.Census 2010 hiring decreased 143,000 in July. Non-farm payroll employment increased 12,000 in July ex-Census. Also June was revised down sharply to
 Click on graph for larger image.
This graph shows the unemployment rate and the year over year change in employment vs. recessions.
Nonfarm payrolls decreased by 131 thousand in July. The economy has lost 52 thousand jobs over the last year, and 7.7 million jobs since the recession started in December 2007.
Ex-Census hiring, the economy added 12,000 jobs in July. The unemployment rate was steady at 9.5 percent.
 The second graph shows the job losses from the start of the employment recession, in percentage terms (as opposed to the number of jobs lost).
The dotted line is ex-Census hiring. The two lines will rejoin later this year when the Census hiring is unwound.
For the current employment recession, employment peaked in December 2007, and this recession is by far the worst recession since WWII in percentage terms, and 2nd worst in terms of the unemployment rate (only early '80s recession with a peak of 10.8 percent was worse).
This is a very weak report, especially considering the downward revision to June. The participation rate declined again, and that is why the unemployment rate was steady - and that is bad news. I'll have much more soon ...
Update: there is much more in the next post: Employment-Population Ratio, Part Time Workers, Unemployed over 26 Weeks


