 RSS Feed
 by Calculated Risk on 10/08/2010 09:50:00 AM
Friday, October 08, 2010
Employment-Population Ratio, Part Time Workers, Unemployed over 26 Weeks
Here are a few more graphs based on the employment report ...
Percent Job Losses During Recessions, aligned at Bottom
 Click on graph for larger image.
This graph shows the job losses from the start of the employment recession, in percentage terms - this time aligned at the bottom of the recession (Both the 1991 and 2001 recessions were flat at the bottom, so the choice was a little arbitrary).
The dotted line shows the impact of Census hiring. As of the end of September, there were only 6,000 temporary 2010 Census workers still on the payroll. So the gap between the solid and dashed red lines is almost completely gone.
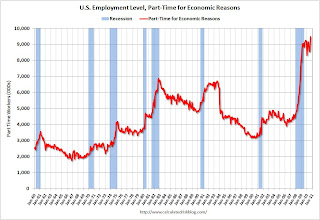
Part Time for Economic Reasons
 From the BLS report:
The number of persons employed part time for economic reasons (sometimes referred to as involuntary part-time workers) rose by 612,000 over the month to 9.5 million. Over the past 2 months, the number of such workers has increased by 943,000. These individuals were working part time because their hours had been cut back or because they were unable to find a full-time job.The number of workers only able to find part time jobs (or have had their hours cut for economic reasons) was at 9.472 million in September, up sharply from August.
This is a new record high, and is obviously bad news.
These workers are included in the alternate measure of labor underutilization (U-6) that increased to 17.1% in September from 16.7% in August. The high for U-6 was 17.4% in October 2009. Grim.
Employment-Population Ratio
The Employment-Population ratio was steady at 58.5% in September (the same as in August).
 This graph shows the employment-population ratio; this is the ratio of employed Americans to the adult population.
Note: the graph doesn't start at zero to better show the change.
The Labor Force Participation Rate was also steady at 64.7% in September. This is the percentage of the working age population in the labor force. The participation rate is well below the 66% to 67% rate that was normal over the last 20 years.
When the employment picture eventually improves, people will return to the labor force and the participation rate will increase from these very low levels. And that will put upward pressure on the unemployment rate.
Unemployed over 26 Weeks
 The blue line is the number of workers unemployed for 27 weeks or more. The red line is the same data as a percent of the civilian workforce.
According to the BLS, there are 6.123 million workers who have been unemployed for more than 26 weeks and still want a job. This is 4.0% of the civilian workforce. It appears the number of long term unemployed has peaked ... Although this may be because people are giving up.
The number of long term unemployed is staggering - still over 6 million people who are looking for a job.
Summary
The underlying details of the employment report were grim. The number of private sector jobs increased modestly by 64,000, otherwise ...
The negatives include the loss of 18,000 jobs ex-Census, the sharp increase in part time workers for economic reasons (and jump in U-6 unemployment rate), hours worked were flat (down for manufacturing workers), the employment-population ratio and labor force participation were flat at very low levels, and the unemployment rate was flat at a very high level.
Overall this was a weak report.


