 RSS Feed
 by Calculated Risk on 3/10/2011 11:04:00 AM
Showing posts with label House Prices. Show all posts
Showing posts with label House Prices. Show all posts
Thursday, March 10, 2011
CoreLogic: House Prices declined 2.5% in January, Prices at New Post-bubble low
Notes: CoreLogic reports the year-over-year change. The headline for this post is for the change from December to January 2011. The CoreLogic HPI is a three month weighted average of November, December and January and is not seasonally adjusted (NSA).
From CoreLogic: CoreLogic® Home Price Index Shows Year-Over-Year Decline for Sixth Straight Month
CoreLogic ... January Home Price Index (HPI) which shows that home prices in the U.S. declined for the sixth month in a row. According to the CoreLogic HPI, national home prices, including distressed sales, declined by 5.7 percent in January 2011 compared to January 2010 after declining by 4.7 percent in December 2010 compared to December 2009. Excluding distressed sales, year-over-year prices declined by 1.6 percent in January 2011 compared to January 2010 and by 3.2 percent in December 2010 compared to December 2009. Distressed sales include short sales and real estate owned (REO) transactions.
The January data shows home prices continuing to slide. Mark Fleming, chief economist with CoreLogic, said, “A number of factors continue to dampen any recovery in the housing market. Negative equity, which limits the mobility of homeowners, weak demand and the overhang of shadow inventory all continue to exert downward pressure on housing prices. We are looking out for renewed demand in the coming months as the spring buying season gets underway to hopefully reduce the downward pressure.”
 Click on graph for larger image in graph gallery.
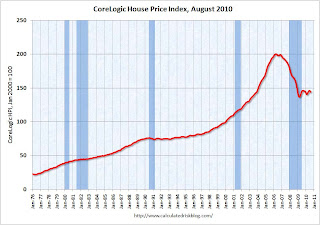
 This graph shows the national CoreLogic HPI data since 1976. January 2000 = 100.
The index is down 5.7% over the last year, and off 32.8% from the peak.
This is the sixth straight month of year-over-year declines, and the seventh straight month of month-to-month declines. The index is now 1.6% below the previous post-bubble low set in March 2009, and I expect to see further new post-bubble lows for this index over the next few months.
Tuesday, February 22, 2011
House Prices: Price-to-rent, Price-to-median Household Income
by Calculated Risk on 2/22/2011 08:35:00 PM
There is no perfect gauge of "normal" house prices. Changes in house prices depend on local supply and demand. However I've found the three most useful measures of house prices are 1) real house prices, 2) the house price-to-rent ratio, and 3) the house price-to-median household income ratio. These are just general guides, but they are still useful (these are national numbers, and it is better to use local numbers when possible).
Price-to-Rent
In October 2004, Fed economist John Krainer and researcher Chishen Wei wrote a Fed letter on price to rent ratios: House Prices and Fundamental Value. Kainer and Wei presented a price-to-rent ratio using the OFHEO house price index and the Owners' Equivalent Rent (OER) from the BLS.
 Click on graph for larger image in graph gallery.
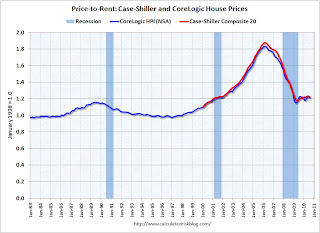
Here is a similar graph through December 2010 using the Case-Shiller Composite 20 and CoreLogic House Price Index.
This graph shows the price to rent ratio (January 1998 = 1.0).
This ratio could decline another 10% to 15%, and possibly more if prices overshoot to the downside. The decline in the ratio will probably be a combination of house prices and increasing rents (recent reports suggest rents are now increasing).
Price to Household Income
 The second graph shows the Case Shiller National price index through Q4 2010 and the median household income (from the Census Bureau, Table H-8, 2010 estimated as increasing 0.5%).
This ratio is still a little high, and could decline another 5% to 10% (and more if prices overshoot). The decline in the ratio could be a combination of falling house prices and an increase in the median household income.
Real House Prices
Earlier I posted real house prices using the Case-Shiller National Index, the Case-Shiller Composite 20 index, and the CoreLogic House Price Index in real terms (adjusted for inflation using CPI less shelter). Note: some people use other inflation measures to adjust for real prices. Here is a repeat of that graph:
 In real terms, the National index is back to Q1 2000 levels, the Composite 20 index is back to January 2001, and the CoreLogic index back to October 2000.
It looks like real prices could fall another 5% to 10% (more with overshoot). However what everyone wants to know is the change in nominal prices (not inflation adjusted). If real prices eventually fall 10%, that doesn't mean nominal prices will fall that far (it depends on inflation).
My guess: Although Professor Shiller was quoted today saying house prices could fall another 15% to 25%, I'm sticking with my forecast that nominal national house prices - as measured by these repeat sales indexes - will decline another 5% to 10% from the October levels.
Earlier on house prices:
• Real House Prices fall to 2000 Levels, Update on NAR Overstating Sales
• Case-Shiller: National Home Prices Are Close to the 2009Q1 Trough
Case-Shiller: National Home Prices Are Close to the 2009Q1 Trough
by Calculated Risk on 2/22/2011 09:00:00 AM
S&P/Case-Shiller released the monthly Home Price Indices for December (actually a 3 month average of October, November and December).
This includes prices for 20 individual cities and and two composite indices (for 10 cities and 20 cities), plus the Q4 quarterly national house price index.
Note: Case-Shiller reports NSA, I use the SA data.
From S&P: National Home Prices Are Close to the 2009Q1 Trough
Data through December 2010, released today by Standard & Poor’s for its S&P/Case-Shiller Home Price Indices ... show that the U.S. National Home Price Index declined by 3.9% during the fourth quarter of 2010. The National Index is down 4.1% versus the fourth quarter of 2009, which is the lowest annual growth rate since the third quarter of 2009, when prices were falling at an 8.6% annual rate. As of December 2010, 18 of the 20 MSAs covered by S&P/Case-Shiller Home Price Indices and both monthly composites were down compared to December 2009.
 Click on graph for larger image in graph gallery.
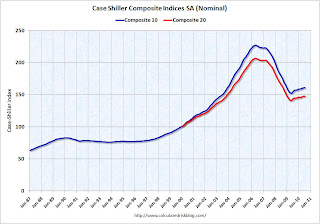
 The first graph shows the nominal seasonally adjusted Composite 10 and Composite 20 indices (the Composite 20 was started in January 2000).
The Composite 10 index is off 31.2% from the peak, and down 0.4% in December(SA). The Composite 10 is still 2.4% above the May 2009 post-bubble bottom.
The Composite 20 index is also off 31.2% from the peak, and down 0.4% in December (SA). The Composite 20 is only 0.8% above the May 2009 post-bubble bottom and will probably be at a new post-bubble low in January.
 The second graph shows the Year over year change in both indices.
The Composite 10 SA is down 1.2% compared to December 2009.
The Composite 20 SA is down 2.4% compared to December 2009.
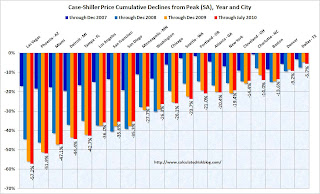
The third graph shows the price declines from the peak for each city included in S&P/Case-Shiller indices.
 Prices increased (SA) in only 7 of the 20 Case-Shiller cities in December seasonally adjusted.
 Prices in Las Vegas are off 58% from the peak, and prices in Dallas only off 8% from the peak.
From S&P:
Eleven MSAs posted new index level lows in December 2010, since their 2006/2007 peaks. These cities are Atlanta, Charlotte, Chicago, Detroit, Las Vegas, Miami, New York, Phoenix, Portland (OR), Seattle and Tampa. Nine of these cities had also posted lows with November’s report as well. New York and Phoenix are the new entrants to this group with December’s data.Prices are now falling just about everywhere, and more cities are hitting new post-bubble lows. Both composite indices are still slightly above the post-bubble low, but the indexes will probably be at new lows in early 2011.
Tuesday, January 25, 2011
Case-Shiller: U.S. Home Prices Keep Weakening as Eight Cities Reach New Lows in November
by Calculated Risk on 1/25/2011 09:00:00 AM
S&P/Case-Shiller released the monthly Home Price Indices for November (actually a 3 month average of September, October and November).
This includes prices for 20 individual cities and and two composite indices (for 10 cities and 20 cities).
Note: Case-Shiller reports NSA, I use the SA data.
From S&P: U.S. Home Prices Keep Weakening as Eight Cities Reach New Lows
Data through November 2010, released today by Standard & Poor’s for its S&P/Case-Shiller1 Home Price Indices, the leading measure of U.S. home prices, show a deceleration in the annual growth rates in 17 of the 20 MSAs and the 10- and 20-City Composites compared to what was reported for October 2010. The 10-City Composite was down 0.4% and the 20-City Composite fell 1.6% from their November 2009 levels. Home prices fell in 19 of 20 MSAs and both Composites in November from their October levels. In November, only four MSAs – Los Angeles, San Diego, San Francisco and Washington DC – showed year-over-year gains. The Composite indices remain above their spring 2009 lows; however, eight markets – Atlanta, Charlotte, Detroit, Las Vegas, Miami, Portland (OR), Seattle and Tampa – hit their lowest levels since home prices peaked in 2006 and 2007, meaning that average home prices in those markets have fallen even further than the lows set in the spring of 2009.
 Click on graph for larger image in new window.
 The first graph shows the nominal seasonally adjusted Composite 10 and Composite 20 indices (the Composite 20 was started in January 2000).
The Composite 10 index is off 31.0% from the peak, and down 0.4% in November(SA).
The Composite 20 index is off 30.9% from the peak, and down 0.5% in November (SA).
 The second graph shows the Year over year change in both indices.
The Composite 10 SA is down 0.4% compared to November 2009. This is the first year-over-year decline since 2009.
The Composite 20 SA is down 1.6% compared to November 2009.
The third graph shows the price declines from the peak for each city included in S&P/Case-Shiller indices.
 Prices increased (SA) in only 3 of the 20 Case-Shiller cities in November seasonally adjusted.
 Prices in Las Vegas are off 57.8% from the peak, and prices in Dallas only off 8.9% from the peak.
Prices are now falling - and falling just about everywhere. As S&P noted "eight markets – Atlanta, Charlotte, Detroit, Las Vegas, Miami, Portland (OR), Seattle and Tampa – hit their lowest levels since home prices peaked in 2006 and 2007". Both composite indices are still slightly above the post-bubble low.
Tuesday, January 11, 2011
CoreLogic: House Prices declined 1.6% in November
by Calculated Risk on 1/11/2011 09:55:00 AM
Notes: CoreLogic reports the year-over-year change. The headline for this post is for the change from October to November 2010. The CoreLogic HPI is a three month weighted average of September,October and November, and is not seasonally adjusted (NSA).
From CoreLogic: CoreLogic® Home Price Index Shows Decline for Fourth Straight Month
CoreLogic ... released its November Home Price Index (HPI) which shows that home prices in the U.S. declined for the fourth month in a row. According to the CoreLogic HPI, national home prices, including distressed sales, declined by 5.07 percent in November 2010 compared to November 2009 and declined by 3.35 percent in October 2010 compared to October 2009. Excluding distressed sales, year-over-year prices declined by 2.21 percent in November 2010 compared to November 2009 and declined by 2.24 in October 2010 compared to October 2009. ...
“We’re continuing to see the influence of seasonal declines that typically depress home prices during the latter part of the year, but the fact that the rate of decline increased for November is indicative of the uphill battle we’re facing with the housing recovery,” said Mark Fleming, chief economist for CoreLogic.
 Click on graph for larger image in graph gallery.
 This graph shows the national CoreLogic HPI data since 1976. January 2000 = 100.
The index is down 5.07% over the last year, and off 30.9% from the peak.
The index is only 1.2% above the low set in March 2009, and I expect to see a new post-bubble low for this index - possibly as early as next month or maybe in early 2011.
Monday, January 03, 2011
House Prices: More Pessimistic Views
by Calculated Risk on 1/03/2011 10:15:00 PM
From CNBC: Home Prices Will Decline for Years: Zuckerman (ht Scott)
Mort Zuckerman ... blamed the continuing price decline on the so-called shadow inventory of foreclosed homes that's yet to come on the market.And from MarketWatch: S&P warns on ‘shadow inventory’ (ht jb)
“That’s what’s going to put downward pressure on residential prices,” Zuckerman added, “And in my judgment, that’s going to continue for several years.”
Standard & Poor’s Ratings Services said Monday that it’s taking longer for the U.S. housing market to absorb foreclosed homes, which means there may be a major drag on prices for a few more years.My view is house prices - as measured by the Case-Shiller and CoreLogic repeat sales indexes - will decline another 5% to 10%. I think it is likely that nominal house prices will bottom in 2011, but that real house prices (inflation adjusted) will decline for another two to three years. (See: Question #1 for 2011: House Prices)
Friday, December 31, 2010
House Price Predictions
by Calculated Risk on 12/31/2010 02:19:00 PM
Here are a few predictions on house prices (I'm working on mine):
• From Peter Schiff in the WSJ: Home Prices Are Still Too High
[The Case Shiller] index would need to decline an additional 20.3% from current levels just to get back to the trend line.So put Schiff down for another 30% or so.
...
With a bleak economic prospect stretching far out into the future, I feel that a 10% dip below the 100-year trend line is a reasonable expectation within the next five years ...
• From Gary Shilling: House Prices Will Now Drop Another 20%
• From Jan Hatzius at Goldman Sachs: Another 5% in 2011.
[W]e now expect house prices to fall another 5% during 2011. The reason is the still-large excess supply, as we have only unwound about one-third of the pre-bubble increase in the homeowner vacancy rate so far.I'll post my prediction soon.
Wednesday, December 29, 2010
Case Shiller House Prices: Which cities will hit post bubble lows next?
by Calculated Risk on 12/29/2010 08:41:00 PM
In the S&P/Case-Shiller report for October, S&P noted:
[S]ix markets – Atlanta, Charlotte, Miami, Portland (OR), Seattle and Tampa – hit their lowest levels since home prices started to fall in 2006 and 2007S&P reports the data Not Seasonally Adjusted (NSA) because of concerns about foreclosures impacting the seasonal factor.
Using the Seasonally Adjusted (SA) series, eleven cities were at post bubble lows; the six cities listed above plus Phoenix, Chicago, Detroit, New York and Las Vegas.
The following graph shows the percent above the post bubble lows for the 20 Case-Shiller cities and the two composite indexes using both SA and NSA data.
 Click on graph for larger image in graph gallery.
 Las Vegas was slightly above the post bubble low NSA (it isn't apparent on the graph).
We can probably guess the cities that will set new post bubble lows in November. Using the NSA data, Las Vegas, New York and Detroit will all probably join the list above setting new lows.
Using the SA data, Dallas, Cleveland, Denver, and maybe the Composite 20 index will be at new lows.
Note: Earlier I posted A few for Graphs for 2010. Enjoy!
Tuesday, December 28, 2010
House Prices and Months-of-Supply, and Real House Prices
by Calculated Risk on 12/28/2010 11:35:00 AM
This morning S&P/Case-Shiller released the monthly Home Price indexes for October (a three month average). Here is a look at house prices and existing home months-of-supply, and also real house prices (2nd graph).
 Click on graph for larger image in graph gallery.
This graph shows existing home months-of-supply (left axis), and the annualized change in the Case-Shiller composite 20 house price index (right axis, inverted).
House prices are through October using the composite 20 index. Months-of-supply is through November.
We need to watch inventory and months-of-supply closely for hints about house prices. The recent surge in existing home inventory - and increase in the months-of-supply - is one of the reasons I expected house prices to fall another 5% to 10%. S&P is also forecasting additional price declines.
Note: there have been periods with high months-of-supply and rising house prices (see: Lawler: Again on Existing Home Months’ Supply: What’s “Normal?” ) so this is just a guide.
The following graph shows the Case-Shiller Composite 20 index, and the CoreLogic House Price Index in real terms (adjusted for inflation using CPI less shelter).
 In real terms, both indexes are back to early 2001 prices. Also both indexes are at post-bubble lows.
A few key points:
• This is worth repeating: the real price indexes are at post-bubble lows. Those who argued prices bottomed some time ago are already wrong in real terms, and will probably be wrong in nominal terms soon.
• Don't expect real prices to fall to '98 levels. In many areas - if the population is increasing - house prices increase slightly faster than inflation over time, so there is an upward slope in real prices.
• Real prices are still too high, but they are much closer to the eventual bottom than the top in 2005. This isn't like in 2005 when prices were way out of the normal range.
• With high levels of inventory, prices will probably fall some more. (I'll update my price forecast soon).
Case-Shiller: Home Prices Weaken Further in October
by Calculated Risk on 12/28/2010 09:00:00 AM
S&P/Case-Shiller released the monthly Home Price Indices for October (actually a 3 month average of August, September and October).
This includes prices for 20 individual cities and and two composite indices (for 10 cities and 20 cities).
Note: Case-Shiller reports NSA, I use the SA data.
From S&P: U.S. Home Prices Weaken Further as Six Cities Make New Lows
Data through October 2010, released today by Standard & Poor’s for its S&P/Case-Shiller1 Home Price Indices, the leading measure of U.S. home prices, show a deceleration in the annual growth rates in 18 of the 20 MSAs and the 10- and 20-City Composites in October compared to what was reported for September 2010. The 10-City Composite was up only 0.2% and the 20-City Composite fell 0.8% from their levels in October 2009. Home prices decreased in all 20 MSAs and both Composites in October from their September levels. In October, only the 10-City Composite and four MSAs – Los Angeles, San Diego, San Francisco and Washington DC – showed year-over-year gains. While the composite housing prices are still above their spring 2009 lows, six markets – Atlanta, Charlotte, Miami, Portland (OR), Seattle and Tampa – hit their lowest levels since home prices started to fall in 2006 and 2007, meaning that average home prices in those markets have fallen beyond the recent lows seen in most other markets in the spring of 2009.
 Click on graph for larger image in new window.
 The first graph shows the nominal seasonally adjusted Composite 10 and Composite 20 indices (the Composite 20 was started in January 2000).
The Composite 10 index is off 30.7% from the peak, and down 0.9% in October(SA).
The Composite 20 index is off 30.5% from the peak, and down 1.0% in October (SA).
 The second graph shows the Year over year change in both indices.
The Composite 10 SA is up 0.2% compared to October 2009.
The Composite 20 SA is down 0.8% compared to October 2009. This is the first year-over-year decline since 2009.
The third graph shows the price declines from the peak for each city included in S&P/Case-Shiller indices.
 Prices increased (SA) in only 2 of the 20 Case-Shiller cities in October seasonally adjusted. Only Denver and Wash, D.C. saw small price increases (SA) in October, and prices fell in all cities NSA.
 Prices in Las Vegas are off 57.8% from the peak, and prices in Dallas only off 8.6% from the peak.
Prices are now falling - and falling just about everywhere. As S&P noted "six markets – Atlanta, Charlotte, Miami, Portland (OR), Seattle and Tampa – hit their lowest levels since home prices started to fall in 2006 and 2007". More cities will join them soon.
Thursday, December 16, 2010
CoreLogic: House Prices declined 1.9% in October
by Calculated Risk on 12/16/2010 11:17:00 AM
Notes: CoreLogic reports the year-over-year change. The headline for this post is for the change from September to October 2010. The CoreLogic HPI is a three month weighted average of August, September and October, and is not seasonally adjusted (NSA).
From CoreLogic: Home Price Index Shows Decline for Third Straight Month, October Home Prices Declined 3.93 Percent Year Over Year
CoreLogic ... today released today released its October Home Price Index (HPI) which shows that home prices in the U.S. declined for the third month in a row. According to the CoreLogic HPI, national home prices, including distressed sales, declined by 3.93 percent in October 2010 compared to October 2009 and declined by 2.43 percent* in September 2010 compared to September 2009. Excluding distressed sales, year-over-year prices declined by 1.5 percent in October 2010 compared to October 2009. ...
“We are continuing to see the weakness in home prices without artificial government support in the form of tax credits. The stubborn unemployment levels and seasonality are also coming into play,” said Mark Fleming, chief economist for CoreLogic. “When you combine these factors with high shadow and visible inventories, the prospect for a housing recovery in early 2011 is fading.”
 Click on graph for larger image in graph gallery.
 This graph shows the national CoreLogic HPI data since 1976. January 2000 = 100.
The index is down 3.93% over the last year, and off 30.2% from the peak.
The index is 2.2% above the low set in March 2009, and I expect to see a new post-bubble low for this index - possibly as early as next month or maybe in early 2011.
Tuesday, November 30, 2010
Real House Prices, Q3 2010
by Calculated Risk on 11/30/2010 12:04:00 PM
This morning, S&P reported that there were "broad based" house price declines in Q3. And earlier this month, CoreLogic reported that house prices declined 1.8% in September.
The following graph shows the Case-Shiller National index (quarterly), the Case-Shiller Composite 20 index, and the CoreLogic House Price Index in real terms (adjusted for inflation using CPI less shelter).
 Click on graph for larger image in new window.
In real terms, all three indexes are back to 2000 / 2001 prices. The real Case-Shiller national index is at a new cycle low, and the real Case-Shiller Composite 20 and real CoreLogic indexes are just above the cycle low (and will be at new lows soon).
A few key points:
• In many areas - if the population is increasing - house prices increase slightly faster than inflation over time, so there is an upward slope in real prices.
• Even if real prices are still too high, they are much closer to the eventual bottom than the top in 2005. This isn't like in 2005 when prices were way out of the normal range.
• With high levels of inventory, prices will probably fall some more. (My forecast earlier this year was for 5% to 10% additional price declines on the repeat sales indexes).
Case-Shiller: Broad-based Declines in Home Prices in Q3
by Calculated Risk on 11/30/2010 09:00:00 AM
S&P/Case-Shiller released the monthly Home Price Indices for September (actually a 3 month average of July, August and September).
This includes prices for 20 individual cities, and two composite indices (10 cities and 20 cities), and the quarterly national index.
Note: Case-Shiller reports NSA, I use the SA data.
From S&P: Broad-based Declines in Home Prices in the 3rd Quarter of 2010
Data through September 2010, released today by Standard & Poor’s for its S&P/Case-Shiller Home Price Indices ... show that the U.S. National Home Price Index declined 2.0% in the third quarter of 2010, after having risen 4.7% in the second quarter. Nationally, home prices are 1.5% below their year-earlier levels. In September, 18 of the 20 MSAs covered by S&P/Case-Shiller Home Price Indices and both monthly composites were down; and only the two composites and five MSAs showed year-over-year gains. While housing prices are still above their spring 2009 lows, the end of the tax incentives and still active foreclosures appear to be weighing down the market.
 Click on graph for larger image in new window.
 The first graph shows the nominal seasonally adjusted Composite 10 and Composite 20 indices (the Composite 20 was started in January 2000).
The Composite 10 index is off 29.8% from the peak, and down 0.7% in September(SA).
The Composite 20 index is off 29.6% from the peak, and down 0.8% in September (SA).
 The second graph shows the Year over year change in both indices.
The Composite 10 is up 1.5% compared to September 2009.
The Composite 20 is up 0.5% compared to September 2009.
Case-Shiller reported that nationally home prices are 1.5% below their year-earlier levels. The year-over-year increases in the composite indexes are slowing, and will probably be negative later this year.
The third graph shows the price declines from the peak for each city included in S&P/Case-Shiller indices.
 Prices increased (SA) in only 1 of the 20 Case-Shiller cities in September seasonally adjusted. Only Wash, D.C. saw a price increase (SA) in September, and that was very small.
 Prices in Las Vegas are off 57.6% from the peak, and prices in Dallas only off 8.1% from the peak.
Prices are now falling - and falling just about everywhere. And it appears there are more price declines coming (based on inventory levels and anecdotal reports).
Wednesday, November 17, 2010
CoreLogic: House Prices declined 1.8% in September
by Calculated Risk on 11/17/2010 11:41:00 AM
Notes: CoreLogic reports the year-over-year change. The headline for this post is for the change from August 2010 to September 2010. The CoreLogic HPI is a three month weighted average of July, August, and September and is not seasonally adjusted (NSA).
From CoreLogic: September Home Prices Declined 2.79 Percent Year Over Year
CoreLogic ... today released today released its September Home Price Index (HPI) that shows that home prices in the U.S. declined for the second month in a row after rising slightly for the first seven months of the year. According to the CoreLogic HPI, national home prices, including distressed sales, declined 2.79 percent in September 2010 compared to September 2009 and declined by 1.08 percent [revised] in August 2010 compared to August 2009. Excluding distressed sales, year-over-year prices declined .73 percent in September 2010.. ...
“We’re continuing to see price declines across the board with all but seven states seeing a decrease in home prices,” said Mark Fleming, chief economist for CoreLogic. “This continued and widespread decline will put further pressure on negative equity and stall the housing recovery.”
 Click on graph for larger image in new window.
 This graph shows the national CoreLogic HPI data since 1976. January 2000 = 100.
The index is down 2.8% over the last year, and off 29.2% from the peak.
The index is 3.9% above the low set in March 2009, and I expect to see a new post-bubble low for this index later this year or early in 2011. As Fleming noted, prices are falling in most areas now.
Thursday, October 28, 2010
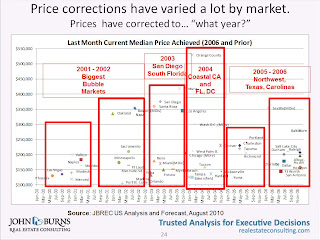
House Prices have corrected to what year?
by Calculated Risk on 10/28/2010 05:45:00 PM
Housing consultant John Burns presented this slide as part of the UCLA Anderson Forecast this week:
 Click on graph for larger image in new window.
John Burns used median prices for this slide. It shows that the "biggest bubble markets" are back to 2000 to 2002 median prices, whereas some areas are still at 2006 prices.
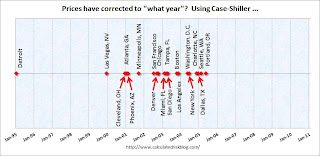
And here is a timeline for the 20 Case-Shiller cities:
 There is no y-axis because this is based on a price index (not median prices).
Detroit is back to 1995 prices, and some cities like Dallas, Portland and Seattle are only back to 2005 or 2006 prices (the bubble arrived later in the Northwest).
Tuesday, October 26, 2010
Real House Prices, Price-to-Rent Ratio
by Calculated Risk on 10/26/2010 11:45:00 AM
Yesterday CoreLogic reported that house prices declined 1.2% in August, and this morning S&P Case-Shiller reported widespread price declines in August (really an average of June, July and August).
 Click on graph for larger image in new window.
This post looks at real prices and the price-to-rent ratio, but first here is a graph of the two Case-Shiller composite indexes, and the CoreLogic HPI (NSA).
All three indexes are above the lows of early 2009, but it appears that prices are now falling - and I expect all three indexes to show new lows later this year or in early 2011.
Price-to-Rent
In October 2004, Fed economist John Krainer and researcher Chishen Wei wrote a Fed letter on price to rent ratios: House Prices and Fundamental Value. Kainer and Wei presented a price-to-rent ratio using the OFHEO house price index and the Owners' Equivalent Rent (OER) from the BLS.
 Here is a similar graph through August 2010 using the Case-Shiller Composite 20 and CoreLogic House Price Index.
This graph shows the price to rent ratio (January 1998 = 1.0).
Recent reports suggest rents might have bottomed, but this suggests that house prices are still a little too high on a national basis.
Real House Prices
 The third graph shows the CoreLogic house price index and the Case-Shiller Composite 20 index through August 2010 in real terms (adjusted with CPI less Shelter).
These indexes are still above the 2009 lows in real terms, but it is getting close, and I expect new real price lows sometime in the next few months.
This isn't like in 2005 when prices were way out of the normal range by these measures, but it does appear prices are still a little too high. And with high levels of inventory, prices will probably fall some more.
Case-Shiller: Home Price declines widespread in August
by Calculated Risk on 10/26/2010 09:00:00 AM
S&P/Case-Shiller released the monthly Home Price Indices for August (actually a 3 month average of June, July and August).
This includes prices for 20 individual cities, and two composite indices (10 cities and 20 cities).
Note: Case-Shiller reports NSA, I use the SA data.
From S&P: Home Prices Increases Slow Down in August
Data through August 2010, released today by Standard & Poor’s for its S&P/Case-Shiller1 Home Price Indices, the leading measure of U.S. home prices, show a deceleration in the annual growth rates in 17 of the 20 MSAs and the 10- and 20-City Composites in August compared to what was reported for July 2010. The 10-City Composite was up 2.6% and the 20-City Composite was up 1.7% from their levels in August 2009. Home prices decreased in 15 of the 20 MSAs and both Composites in August from their July levels.
 Click on graph for larger image in new window.
 The first graph shows the nominal seasonally adjusted Composite 10 and Composite 20 indices (the Composite 20 was started in January 2000).
The Composite 10 index is off 29.2% from the peak, and down 0.2% in August(SA).
The Composite 20 index is off 28.8% from the peak, and down 0.3% in August (SA).
 The second graph shows the Year over year change in both indices.
The Composite 10 is up 2.5% compared to August 2009.
The Composite 20 is up 1.7% compared to August 2009.
The year-over-year increases are slowing and will probably be negative later this year.
The third graph shows the price declines from the peak for each city included in S&P/Case-Shiller indices.
 Prices increased (SA) in only 1 of the 20 Case-Shiller cities in August seasonally adjusted. Only New York saw a price increase (SA) in August, and that was very small.
 Prices in Las Vegas are off 57.5% from the peak, and prices in Dallas only off 6.9% from the peak.
Prices are now falling - and falling just about everywhere. And it appears there are more price declines coming (based on inventory levels and anecdotal reports).
Monday, October 25, 2010
CoreLogic: House Prices Declined 1.2% in August
by Calculated Risk on 10/25/2010 01:41:00 PM
Notes: CoreLogic reports the year-over-year change. The headline for this post is for the change from July 2010 to August 2010. The CoreLogic HPI is a three month weighted average of June, July and August, and is not seasonally adjusted (NSA).
From CoreLogic: August Home Prices Declined 1.5 Percent Year Over Year
CoreLogic ... today released its Home Price Index (HPI) which shows that home prices in the U.S. declined for the first time this year. According to the CoreLogic HPI, national home prices, including distressed sales, declined 1.5 percent in August 2010 compared to August 2009 and increased by 0.6 percent in July 2010 compared to July 2009. Excluding distressed sales, year-over-year prices declined 0.4 percent in August 2010. ...
“Price declines are geographically expanding as 78 out of the largest 100 metropolitan areas are experiencing declines, up from 58 just one month ago” said Mark Fleming, chief economist for CoreLogic.
 Click on graph for larger image in new window.
 This graph shows the national CoreLogic HPI data since 1976. January 2000 = 100.
The index is down 1.5% over the last year, and off 28.2% from the peak.
The index is 5.4% above the low set in March 2009, and I expect to see a new post-bubble low for this index later this year or early in 2011. As Fleming noted, prices are falling in most areas now (unusually for the summer months).
Earlier posts on Existing Home sales:
Tuesday, September 28, 2010
Case-Shiller: "Home Prices Stable in July"
by Calculated Risk on 9/28/2010 09:00:00 AM
S&P/Case-Shiller released the monthly Home Price Indices for July (actually a 3 month average of May, June and July).
This includes prices for 20 individual cities, and two composite indices (10 cities and 20 cities).
Note: Case-Shiller reports NSA, I use the SA data.
From S&P: Home Prices Remain Stable Around Recent Lows According to the S&P/Case-Shiller Home Price Indices
Data through July 2010, released today by Standard & Poor’s for its S&P/Case-Shiller Home Price Indices, the leading measure of U.S. home prices, show that the annual growth rates in 16 of the 20 MSAs and the 10- and 20-City Composites slowed in July compared to June 2010. The 10-City Composite is up 4.1% and the 20-City Composite is up 3.2% from where they were in July 2009. For June they were reported as +5.0% and +4.2%, respectively. Although home prices increased in most markets in July versus June, 15 MSAs and both Composites saw these monthly rates moderate in July.
 Click on graph for larger image in new window.
 The first graph shows the nominal seasonally adjusted Composite 10 and Composite 20 indices (the Composite 20 was started in January 2000).
The Composite 10 index is off 29.0% from the peak, and flat in July (SA).
The Composite 20 index is off 28.6% from the peak, and down 0.1% in July (SA).
 The second graph shows the Year over year change in both indices.
The Composite 10 is up 4.0% compared to July 2009.
The Composite 20 is up 3.1% compared to July 2009.
The year-over-year changes appear to be rolling over - and will probably be negative later this year.
The third graph shows the price declines from the peak for each city included in S&P/Case-Shiller indices.
 Prices increased (SA) in only 4 of the 20 Case-Shiller cities in July seasonally adjusted.
Prices in Las Vegas are off 57.2% from the peak, and prices in Dallas only off 5.7% from the peak.
Prices probably declined just about everywhere in July, but this will not be evident in the Case-Shiller index until next month since the Case-Shiller index is an average of three months.
Wednesday, September 15, 2010
CoreLogic: House Prices decline 0.6% in July
by Calculated Risk on 9/15/2010 11:18:00 AM
Notes: CoreLogic reports the year-over-year change. The headline for this post is for the change from June 2010 to July 2010. The CoreLogic HPI is a three month weighted average of May, June and July and is NSA.
From CoreLogic (formerly First American LoanPerformance): CoreLogic Home Price Index Remained Flat in July
CoreLogic ... today released its Home Price Index (HPI) that showed that home prices in the U.S. remained flat in July as transaction volumes continue to decline. This was the first time in five months that no year-over-year gains were reported. According to the CoreLogic HPI, national home prices, including distressed sales showed no change in July 2010 compared to July 2009. June 2010 HPI showed a 2.4 percent year-over-year gain compared to June 2009. ...
Although home prices were flat nationally, the majority of states experienced price declines and price declines are spreading across more geographies relative to a few months ago. Home prices fell in 36 states in July, nearly twice the number in May and the highest since last November when national home prices were declining," said Mark Fleming, chief economist for CoreLogic.
 Click on graph for larger image in new window.
 This graph shows the national CoreLogic HPI data since 1976. January 2000 = 100.
The index is flat over the last year, and off 28% from the peak.
The index is 6.1% above the low set in March 2009, and I expect to see a new post-bubble low for this index later this year or early in 2011.


