 RSS Feed
 by Calculated Risk on 9/28/2010 09:00:00 AM
Tuesday, September 28, 2010
Case-Shiller: "Home Prices Stable in July"
S&P/Case-Shiller released the monthly Home Price Indices for July (actually a 3 month average of May, June and July).
This includes prices for 20 individual cities, and two composite indices (10 cities and 20 cities).
Note: Case-Shiller reports NSA, I use the SA data.
From S&P: Home Prices Remain Stable Around Recent Lows According to the S&P/Case-Shiller Home Price Indices
Data through July 2010, released today by Standard & Poor’s for its S&P/Case-Shiller Home Price Indices, the leading measure of U.S. home prices, show that the annual growth rates in 16 of the 20 MSAs and the 10- and 20-City Composites slowed in July compared to June 2010. The 10-City Composite is up 4.1% and the 20-City Composite is up 3.2% from where they were in July 2009. For June they were reported as +5.0% and +4.2%, respectively. Although home prices increased in most markets in July versus June, 15 MSAs and both Composites saw these monthly rates moderate in July.
 Click on graph for larger image in new window.
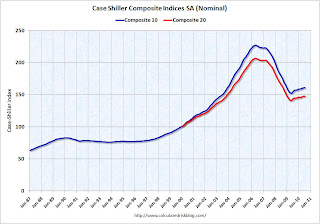
 The first graph shows the nominal seasonally adjusted Composite 10 and Composite 20 indices (the Composite 20 was started in January 2000).
The Composite 10 index is off 29.0% from the peak, and flat in July (SA).
The Composite 20 index is off 28.6% from the peak, and down 0.1% in July (SA).
 The second graph shows the Year over year change in both indices.
The Composite 10 is up 4.0% compared to July 2009.
The Composite 20 is up 3.1% compared to July 2009.
The year-over-year changes appear to be rolling over - and will probably be negative later this year.
The third graph shows the price declines from the peak for each city included in S&P/Case-Shiller indices.
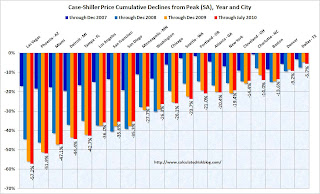 Prices increased (SA) in only 4 of the 20 Case-Shiller cities in July seasonally adjusted.
Prices in Las Vegas are off 57.2% from the peak, and prices in Dallas only off 5.7% from the peak.
Prices probably declined just about everywhere in July, but this will not be evident in the Case-Shiller index until next month since the Case-Shiller index is an average of three months.


