by Calculated Risk on 11/30/2010 09:00:00 AM
Tuesday, November 30, 2010
Case-Shiller: Broad-based Declines in Home Prices in Q3
S&P/Case-Shiller released the monthly Home Price Indices for September (actually a 3 month average of July, August and September).
This includes prices for 20 individual cities, and two composite indices (10 cities and 20 cities), and the quarterly national index.
Note: Case-Shiller reports NSA, I use the SA data.
From S&P: Broad-based Declines in Home Prices in the 3rd Quarter of 2010
Data through September 2010, released today by Standard & Poor’s for its S&P/Case-Shiller Home Price Indices ... show that the U.S. National Home Price Index declined 2.0% in the third quarter of 2010, after having risen 4.7% in the second quarter. Nationally, home prices are 1.5% below their year-earlier levels. In September, 18 of the 20 MSAs covered by S&P/Case-Shiller Home Price Indices and both monthly composites were down; and only the two composites and five MSAs showed year-over-year gains. While housing prices are still above their spring 2009 lows, the end of the tax incentives and still active foreclosures appear to be weighing down the market.
 Click on graph for larger image in new window.
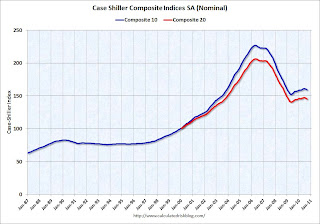
 The first graph shows the nominal seasonally adjusted Composite 10 and Composite 20 indices (the Composite 20 was started in January 2000).
The Composite 10 index is off 29.8% from the peak, and down 0.7% in September(SA).
The Composite 20 index is off 29.6% from the peak, and down 0.8% in September (SA).
 The second graph shows the Year over year change in both indices.
The Composite 10 is up 1.5% compared to September 2009.
The Composite 20 is up 0.5% compared to September 2009.
Case-Shiller reported that nationally home prices are 1.5% below their year-earlier levels. The year-over-year increases in the composite indexes are slowing, and will probably be negative later this year.
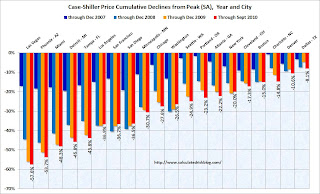
The third graph shows the price declines from the peak for each city included in S&P/Case-Shiller indices.
 Prices increased (SA) in only 1 of the 20 Case-Shiller cities in September seasonally adjusted. Only Wash, D.C. saw a price increase (SA) in September, and that was very small.
 Prices in Las Vegas are off 57.6% from the peak, and prices in Dallas only off 8.1% from the peak.
Prices are now falling - and falling just about everywhere. And it appears there are more price declines coming (based on inventory levels and anecdotal reports).


