 RSS Feed
 by Calculated Risk on 1/14/2010 08:55:00 AM
Showing posts with label retail. Show all posts
Showing posts with label retail. Show all posts
Thursday, January 14, 2010
Retail Sales decline slightly in December
On a monthly basis, retail sales decreased 0.3% from November to December (seasonally adjusted), and sales were up 5.4% from December 2008 (easy comparison).  Click on graph for larger image in new window.
This graph shows retail sales since 1992. This is monthly retail sales, seasonally adjusted (total and ex-gasoline).
This shows that retail sales fell off a cliff in late 2008, and appear to have bottomed, but at a much lower level.
The red line shows retail sales ex-gasoline and shows there has been only a little increase in final demand. The second graph shows the year-over-year change in retail sales since 1993.
Retail sales increased by 5.4% on a YoY basis. The year-over-year comparisons are much easier now since retail sales collapsed in October 2008. Retail sales bottomed in December 2008.
Here is the Census Bureau report:
The U.S. Census Bureau announced today that advance estimates of U.S. retail and food services sales for December, adjusted for seasonal variation and holiday and trading-day differences, but not for price changes, were $353.0 billion, a decrease of 0.3 percent (±0.5%)* from the previous month, but 5.4 percent (±0.5%) above December 2008. Total sales for the 12 months of 2009 were down 6.2 percent (±0.2%) from 2008. Total sales for the October through December 2009 period were up 1.9 percent (±0.3%) from the same period a year ago. The October to November 2009 percent change was revised from +1.3 percent (±0.5%) to +1.8 percent (±0.2%).It appears retail sales might have bottomed, and there has been little pickup in final demand.
Saturday, December 19, 2009
"Snowmaggedon" for Northeast Retailers
by Calculated Risk on 12/19/2009 10:01:00 AM
From the WaPo: For retailers, snow would pile on
Retailers can stop accusing the economy of holding back holiday sales. Now they can blame it on the weather.Blame it on the weather!
The mighty blizzard expected to descend on the Northeast today comes on the last Saturday before Christmas, typically the busiest day of the year for retailers. But with as much as a foot of snow forecast from North Carolina to New Jersey, retailers are worried that their customers will spend the Super Saturday shoveling rather than shopping. One meteorologist predicts that could result in a retail snowmaggedon.
Friday, December 11, 2009
Retail Sales increase in November
by Calculated Risk on 12/11/2009 08:30:00 AM
On a monthly basis, retail sales increased 1.3% from October to November (seasonally adjusted), and sales are up 1.9% from November 2008.  Click on graph for larger image in new window.
This graph shows retail sales since 1992. This is monthly retail sales, seasonally adjusted (total and ex-gasoline).
This shows that retail sales fell off a cliff in late 2008, and appear to have bottomed, but at a much lower level.
The red line shows retail sales ex-gasoline and shows there has been only a little increase in final demand. The second graph shows the year-over-year change in retail sales since 1993.
Retail sales increased by 1.9% on a YoY basis. The year-over-year comparisons are much easier now since retail sales collapsed in October 2008. Retail sales bottomed in December 2008.
Here is the Census Bureau report:
The U.S. Census Bureau announced today that advance estimates of U.S. retail and food services sales for November, adjusted for seasonal variation and holiday and trading-day differences, but not for price changes, were $352.1 billion, an increase of 1.3 percent (±0.5%) from the previous month and 1.9 percent (±0.5%) above November 2008. Total sales for the September through November 2009 period were down 2.1 percent (±0.3%) from the same period a year ago. The September to October 2009 percent change was revised from +1.4 percent (±0.5%) to +1.1 percent (±0.2%).It appears retail sales have bottomed, and there might be a little pickup in final demand.
Thursday, December 10, 2009
Retail Sales: "Looks like the middle of August out there"
by Calculated Risk on 12/10/2009 08:19:00 PM
November retail sales will be released tomorrow morning, but December is apparently off to a slow start ...
From the WSJ: Sales Lull Has Retailers Worried
The first week of December, typically a lackluster time in the wake of Black Friday, was particularly slow. ... "After solid traffic the first couple of days, it looks like the middle of August out there," said Stephen Baker, vice president of industry analysis for retail watcher NPD Group.And on a key category: Videogames Sales Fall Again in November
Combined November videogame software and hardware revenue fell 7.6% from a year earlier to $2.69 billion, data tracker NPD said Thursday. But revenue from videogame sales fell a surprising 3.1% amid expectations of mild growth in the mid-single-digit percentage range.Without growth in consumer spending, the recovery will be sluggish at best.
Sunday, November 29, 2009
NRF: Number of Shoppers Up, Average Spending Down
by Calculated Risk on 11/29/2009 01:33:00 PM
From the NRF: Black Friday Verdict: As Expected, Number of Shoppers Up, Average Spending Down
... a National Retail Federation survey conducted over the weekend confirms the expected: more people spent less. According to NRF’s Black Friday shopping survey, conducted by BIGresearch, 195 million shoppers visited stores and websites over Black Friday weekend, up from 172 million last year. However, the average spending over the weekend dropped to $343.31 per person from $372.57 a year ago. ...This is for "stores and websites" - not just brick and mortar.
“Shoppers proved this weekend that they were willing to open their wallets for a bargain, heading out to take advantage of great deals on less expensive items like toys, small appliances and winter clothes,” said Tracy Mullin, NRF President and CEO.
...
“During a more robust economy, people may be inclined to hit the “snooze” button on Black Friday, but high unemployment and a focus on price caused shoppers to visit stores early in anticipation of the best deals,” said Phil Rist, Executive Vice President, Strategic Initiatives, BIGresearch.
* NRF’s definition of “Black Friday weekend” includes Thursday, Friday, Saturday and projected spending for Sunday.
Monday, November 16, 2009
Retail Sales Increase in October
by Calculated Risk on 11/16/2009 08:30:00 AM
On a monthly basis, retail sales increased 1.4% from September to October (seasonally adjusted), and sales are off 1.7% from October 2008. Excluding auto sales and parts, retail sales rose 0.2% in October.
The increase in October was mostly a rebound from the decline in September. Click on graph for larger image in new window.
This graph shows retail sales since 1992. This is monthly retail sales, seasonally adjusted (total and ex-gasoline).
This shows that retail sales fell off a cliff in late 2008, and appear to have bottomed, but at a much lower level.
The red line shows retail sales ex-gasoline and shows there has been little increase in final demand. The second graph shows the year-over-year change in retail sales since 1993.
Real retail sales declined by 1.7% on a YoY basis. The year-over-year comparisons are much easier now since retail sales collapsed in October 2008. Retail sales bottomed in December 2008.
Here is the Census Bureau report:
The U.S. Census Bureau announced today that advance estimates of U.S. retail and food services sales for October, adjusted for seasonal variation and holiday and trading-day differences, but not for price changes, were $347.5 billion, an increase of 1.4 percent (±0.5%) from the previous month, but 1.7 percent (±0.5%) below October 2008. Total sales for the August through October 2009 period were up 1.5 percent (±0.3%) from the same period a year ago. The August to September 2009 percent change was revised from -1.5 percent (±0.5%) to -2.3 percent (±0.3%).It appears retail sales have bottomed, but there has been little pickup in final demand.
Tuesday, October 20, 2009
NRF: Economy Impacting Holiday Spending Plans for Two-Thirds of Families
by Calculated Risk on 10/20/2009 12:12:00 AM
From the National Retail Federation: Economy to Impact Two-Thirds of Families this Holiday Season, According to NRF Survey
Retailers are about to embark on the holiday season of the serious bargain hunter. According to NRF’s 2009 Holiday Consumer Intentions and Actions Survey, conducted by BIGresearch, U.S. consumers plan to spend an average of $682.74 on holiday-related shopping, a 3.2 percent drop from last year’s $705.01.And this will mean few seasonal retail hires too.
It comes as no surprise that the economy was an overriding theme throughout this year’s survey. Two-thirds of Americans (65.3%) say the economy will affect their holiday plans this year, with the majority of these consumers saying they’re adjusting by simply spending less ...
Retailers are compensating for soft sales this holiday season by cutting back on inventory. ... “In anticipation of weak demand, many retailers scaled back on inventory levels to prevent unplanned markdowns at the end of the season,” said NRF President and CEO Tracy Mullin ...
“While the economic climate has shown some improvement from last holiday season, retailers are not out of the woods yet,” said Phil Rist, Executive Vice President, Strategic Initiatives, BIGresearch. “With a variety of factors still up in the air, including uncertainty over job security, many Americans just aren’t buying into the talk of recovery.”
The NRF is so depressing ...
Wednesday, October 14, 2009
Retail Sales Decrease in September
by Calculated Risk on 10/14/2009 08:30:00 AM
On a monthly basis, retail sales decreased 1.5% from August to September (seasonally adjusted), and sales are off 5.7% from September 2008 (retail ex food services decreased 6.4%).
Excluding motor vehicles, retail sales were up 0.5%. Click on graph for larger image in new window.
This graph shows real retail sales (adjusted with PCE) since 1992. This is monthly retail sales, seasonally adjusted.
NOTE: The graph doesn't start at zero to better show the change.
This shows that retail sales fell off a cliff in late 2008, and appear to have bottomed, but at a much lower level. The second graph shows the year-over-year change in nominal and real retail sales since 1993.
To calculate the real change, the core PCI price index from the BLS was used (August prices were estimated as the average increase over the previous 3 months).
Real retail sales (ex food services) declined by 7.9% on a YoY basis.
Here is the Census Bureau report:
The U.S. Census Bureau announced today that advance estimates of U.S. retail and food services sales for September, adjusted for seasonal variation and holiday and trading-day differences, but not for price changes, were $344.7 billion, a decrease of 1.5 percent (±0.5%) from the previous month and 5.7 percent (±0.7%) below September 2008. Total sales for the July through September 2009 period were down 6.6 percent (±0.3%) from the same period a year ago. The July to August 2009 percent change was revised from +2.7 percent (±0.5%) to +2.2 percent (±0.2%).The large decrease in retail sales was because of the end of Cash-for-clunkers in August. Excluding autos, retail sales increased in September, but are still far below year ago levels.
Thursday, October 08, 2009
Reis: Strip Mall Vacancy Rate Hits 10.3%, Highest Since 1992
by Calculated Risk on 10/08/2009 09:05:00 AM
 Click on graph for larger image in new window.
Reis reports the strip mall vacancy rate hit 10.3% in Q3 2009; the highest vacancy rate since 1992. And rents are cliff diving ...
From Reuters: Shopping center vacancy rate hits 17-year high: report
"Our outlook for retail properties as a whole is bleak," Victor Calanog, Reis director of research, said. "Until we see stabilization and recovery take root in both consumer spending and business spending and hiring, we do not foresee a recovery in the retail sector until late 2012 at the earliest."A grim outlook: no recovery seen in the retail CRE sector "until late 2012 at the earliest".
...
The third-quarter vacancy rate at U.S. strip malls, which include local shopping and big-box centers, rose 0.3 percentage points from the second quarter to 10.3 percent, the highest since 1992, Reis said.
...
Factoring in months of free rent and other perks, effective rent fell 0.8 percent from the second quarter to $16.89 per square foot or down 3.8 percent from the third quarter 2008. Rents were the lowest since mid-2007
...
"Since asking and effective rent growth only turned negative about one year ago, it is daunting to observe this acceleration in decline in what has traditionally been regarded as a stable property type," Calanog said.
Malls. Offices. Apartments. The story is the same: rising vacancies and falling rents. Here are the earlier reports this week on offices and apartments:
U.S. Office Vacancy Rate Hits 16.5% in Q3
Apartment Vacancy Rate at 23 Year High
Tuesday, October 06, 2009
NRF Forecasts One Percent Decline in Holiday Retail Sales
by Calculated Risk on 10/06/2009 08:50:00 AM
From the National Retail Federation: NRF Forecasts One Percent Decline in Holiday Sales
The National Retail Federation today released its 2009 holiday forecast, projecting holiday retail industry sales to decline one percent this year to $437.6 billion.* While this number falls significantly below the ten-year average of 3.39 percent holiday season growth, the decline is not expected to be as dramatic as last year’s 3.4 percent drop in holiday retail sales ...Notice the focus on cost controls, and that suggests retail hiring for the holiday season will be weak.
“The expectation of another challenging holiday season does not come as news to retailers, who have been experiencing a pullback in consumer spending for over a year,” said NRF President and CEO Tracy Mullin. “To compensate, retailers’ focus on the holiday season has been razor-sharp with companies cutting back as much as possible on operating costs in order to pass along aggressive savings and promotions to customers.”
* NRF defines “holiday sales” as retail industry sales in the months of November and December. Retail industry sales include most traditional retail categories including discounters, department stores, grocery stores, and specialty stores, and exclude sales at automotive dealers, gas stations, and restaurants.
Here is a repeat of a graph from a post a couple weeks ago: Retail Hiring Outlook "Jobs Scarce"
 Click on graph for larger image in new window.
Typically retail companies start hiring for the holiday season in October, and really increase hiring in November. This graph shows the historical net retail jobs added for October, November and December by year.
Based on the NRF forecast, seasonal retail hiring might be around 400 thousand again in 2009.
More from Ylan Mui at the WaPo: Retailers Hope for Holiday Cheer
The retail federation's forecast "is a good number in that it shows stabilizing in sales," NRF spokesman Scott Krugman said. "However, it also acknowledges that the recovery is not going to be consumer-led."Typically recoveries are consumer led, and then the increase in end demand eventually leads to more business investment. Not this time. Just another reminder that the typical engines of recovery are still misfiring.
Saturday, October 03, 2009
NY Times: Retailers Expect No Growth in Holiday Spending
by Calculated Risk on 10/03/2009 01:43:00 PM
From the NY Times: Retailers Expect Flat Christmas Sales This Year
[A] lot of people are thinking about it, and taking surveys to test the mood of the American consumer, and deciding that this Christmas will be as bad as last — which is to say, one of the worst on record.And that suggests that seasonal retail hiring will be weak too. Here is a repeat of a graph from a post a couple weeks ago: Seasonal Retail Hiring
Retailers are relieved to hear that prediction. Flat sales this holiday season would at least mean that things had stopped getting worse ... several reports published in the last few days, including surveys by Nielsen and Deloitte, forecast no change in holiday sales from last year to this year.
Typically retail companies start hiring for the holiday season in October, and really increase hiring in November. This graph shows the historical net retail jobs added for October, November and December by year.
Click on graph for larger image in new window.This really shows the collapse in retail hiring in 2008. This also shows how the season has changed over time - back in the '80s, retailers hired mostly in December. Now the peak month is November, and many retailers start hiring seasonal workers in October.
Given the expectation of no growth in holiday spending, retailers will probably be very cautious hiring again this year.
Wednesday, September 23, 2009
Retail Hiring Outlook "Jobs Scarce"
by Calculated Risk on 9/23/2009 12:30:00 PM
From the WSJ: Holiday Jobs Look Scarce as Pessimism Grips Retail
... About 40% of stores surveyed across a broad swath of retailing ... told the Hay Group, a human resources consulting firm, that they expect to hire between 5% and 25% fewer temporary workers this year than last ...Seasonal retail hiring will be watch closely. Here is a repeat of a graph from a post a couple weeks ago: Seasonal Retail Hiring
That's a grimmer outlook than the Hay survey found a year ago, when 29% of retailers said they would be slashing their holiday workforce.
...
A third of retailers in the survey said they expect sales during Christmas to decline 5% to 25% this year. Another third expect sales to remain the same as last year. Researcher Retail Forward estimates last year was the worst selling season in 42 years with sales declining 4.5% in the fourth quarter. It also issued a forecast predicting sales will be flat with last year's weak numbers."
Typically retail companies start hiring for the holiday season in October, and really increase hiring in November. This graph shows the historical net retail jobs added for October, November and December by year.
Click on graph for larger image in new window.This really shows the collapse in retail hiring in 2008. This also shows how the season has changed over time - back in the '80s, retailers hired mostly in December. Now the peak month is November, and many retailers start hiring seasonal workers in October.
The WSJ article is a little confusing. First they are comparing to last year (with 40% of retailers saying they will hire fewer workers than in 2008). But there is this paragraph:
In a typical Christmas season, the retail sector contributes about 700,000 temporary jobs to the economy. If retailers decrease those numbers by 10% to 20%, that would translate to a potential loss of more than 100,000 jobs this year just when they are most in demand.The 700,000 number is about right (as shown on the graph), but if retailers hire at the pace of last year, employment will be off 300,000 or so from normal.
Tuesday, September 15, 2009
Retail Sales increase in August
by Calculated Risk on 9/15/2009 08:30:00 AM
On a monthly basis, retail sales increased 2.7% from July to August (seasonally adjusted), and sales are off 5.3% from August 2008 (retail ex food services decreased 6.3%).
Excluding motor vehicles, retail sales were up 1.1%.
The following graph shows the year-over-year change in nominal and real retail sales since 1993. Click on graph for larger image in new window.
To calculate the real change, the core PCI price index from the BLS was used (August prices were estimated as the average increase over the previous 3 months).
Real retail sales (ex food services) declined by 6.3% on a YoY basis. The second graph shows real retail sales (adjusted with PCE) since 1992. This is monthly retail sales, seasonally adjusted.
NOTE: The graph doesn't start at zero to better show the change.
This shows that retail sales fell off a cliff in late 2008, and appear to have bottomed, but at a much lower level.
Here is the Census Bureau report:
The U.S. Census Bureau announced today that advance estimates of U.S. retail and food services sales for August, adjusted for seasonal variation and holiday and trading-day differences, but not for price changes, were $351.4 billion, an increase of 2.7 percent (±0.5%) from the previous month, but 5.3 percent (±0.7%) below August 2008. Total sales for the June through August 2009 period were down 7.6 percent (±0.3%) from the same period a year ago. The June to July 2009 percent change was revised from -0.1 percent (±0.5%)* to -0.2 percent (±0.2%)*.It appears the cliff diving is over and the official recession probably ended in July. But retail sales are still far below the pre-recession level, and the recovery will probably be sluggish.
Saturday, August 15, 2009
Retailers Expect Slow Back-to-School Sales
by Calculated Risk on 8/15/2009 12:29:00 AM
From the NY Times: Retailers See Slowing Sales in Back-to-School Season
Halfway through the back-to-school shopping season, retail professionals are predicting the worst performance for stores in more than a decade ...From the National Retail Federation: NRF's 2009 Back-to-School and Back-to-College Surveys
The National Retail Federation, an industry group, expects the average family with school-age children to spend nearly 8 percent less this year than last. And ShopperTrak, a research company, predicted customer traffic would be down 10 percent from a year ago.
“This is going to be the worst back-to-school season in many, many years,” said Craig F. Johnson, president of Customer Growth Partners, a retailing consultant firm.
According to the National Retail Federation’s 2009 Back to School Consumer Intentions and Actions Survey, conducted by BIGresearch, the average family with students in grades Kindergarten through 12 is expected to spend $548.72 on school merchandise, a decline of 7.7 percent from $594.24 in 2008. ...There are some positive signs for the economy - like new home sales, auto sales increasing, and industrial production/capacity utilization possibly bottoming out - but without the consumer, any recovery will be sluggish at best.
According to the survey, the economy is having a major impact on back-to-school spending as four out of five Americans (85%) have made some changes to back-to-school plans this year as a result. Some of those changes impact spending, with 56.2 percent of back-to-school shoppers hunting for sales more often, 49.6 percent planning to spend less overall, 41.7 percent purchasing more store brand/generic products and 40.0 percent are planning to increase their use of coupons. Others say the economy has impacted lifestyle decisions, with 11.4 percent saying children will cut back on extracurricular activities or sports and 5.7 percent saying that the economy is impacting whether their children will attend a private or public school.
“The economy has clearly changed the spending habits of American families, which will likely create a difficult back-to-school season for retailers,” said Tracy Mullin, President and CEO of NRF.
Thursday, August 13, 2009
Retail Sales Decline Slightly in July
by Calculated Risk on 8/13/2009 08:31:00 AM
On a monthly basis, retail sales decreased 0.1% from June to July (seasonally adjusted), and sales are off 8.3% from July 2008 (retail ex food services decreased 9.3%).
The following graph shows the year-over-year change in nominal and real retail sales since 1993. Click on graph for larger image in new window.
To calculate the real change, the monthly PCE price index from the BEA was used (July PCE prices were estimated as the average increase over the previous 3 months).
Real retail sales declined by 8.4% on a YoY basis. The second graph shows real retail sales (adjusted with PCE) since 1992. This is monthly retail sales, seasonally adjusted.
NOTE: The graph doesn't start at zero to better show the change.
This shows that retail sales fell off a cliff in late 2008, and may have bottomed - but at a much lower level.
Here is the Census Bureau report:
The U.S. Census Bureau announced today that advance estimates of U.S. retail and food services sales for July, adjusted for seasonal variation and holiday and trading-day differences, but not for price changes, were $342.3 billion, a decrease of 0.1 percent (±0.5%)* from the previous month and 8.3 percent (±0.7%) below July 2008. Total sales for the May through July 2009 period were down 9.0 percent (±0.5%) from the same period a year ago. The May to June 2009 percent change was revised from +0.6 percent (±0.5%) to +0.8 percent (±0.2%).Maybe the cliff diving is over, but retail sales are still at the bottom of the cliff ...
Tuesday, July 14, 2009
Retail Sales in June
by Calculated Risk on 7/14/2009 08:30:00 AM
On a monthly basis, retail sales increased 0.6% from May to June (seasonally adjusted), and sales are off 9.6% from June 2008 (retail ex food services decreased 10.3%). Excluding autos and gas, retail sales fell again in June.
The following graph shows the year-over-year change in nominal and real retail sales since 1993. Click on graph for larger image in new window.
To calculate the real change, the monthly PCE price index from the BEA was used (June PCE prices were estimated as the average increase over the previous 3 months).
The Census Bureau reported that nominal retail sales decreased 10.3% year-over-year (retail and food services decreased 9.6%), and real retail sales declined by 9.7% on a YoY basis. The second graph shows real retail sales (adjusted with PCE) since 1992. This is monthly retail sales, seasonally adjusted.
NOTE: The graph doesn't start at zero to better show the change.
This shows that retail sales fell off a cliff in late 2008, and may have bottomed - but at a much lower level.
Here is the Census Bureau report:
The U.S. Census Bureau announced today that advance estimates of U.S. retail and food services sales for June, adjusted for seasonal variation and holiday and trading-day differences, but not for price changes, were $342.1 billion, an increase of 0.6 percent (±0.5%) from the previous month, but 9.0 percent (±0.7%) below June 2008. Total sales for the April through June 2009 period were down 9.6 percent (±0.5%) from the same period a year ago. The April to May 2009 percent change was unrevised from 0.5 percent (±0.3%).Maybe the cliff diving is over, but retail sales are still at the bottom of the cliff ...
Retail trade sales were up 0.8 percent (±0.7%) from May 2009, but 10.0 percent (±0.7%) below last year. Gasoline stations sales were down 31.6 percent (±1.5%) from June 2008 and motor vehicle and parts dealers sales were down 14.1 percent (±2.5%) from last year.
Thursday, June 11, 2009
Retail Sales in May: Off 10.8% from May 2008
by Calculated Risk on 6/11/2009 08:31:00 AM
On a monthly basis, retail sales increased 0.5% from April to May (seasonally adjusted), and sales are off 10.8% from May 2008 (retail and food services decreased 9.6%). Much of the increase was due to higher gas prices.
The following graph shows the year-over-year change in nominal and real retail sales since 1993. Click on graph for larger image in new window.
To calculate the real change, the monthly PCE price index from the BEA was used (May PCE prices were estimated as the average increase over the previous 3 months).
The Census Bureau reported that nominal retail sales decreased 10.8% year-over-year (retail and food services decreased 10.1%), and real retail sales also declined by 10.8% on a YoY basis.
The second graph shows real retail sales (adjusted with PCE) since 1992. This is monthly retail sales, seasonally adjusted.
NOTE: The graph doesn't start at zero to better show the change.
This shows that retail sales fell off a cliff in late 2008, and may have bottomed at a much lower level.
Here is the Census Bureau report:
The U.S. Census Bureau announced today that advance estimates of U.S. retail and food services sales for May, adjusted for seasonal variation and holiday and trading-day differences, but not for price changes, were $340.0 billion, an increase of 0.5 percent (±0.5%)* from the previous month, but 9.6 percent (±0.7%) below May 2008. Total sales for the March through May 2009 period were down 9.7 percent (±0.5%) from the same period a year ago. The March to April 2009 percent change was revised from -0.4 percent (±0.5%)* to -0.2 percent (±0.2%)*.Maybe the cliff diving is over, but no green shoots ....
Retail trade sales were up 0.5 percent (±0.7%)* from April 2009, but 10.8 percent (±0.7%) below last year. Gasoline stations sales were down 33.8 percent (±1.5%) from May 2008 and motor vehicle and parts dealers sales were down 19.6 percent (±2.3%) from last year.
Monday, June 08, 2009
Chicago's Magnificent Mile Vacancy Rate Highest Since 1992
by Calculated Risk on 6/08/2009 12:28:00 PM
From Crain's Chicago Business: Mag Mile facing a glitz gap
The vacancy rate in the Mag Mile corridor rose to 7.2% in the year ended April 30 from 6.3% the year before, according to an annual survey by real estate brokerage CB Richard Ellis Inc. provided exclusively to Crain's.
Empty storefronts large and small dot the avenue, a big departure from seven years ago, when the rate dropped to as low as 1%. Based on historical demand and announcements by stores of possible closures next year, the vacancy rate could approach its 1992 level of 9%.
...
"In this recession, high-end merchants have been negatively impacted, and that's reflected in the vacancy numbers on the street," [Bruce Kaplan, a senior vice-president in Chicago at CB Richard Ellis] says.
Sunday, May 31, 2009
NY Times: The Fall of the Mall
by Calculated Risk on 5/31/2009 12:16:00 PM
The NY Times has a graphic of the performance of a theoretical mall: The Fall of the Mall (ht Ann, Pat). 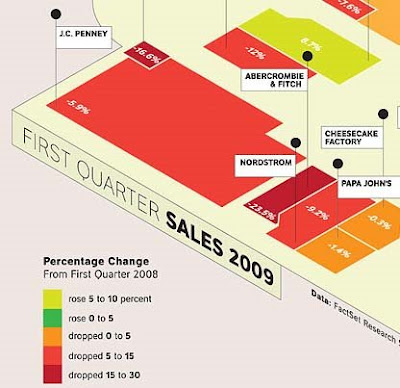 Click on graphic for complete image.
The graphic compares the performance of a number of retailers from Q1 2008 to Q1 2009.
The best performers are a dollar store, a movie theater and a pharmacy.
The worst performers are Saks, Abercrombie & Fitch, Bebe and some others.
This is a theoretical mall where all the retailers are still in business. In reality many stores are vacant, and many malls are dead or dying. See the WSJ: Recession Turns Malls Into Ghost Towns
One industry rule of thumb holds that any large, enclosed mall generating sales per square foot of $250 or less -- the U.S. average is $381 -- is in danger of failure. By that measure, [Eastland Mall in Charlotte] is one of 84 dead malls in a 1,032-mall database compiled by Green Street.
Wednesday, May 13, 2009
Retail Sales Decline in April
by Calculated Risk on 5/13/2009 02:07:00 AM
On a monthly basis, retail sales decreased 0.4% from March to April (seasonally adjusted), and sales are off 11.4% from April 2008 (retail and food services decreased 10.1%).
The following graph shows the year-over-year change in nominal and real retail sales since 1993. Click on graph for larger image in new window.
To calculate the real change, the monthly PCE price index from the BEA was used (April PCE prices were estimated as the average increase over the previous 3 months).
Although the Census Bureau reported that nominal retail sales decreased 11.4% year-over-year (retail and food services decreased 10.1%), real retail sales declined by 11.9% (on a YoY basis). The second graph shows real retail sales (adjusted with PCE) since 1992. This is monthly retail sales, seasonally adjusted.
NOTE: The graph doesn't start at zero to better show the change.
This shows that retail sales fell off a cliff in late 2008, and are still declining - but at a slower pace.
Here is the Census Bureau report:
The U.S. Census Bureau announced today that advance estimates of U.S. retail and food services sales for April, adjusted for seasonal variation and holiday and trading-day differences, but not for price changes, were $337.7 billion, a decrease of 0.4 percent (±0.5%)* from the previous month and 10.1 percent (±0.7%) below April 2008. Total sales for the February through April 2009 period were down 9.2 percent (±0.5%) from the same period a year ago. The February to March 2009 percent change was revised from -1.2 percent (±0.5%) to -1.3 percent (±0.3%).No green shoots here.
Retail trade sales were down 0.4 percent (±0.7%)* from March 2009 and 11.4 percent (±0.7%) below last year. Gasoline stations sales were down 36.4 percent (±1.5%) from April 2008 and motor vehicle and parts dealers sales were down 20.7 percent (±2.3%) from last year.


