 RSS Feed
 by Calculated Risk on 10/31/2018 07:44:00 PM
Wednesday, October 31, 2018
Thursday: Unemployment Claims, ISM Mfg, Construction Spending
Thursday:
• At All day: Light vehicle sales for October. The consensus is for 17.0 million SAAR in October, down from the BEA estimate of 17.36 million SAAR in September 2018 (Seasonally Adjusted Annual Rate).
• At 8:30 AM: The initial weekly unemployment claims report will be released. The consensus is for 212 thousand initial claims, down from 215 thousand the previous week.
• At 10:00 AM: ISM Manufacturing Index for October. The consensus is for 59.1%, down from 59.8%. The PMI was at 59.8% in September, the employment index was at 58.8%, and the new orders index was at 61.8%.
• At 10:00 AM: Construction Spending for September. The consensus is for 0.3% increase in spending
Fannie Mae: Mortgage Serious Delinquency rate Unchanged in September
by Calculated Risk on 10/31/2018 04:15:00 PM
Fannie Mae reported that the Single-Family Serious Delinquency rate was unchanged at 0.82% in September, from 0.82% in August. The serious delinquency rate is down from 1.01% in September 2017.
These are mortgage loans that are "three monthly payments or more past due or in foreclosure".
The Fannie Mae serious delinquency rate peaked in February 2010 at 5.59%.
This ties last month as the lowest serious delinquency for Fannie Mae since September 2007.
 Click on graph for larger image
By vintage, for loans made in 2004 or earlier (3% of portfolio), 2.77% are seriously delinquent. For loans made in 2005 through 2008 (5% of portfolio), 4.90% are seriously delinquent, For recent loans, originated in 2009 through 2018 (92% of portfolio), only 0.34% are seriously delinquent. So Fannie is still working through poor performing loans from the bubble years.
The increase late last year in the delinquency rate was due to the hurricanes - there were no worries about the overall market.
I expect the serious delinquency rate will probably decline to 0.5 to 0.7 percent or so to a cycle bottom.
Note: Freddie Mac reported earlier.
Zillow Case-Shiller Forecast: Slower House Price Gains in September
by Calculated Risk on 10/31/2018 01:08:00 PM
The Case-Shiller house price indexes for August were released yesterday. Zillow forecasts Case-Shiller a month early, and I like to check the Zillow forecasts since they have been pretty close.
From Skylar Olsen at Zillow: August Case-Shiller Results and September Forecast: A Slowdown in Home Prices
The Case-Shiller home price index climbed 5.8 percent in August from a year earlier, marking the first time in 12 months that home price gains have dropped below 6 percent.The Zillow forecast is for the year-over-year change for the Case-Shiller National index to be smaller in September than in August as house price growth slows.
It’s more welcome news for would-be home buyers, who must be breathing a collective sigh of relief that home price growth finally has slowed. Softening appreciation after the rapid growth of just a few months earlier is a sign that fierce competition is dying down. Potential buyers who were intimidated during the heat of the market may find the breathing space now to make a calm, considered decision about whether to lock in a mortgage before rates rise further.
Zillow forecasts an even slower 5.5 percent annual gain for September.

Chicago PMI Decreased in October
by Calculated Risk on 10/31/2018 10:30:00 AM
From the Chicago PMI: Chicago Business Barometer Declines to to 58.4 in October
The MNI Chicago Business Barometer declined to 58.4 in October, the lowest reading since April, down 2.0 points from 60.4 in September.This was below the consensus forecast of 60.0, but still a decent reading.
Business activity continued to expand at a healthy rate this month, despite the pace of activity decelerating for the third month in a row. A decline in order book growth and unfinished orders more than offset a rise in output, delivery times and employment, sending the Barometer to its lowest reading in six months. On the year, the Barometer was down 10.7%, the biggest year-over-year fall since December 2015.
...
Hiring activity intensified this month, with the Employment indicator up for the first time since July. Firms continued to report ongoing difficulties recruiting both skilled and unskilled workers, while others prioritized retention of their existing workforce.
…
“The MNI Chicago Business Barometer continued to revert back towards trend-levels in October, cooling off after a hot and unsustainable run last year,” said Jamie Satchi, Economist at MNI Indicators.
“Production continues to be restrained by issues between firms and their suppliers, reflected by Supplier Deliveries at a 14-year high, while the latest raft of tariffs on Chinese goods appears to be exacerbating uncertainty across firms,” he added.
emphasis added
ADP: Private Employment increased 227,000 in October
by Calculated Risk on 10/31/2018 08:19:00 AM
Private sector employment increased by 227,000 jobs from September to October according to the October ADP National Employment Report®. ... The report, which is derived from ADP’s actual payroll data, measures the change in total nonfarm private employment each month on a seasonally-adjusted basis.This was above the consensus forecast for 180,000 private sector jobs added in the ADP report.
...
“Despite a significant shortage in skilled talent, the labor market continues to grow,” said Ahu Yildirmaz, vice president and co-head of the ADP Research Institute.”We saw significant gains across all industries with trade and leisure and hospitality leading the way. We continue to see larger employers benefit in this environment as they are more apt to provide the competitive wages and strong benefits employees desire.”
Mark Zandi, chief economist of Moody’s Analytics, said, “The job market bounced back strongly last month despite being hit by back-to-back hurricanes. Testimonial to the robust employment picture is the broad-based gains in jobs across industries. The only blemish is the struggles small businesses are having filling open job positions.”
The BLS report for October will be released Friday, and the consensus is for 190,000 non-farm payroll jobs added in October.
MBA: Mortgage Applications Decreased in Latest Weekly Survey
by Calculated Risk on 10/31/2018 07:00:00 AM
From the MBA: Mortgage Applications Decrease in Latest MBA Weekly Survey
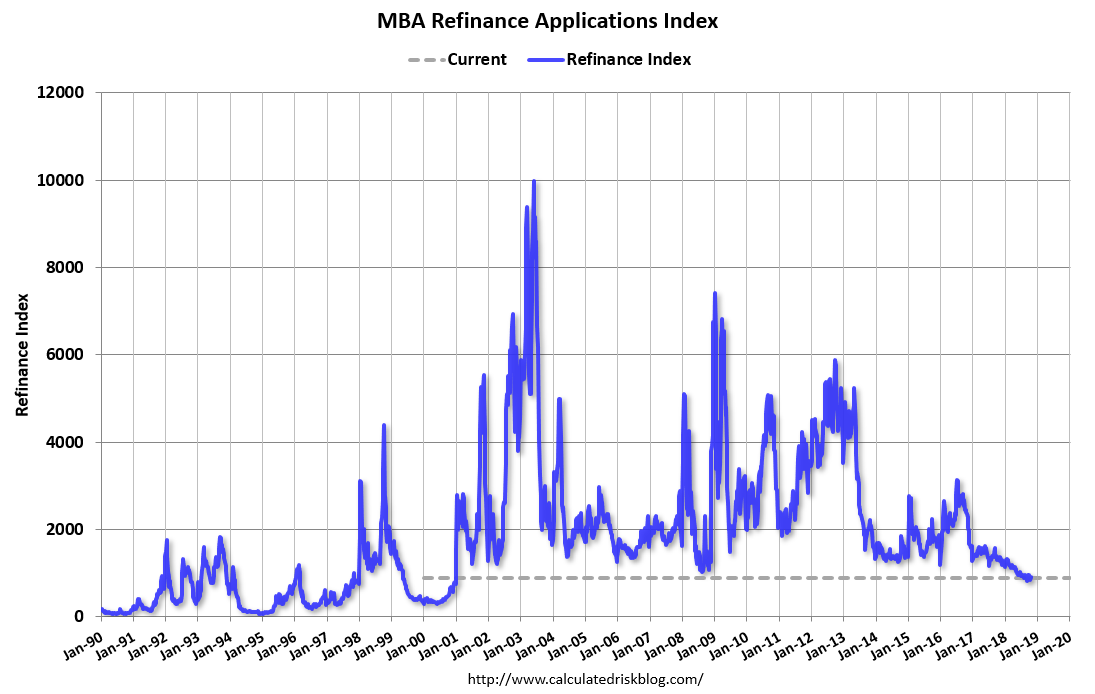
Mortgage applications decreased 2.5 percent from one week earlier, according to data from the Mortgage Bankers Association’s (MBA) Weekly Mortgage Applications Survey for the week ending October 26, 2018.
... The Refinance Index decreased 4 percent from the previous week. The seasonally adjusted Purchase Index decreased 2 percent from one week earlier. The unadjusted Purchase Index decreased 2 percent compared with the previous week and was 0.4 percent lower than the same week one year ago. ...
The average contract interest rate for 30-year fixed-rate mortgages with conforming loan balances ($453,100 or less) remained unchanged at 5.11 percent, with points decreasing to 0.50 from 0.52 (including the origination fee) for 80 percent loan-to-value ratio (LTV) loans.
emphasis added
 Click on graph for larger image.
The first graph shows the refinance index since 1990.
Refinance activity will not pick up significantly unless mortgage rates fall 50 bps or more from the recent level.
 The second graph shows the MBA mortgage purchase index
 According to the MBA, purchase activity is down 0.4% year-over-year.
Tuesday, October 30, 2018
Wednesday: ADP Employment, Chicago PMI
by Calculated Risk on 10/30/2018 07:44:00 PM
Wednesday:
• At 7:00 AM ET, The Mortgage Bankers Association (MBA) will release the results for the mortgage purchase applications index.
• At 8:15 AM, The ADP Employment Report for October. This report is for private payrolls only (no government). The consensus is for 180,000 jobs added, down from 230,000 in September.
• At 9:45 AM, Chicago Purchasing Managers Index for October. The consensus is for a reading of 60.0, down from 60.4 in September.
Real House Prices and Price-to-Rent Ratio in August
by Calculated Risk on 10/30/2018 04:35:00 PM
Here is the earlier post on Case-Shiller: Case-Shiller: National House Price Index increased 5.8% year-over-year in August
It has been over eleven years since the bubble peak. In the Case-Shiller release this morning, the seasonally adjusted National Index (SA), was reported as being 10.4% above the previous bubble peak. However, in real terms, the National index (SA) is still about 8.9% below the bubble peak (and historically there has been an upward slope to real house prices). The composite 20, in real terms, is still 12.4% below the bubble peak.
The year-over-year increase in prices is mostly moving sideways around 6%, although the YoY increase has been slowing recently - and will probably slow more as inventory picks up.
In August, the index was up 5.8% YoY.
Usually people graph nominal house prices, but it is also important to look at prices in real terms (inflation adjusted). Case-Shiller and others report nominal house prices. As an example, if a house price was $200,000 in January 2000, the price would be close to $285,000 today adjusted for inflation (42%). That is why the second graph below is important - this shows "real" prices (adjusted for inflation).
Nominal House Prices
 The first graph shows the monthly Case-Shiller National Index SA, and the monthly Case-Shiller Composite 20 SA (through August) in nominal terms as reported.
In nominal terms, the Case-Shiller National index (SA)and the Case-Shiller Composite 20 Index (SA) are both at new all times highs (above the bubble peak).
Real House Prices
 The second graph shows the same two indexes in real terms (adjusted for inflation using CPI less Shelter). Note: some people use other inflation measures to adjust for real prices.
In real terms, the National index is back to December 2004 levels, and the Composite 20 index is back to June 2004.
In real terms, house prices are at 2004 levels.
Price-to-Rent
In October 2004, Fed economist John Krainer and researcher Chishen Wei wrote a Fed letter on price to rent ratios: House Prices and Fundamental Value. Kainer and Wei presented a price-to-rent ratio using the OFHEO house price index and the Owners' Equivalent Rent (OER) from the BLS.
 Here is a similar graph using the Case-Shiller National and Composite 20 House Price Indexes.
This graph shows the price to rent ratio (January 2000 = 1.0).
On a price-to-rent basis, the Case-Shiller National index is back to February 2004 levels, and the Composite 20 index is back to November 2003 levels.
In real terms, prices are back to mid 2004 levels, and the price-to-rent ratio is back to late 2003, early 2004.
California Bay Area Home Sales Decline 20% YoY in September, Inventory up 14% YoY
by Calculated Risk on 10/30/2018 03:05:00 PM
Here are some Bay Area stats from Pacific Union chief economist Selma Hepp: Bay Area Housing Markets Got Spooked in September
• Bay Area home sales declined by 20 percent year over year in September, with all counties posting drops, led by Sonoma and Contra Costa. In 2018, the region’s housing market activity is trending 4 percent lower year to date.
• Bay Area inventory increased by 14 percent year over year in September — about 2,000 more homes — with Santa Clara County contributing more than 50 percent to the total increase.
• While appreciation has slowed from its spring peaks, Bay Area home prices are still up by 10 percent on an annual basis. San Mateo County maintained the strongest price growth at 19 percent.
• The rebalancing between buyers and sellers is driven by affordability constrains and buyer fatigue, with the biggest change seen in relatively affordable and previously fiercely competitive markets.
Update: A few comments on the Seasonal Pattern for House Prices
by Calculated Risk on 10/30/2018 12:09:00 PM
CR Note: This is a repeat of earlier posts with updated graphs.
A few key points:
1) There is a clear seasonal pattern for house prices.
2) The surge in distressed sales during the housing bust distorted the seasonal pattern.
3) Even though distressed sales are down significantly, the seasonal factor is based on several years of data - and the factor is now overstating the seasonal change (second graph below).
4) Still the seasonal index is probably a better indicator of actual price movements than the Not Seasonally Adjusted (NSA) index.
For in depth description of these issues, see former Trulia chief economist Jed Kolko's article "Let’s Improve, Not Ignore, Seasonal Adjustment of Housing Data"
Note: I was one of several people to question the change in the seasonal factor (here is a post in 2009) - and this led to S&P Case-Shiller questioning the seasonal factor too (from April 2010). I still use the seasonal factor (I think it is better than using the NSA data).
 Click on graph for larger image.
This graph shows the month-to-month change in the NSA Case-Shiller National index since 1987 (through August 2018). The seasonal pattern was smaller back in the '90s and early '00s, and increased once the bubble burst.
The seasonal swings have declined since the bubble.
 The second graph shows the seasonal factors for the Case-Shiller National index since 1987. The factors started to change near the peak of the bubble, and really increased during the bust.
The swings in the seasonal factors has started to decrease, and I expect that over the next several years - as recent history is included in the factors - the seasonal factors will move back towards more normal levels.
However, as Kolko noted, there will be a lag with the seasonal factor since it is based on several years of recent data.
HVS: Q3 2018 Homeownership and Vacancy Rates
by Calculated Risk on 10/30/2018 10:08:00 AM
The Census Bureau released the Residential Vacancies and Homeownership report for Q3 2018.
This report is frequently mentioned by analysts and the media to track household formation, the homeownership rate, and the homeowner and rental vacancy rates. However, there are serious questions about the accuracy of this survey.
This survey might show the trend, but I wouldn't rely on the absolute numbers. The Census Bureau is investigating the differences between the HVS, ACS and decennial Census, and analysts probably shouldn't use the HVS to estimate the excess vacant supply or household formation, or rely on the homeownership rate, except as a guide to the trend.
 Click on graph for larger image.
The Red dots are the decennial Census homeownership rates for April 1st 1990, 2000 and 2010. The HVS homeownership rate increased to 64.4% in Q3, from 64.3% in Q2.
I'd put more weight on the decennial Census numbers - given changing demographics, the homeownership rate has bottomed.
 The HVS homeowner vacancy increased to 1.6% in Q3.
Once again - this probably shows the general trend, but I wouldn't rely on the absolute numbers.
 The rental vacancy rate increased to 7.1% in Q3.
The quarterly HVS is the most timely survey on households, but there are many questions about the accuracy of this survey.
Overall this suggests that vacancies have declined significantly, and my guess is the homeownership rate has bottomed - and that the rental vacancy rate has bottomed for this cycle.
Case-Shiller: National House Price Index increased 5.8% year-over-year in August
by Calculated Risk on 10/30/2018 09:12:00 AM
S&P/Case-Shiller released the monthly Home Price Indices for August ("August" is a 3 month average of June, July and August prices).
This release includes prices for 20 individual cities, two composite indices (for 10 cities and 20 cities) and the monthly National index.
Note: Case-Shiller reports Not Seasonally Adjusted (NSA), I use the SA data for the graphs.
From S&P: Annual Gains Fall Below 6% for the First Time in 12 Months According to the S&P CoreLogic Case-Shiller Index
The S&P CoreLogic Case-Shiller U.S. National Home Price NSA Index, covering all nine U.S. census divisions, reported a 5.8% annual gain in August, down from 6.0% in the previous month. The 10-City Composite annual increase came in at 5.1%, down from 5.5% in the previous month. The 20-City Composite posted a 5.5% year-over-year gain, down from 5.9% in the previous month.
Las Vegas, San Francisco and Seattle reported the highest year-over-year gains among the 20 cities. In August, Las Vegas led the way with a 13.9% year-over-year price increase, followed by San Francisco with a 10.6% increase and Seattle with a 9.6% increase. Four of the 20 cities reported greater price increases in the year ending August 2018 versus the year ending July 2018.
...
Before seasonal adjustment, the National Index posted a month-over-month gain of 0.2% in August. The 10-City and 20-City Composites did not report any gains for the month. After seasonal adjustment, the National Index recorded a 0.6% month-over-month increase in August. The 10-City Composite and the 20-City Composite both posted 0.1% month-over-month increases. In August, 12 of 20 cities reported increases before seasonal adjustment, while 17 of 20 cities reported increases after seasonal adjustment.
“Following reports that home sales are flat to down, price gains are beginning to moderate,” says David M. Blitzer, Managing Director and Chairman of the Index Committee at S&P Dow Jones Indices. “Comparing prices to their levels a year earlier, 14 of the 20 cities, the National Index plus the 10-city and 20-city Composite Indices all show slower price growth. The seasonally adjusted monthly data show that 10 cities experienced declining prices. Other housing data tell a similar story: prices and sales of new single family homes are weakening, housing starts are mixed and residential fixed investment is down in the last three quarters. Rising prices may be pricing some potential home buyers out of the market, especially when combined with mortgage rates approaching 5% for 30-year fixed rate loans.
“There are no signs that the current weakness will become a repeat of the crisis, however. In 2006, when home prices peaked and then tumbled, mortgage default rates bottomed out and started a three year surge. Today, the mortgage default rates reported by the S&P/Experian Consumer Credit Default Indices are stable. Without a collapse in housing finance like the one seen 12 years ago, a crash in home prices is unlikely.”
emphasis added
 Click on graph for larger image.
 The first graph shows the nominal seasonally adjusted Composite 10, Composite 20 and National indices (the Composite 20 was started in January 2000).
The Composite 10 index is off 0.8% from the bubble peak, and up 0.1% in August (SA).
The Composite 20 index is 2.4% above the bubble peak, and up 0.1% (SA) in August.
The National index is 10.4% above the bubble peak (SA), and up 0.6% (SA) in August. The National index is up 49.3% from the post-bubble low set in December 2011 (SA).
 The second graph shows the Year over year change in all three indices.
The Composite 10 SA is up 5.1% compared to August 2017. The Composite 20 SA is up 5.5% year-over-year.
The National index SA is up 5.8% year-over-year.
Note: According to the data, prices increased in 17 of 20 cities month-over-month seasonally adjusted.
I'll have more later.
Monday, October 29, 2018
Tuesday: Case-Shiller House Prices, Q3 Housing Vacancies and Homeownership
by Calculated Risk on 10/29/2018 07:05:00 PM
From Matthew Graham at Mortgage News Daily: Mortgage Rates Stay Near Recent Lows as Busy Week Begins
Mortgage rates didn't move today, despite a fair amount of underlying market volatility. … Holding steady today means that rates remain at their lowest levels in just over 2 weeks. That sounds like a good thing, but the catch is that we really haven't moved too far from recent highs during that time, and those are the highest highs in more than 7 years. [30YR FIXED - 4.875-5.0%]Tuesday:
emphasis added
• At 9:00 AM ET, S&P/Case-Shiller House Price Index for August. The consensus is for a 6.0% year-over-year increase in the Comp 20 index for August.
• At 10:00 AM, the Q3 2018 Housing Vacancies and Homeownership from the Census Bureau.
Year-over-year Change in Real Personal Consumption Expenditures (PCE)
by Calculated Risk on 10/29/2018 04:03:00 PM
Earlier I posted a graph showing real monthly personal consumption expenditures (PCE) based on the monthly BEA report.
Here is a graph showing the year-over-year change in real PCE since 2003.
In September, the YoY change was 3.0%, about the same level as for the last few years.
 Click on graph for larger image.
There was a significant decline in real PCE during the great recession, and real PCE was fairly weak during the first few years of the recovery - partially due to the ongoing weakness in housing following the housing bubble and bust.
More recently real PCE has been increasing at a fairly steady rate around 3.0% per year.
Q3 2018 GDP Details on Residential and Commercial Real Estate
by Calculated Risk on 10/29/2018 01:00:00 PM
The BEA has released the underlying details for the Q3 advance GDP report.
The BEA reported that investment in non-residential structures decreased at a 7.9% annual pace in Q3. Investment in petroleum and natural gas exploration decreased slightly in Q3 compared to Q2, but has increased substantially recently.
Without the increase in petroleum and natural gas exploration, non-residential investment would only be up about 4% year-over-year.
 Click on graph for larger image.
The first graph shows investment in offices, malls and lodging as a percent of GDP.
Investment in offices increased in Q3, and is up 10% year-over-year.
Investment in multimerchandise shopping structures (malls) peaked in 2007 and was down about 7% year-over-year in Q3. The vacancy rate for malls is still very high, so investment will probably stay low for some time.
Lodging investment increased in Q3, and lodging investment is up 7% year-over-year.
 The second graph is for Residential investment components as a percent of GDP. According to the Bureau of Economic Analysis, RI includes new single family structures, multifamily structures, home improvement, Brokers’ commissions and other ownership transfer costs, and a few minor categories (dormitories, manufactured homes).
Home improvement was the top category for five consecutive years following the housing bust ... but now investment in single family structures has been back on top for the last six years and will probably stay there for a long time - although single family investment has been down a little recently.
However - even though investment in single family structures has increased from the bottom - single family investment is still very low, and still below the bottom for previous recessions as a percent of GDP. I expect some further increase.
Investment in single family structures was $286 billion (SAAR) (about 1.4% of GDP), and was down slightly in Q3 compared to Q2.
Investment in multi-family structures decreased in Q3.
Investment in home improvement was at a $264 billion Seasonally Adjusted Annual Rate (SAAR) in Q3 (about 1.3% of GDP). Home improvement spending has been solid.
Dallas Fed: "Texas Manufacturing Continues to Expand, but Pace Slows"
by Calculated Risk on 10/29/2018 10:36:00 AM
From the Dallas Fed: Texas Manufacturing Continues to Expand, but Pace Slows
Texas factory activity continued to expand in October, albeit at a slower pace, according to business executives responding to the Texas Manufacturing Outlook Survey. The production index, a key measure of state manufacturing conditions, was positive but declined another six points to 17.6, indicating output growth continued to abate.This was the last of the regional Fed surveys for October.
Some other indexes of manufacturing activity also suggested slower expansion in October. The capacity utilization index retreated six points to 15.4, while the shipments index fell four points to 16.6. Meanwhile, the new orders index rose—pushing up four points to 18.9—and the growth rate of orders index held steady at 11.0.
Perceptions of broader business conditions improved this month. The general business activity index inched up to 29.4, and the company outlook index climbed seven points to 25.0. Fewer than 3 percent of firms noted that their outlook worsened, the lowest share since 2004. The index measuring uncertainty regarding companies’ outlooks retreated 13 points to 6.9.
Labor market measures suggested rising employment levels and longer workweeks in October. The employment index rose six points to 23.9, a level well above average. Twenty-eight percent of firms noted net hiring, compared with 4 percent noting net layoffs. The hours worked index remained positive but moved down to 6.5.
Price increases accelerated further in October, and wage pressures remained elevated.
emphasis added
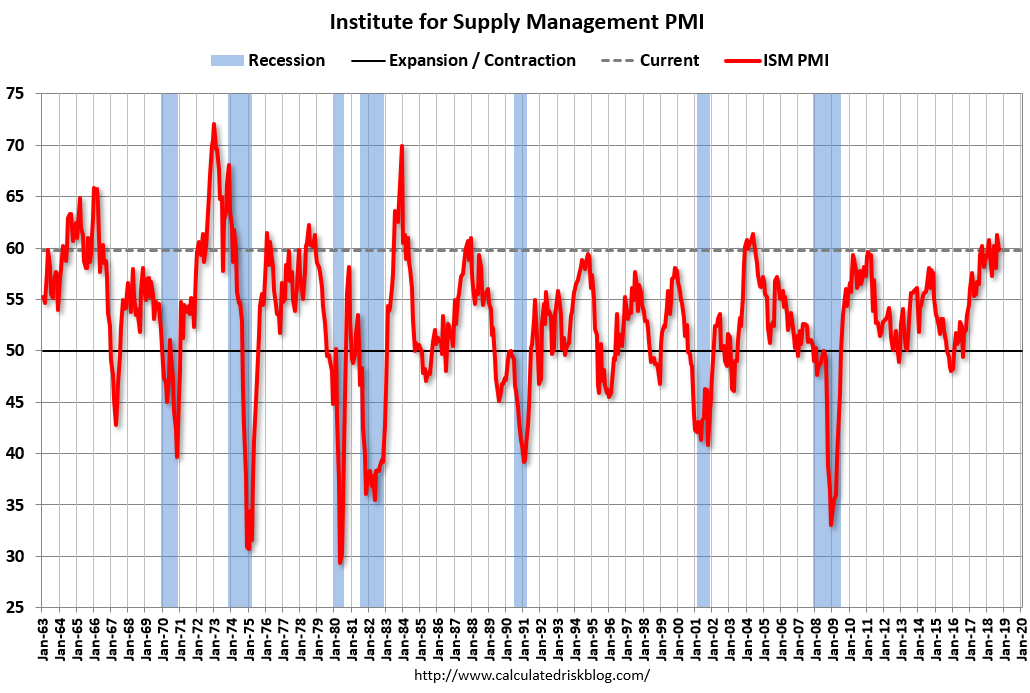
Here is a graph comparing the regional Fed surveys and the ISM manufacturing index:
 Click on graph for larger image.
The New York and Philly Fed surveys are averaged together (yellow, through October), and five Fed surveys are averaged (blue, through October) including New York, Philly, Richmond, Dallas and Kansas City. The Institute for Supply Management (ISM) PMI (red) is through September (right axis).
Based on these regional surveys, it seems likely the ISM manufacturing index will be solid in October, but below 60 again (to be released on Thursday, November 1st).
Personal Income increased 0.2% in September, Spending increased 0.4%
by Calculated Risk on 10/29/2018 08:37:00 AM
The BEA released the Personal Income and Outlays report for September:
Personal income increased $35.7 billion (0.2 percent) in September according to estimates released today by the Bureau of Economic Analysis. Disposable personal income (DPI) increased $29.1 billion (0.2 percent) and personal consumption expenditures (PCE) increased $53.0 billion (0.4 percent).The September PCE price index increased 2.0 percent year-over-year and the September PCE price index, excluding food and energy, also increased 2.0 percent year-over-year.
Real DPI increased 0.1 percent in September and Real PCE increased 0.3 percent. The PCE price index increased 0.1 percent. Excluding food and energy, the PCE price index increased 0.2 percent.
The following graph shows real Personal Consumption Expenditures (PCE) through September 2018 (2012 dollars). Note that the y-axis doesn't start at zero to better show the change.
 Click on graph for larger image.
The dashed red lines are the quarterly levels for real PCE.
The increase in personal income was below expectations, and the increase in PCE was at expectations.
PCE growth was strong in Q3, and inflation is close to the Fed's target.
Sunday, October 28, 2018
Monday: Personal Income and Outlays, Dallas Fed Mfg
by Calculated Risk on 10/28/2018 07:58:00 PM
Weekend:
• Schedule for Week of October 28, 2018
Monday:
• At 8:30 AM ET, Personal Income and Outlays for September. The consensus is for a 0.4% increase in personal income, and for a 0.4% increase in personal spending. And for the Core PCE price index to increase 0.1%.
• At 10:30 AM, Dallas Fed Survey of Manufacturing Activity for October. This is the last of the regional Fed manufacturing surveys for October.
From CNBC: Pre-Market Data and Bloomberg futures: S&P 500 are up 18 and DOW futures are up 144 (fair value).
Oil prices were down over the last week with WTI futures at $67.69 per barrel and Brent at $77.79 per barrel. A year ago, WTI was at $54, and Brent was at $61 - so oil prices are up about 25% year-over-year.
Here is a graph from Gasbuddy.com for nationwide gasoline prices. Nationally prices are at $2.81 per gallon. A year ago prices were at $2.45 per gallon, so gasoline prices are up 36 cents per gallon year-over-year.
Hotels: Occupancy Rate Increased Slightly Year-over-year
by Calculated Risk on 10/28/2018 09:32:00 AM
From HotelNewsNow.com: US hotel results for week ending 20 October
The U.S. hotel industry reported positive year-over-year results in the three key performance metrics during the week of 14-20 October 2018, according to data from STR.The following graph shows the seasonal pattern for the hotel occupancy rate using the four week average.
In comparison with the week of 15-21 October 2017, the industry recorded the following:
• Occupancy: +0.4% to 73.2%
• Average daily rate (ADR): +3.2% to US$135.67
• Revenue per available room (RevPAR): +3.6% to US$99.32
…
Houston, Texas, registered the steepest declines in each of the three key performance metrics: occupancy (-23.8% to 66.0%), ADR (-8.8% to US$107.41) and RevPAR (-30.6% to US$70.85). Houston’s hotel performance was lifted in the weeks and months that followed Hurricane Harvey in 2017 as properties filled with displaced residents, relief workers, insurance adjustors, media members, etc.
emphasis added
 Click on graph for larger image.
The red line is for 2018, dash light blue is 2017, blue is the median, and black is for 2009 (the worst year probably since the Great Depression for hotels).
This is the fourth strong year in a row for hotel occupancy. The occupancy rate, to date, is just ahead of the record year in 2017.
Seasonally, the occupancy rate will now decline through the end of the year.
Data Source: STR, Courtesy of HotelNewsNow.com
Saturday, October 27, 2018
Schedule for Week of October 28, 2018
by Calculated Risk on 10/27/2018 08:11:00 AM
The key report this week is the October employment report on Friday.
Other key indicators include the October ISM manufacturing index, October auto sales, Personal Income and Outlays for September, Case-Shiller house prices for August, and the September trade deficit.
For manufacturing, the Dallas Fed manufacturing survey will be released this week.
8:30 AM ET: Personal Income and Outlays for September. The consensus is for a 0.4% increase in personal income, and for a 0.4% increase in personal spending. And for the Core PCE price index to increase 0.1%.
10:30 AM: Dallas Fed Survey of Manufacturing Activity for October. This is the last of the regional Fed manufacturing surveys for October.
 9:00 AM ET: S&P/Case-Shiller House Price Index for August.
This graph shows the nominal seasonally adjusted National Index, Composite 10 and Composite 20 indexes through the most recent report (the Composite 20 was started in January 2000).
The consensus is for a 6.0% year-over-year increase in the Comp 20 index for August.
10:00 AM: the Q3 2018 Housing Vacancies and Homeownership from the Census Bureau.
7:00 AM ET: The Mortgage Bankers Association (MBA) will release the results for the mortgage purchase applications index.
8:15 AM: The ADP Employment Report for October. This report is for private payrolls only (no government). The consensus is for 180,000 jobs added, down from 230,000 in September.
9:45 AM: Chicago Purchasing Managers Index for October. The consensus is for a reading of 60.0, down from 60.4 in September.
 All day: Light vehicle sales for October.
The consensus is for 17.0 million SAAR in October, down from the BEA estimate of 17.36 million SAAR in September 2018 (Seasonally Adjusted Annual Rate).
This graph shows light vehicle sales since the BEA started keeping data in 1967. The dashed line is the current sales rate.
8:30 AM: The initial weekly unemployment claims report will be released. The consensus is for 212 thousand initial claims, down from 215 thousand the previous week.
 10:00 AM: ISM Manufacturing Index for October. The consensus is for 59.1%, down from 59.8%.
Here is a long term graph of the ISM manufacturing index.
The PMI was at 59.8% in September, the employment index was at 58.8%, and the new orders index was at 61.8%.
10:00 AM: Construction Spending for September. The consensus is for 0.3% increase in spending.
 8:30 AM: Employment Report for October. The consensus is for 190,000 jobs added, and for the unemployment rate to be unchanged at 3.7%.
There were 134,000 jobs added in September, and the unemployment rate was at 3.7%.
This graph shows the year-over-year change in total non-farm employment since 1968.
In September the year-over-year change was 2.537 million jobs.
A key will be the change in wages.
 8:30 AM: Trade Balance report for September from the Census Bureau.
 This graph shows the U.S. trade deficit, with and without petroleum, through the most recent report. The blue line is the total deficit, and the black line is the petroleum deficit, and the red line is the trade deficit ex-petroleum products.
The consensus is the trade deficit to be $53.4 billion. The U.S. trade deficit was at $53.2 billion in August.
Friday, October 26, 2018
October 2018: Unofficial Problem Bank list declines to 75 Institutions
by Calculated Risk on 10/26/2018 04:57:00 PM
Note: Surferdude808 compiles an unofficial list of Problem Banks compiled only from public sources.
Here is the unofficial problem bank list for October 2018.
Here are the monthly changes and a few comments from surferdude808:
Update on the Unofficial Problem Bank List for October 2018. The list had a net decline of four insured institutions to 75 banks after six removals and two additions. Aggregate assets declined during the month by $772 million to $56.2 billion. A year ago, the list held 111 institutions with assets of $26.6 billion.
Actions were terminated against First Chatham Bank, Savannah, GA ($369 million); Bank of Eastman, Eastman, GA ($170 million); Pinnacle Bank, Orange City, FL ($89 million); and American Investors Bank and Mortgage, Eden Prairie, MN ($69 million). Removals through other ways include Sage Bank, Lowell, MA ($143 million) finding a merger partner and Merchants Bank of California, National Association, Carson, CA ($3 million) exiting through a voluntary liquidation.
Additions this month were AllNations Bank, Calumet, OK ($51 million) and Sainte Marie State Bank, Sainte Marie, IL ($20 million).
Lastly, we updated the name of Illinois-Service Federal Savings and Loan Association, Chicago, IL ($133 million) to GN Bank.
Philly Fed: State Coincident Indexes increased in 39 states in September
by Calculated Risk on 10/26/2018 01:14:00 PM
From the Philly Fed:
The Federal Reserve Bank of Philadelphia has released the coincident indexes for the 50 states for September 2018. Over the past three months, the indexes increased in 44 states, decreased in five states, and remained stable in one, for a three month diffusion index of 78. In the past month, the indexes increased in 39 states, decreased in six states, and remained stable in five, for a one-month diffusion index of 66.Note: These are coincident indexes constructed from state employment data. An explanation from the Philly Fed:
emphasis added
The coincident indexes combine four state-level indicators to summarize current economic conditions in a single statistic. The four state-level variables in each coincident index are nonfarm payroll employment, average hours worked in manufacturing by production workers, the unemployment rate, and wage and salary disbursements deflated by the consumer price index (U.S. city average). The trend for each state’s index is set to the trend of its gross domestic product (GDP), so long-term growth in the state’s index matches long-term growth in its GDP.
 Click on map for larger image.
Here is a map of the three month change in the Philly Fed state coincident indicators. This map was all red during the worst of the recession, and all or mostly green during most of the recent expansion.
The map is mostly green on a three month basis, but there are some red states.
Source: Philly Fed.
Note: For complaints about red / green issues, please contact the Philly Fed.
 And here is a graph is of the number of states with one month increasing activity according to the Philly Fed. This graph includes states with minor increases (the Philly Fed lists as unchanged).
In September, 40 states had increasing activity (including minor increases).
This is the fewest states with increasing activity in almost 9 years.
Q3 GDP: Investment
by Calculated Risk on 10/26/2018 10:21:00 AM
The first graph below shows the contribution to GDP from residential investment, equipment and software, and nonresidential structures (3 quarter trailing average). This is important to follow because residential investment tends to lead the economy, equipment and software is generally coincident, and nonresidential structure investment trails the economy.
In the graph, red is residential, green is equipment and software, and blue is investment in non-residential structures. So the usual pattern - both into and out of recessions is - red, green, blue.
The dashed gray line is the contribution from the change in private inventories.
 Click on graph for larger image.
Residential investment (RI) decreased in Q3 (-4.0% annual rate in Q3). Equipment investment increased slightly at a 0.4% annual rate, and investment in non-residential structures decreased at a 7.9% annual rate.
On a 3 quarter trailing average basis, RI (red) is down slightly, equipment (green) is positive, and nonresidential structures (blue) is also up.
Recently RI has been soft, but the decrease is fairly small.
I'll post more on the components of non-residential investment once the supplemental data is released.
 The second graph shows residential investment as a percent of GDP.
Residential Investment as a percent of GDP decreased in Q3, however RI has generally been increasing. RI as a percent of GDP is only just above the bottom of the previous recessions - and I expect RI to continue to increase further in this cycle.
The increase is now primarily coming from single family investment and home remodeling.
I'll break down Residential Investment into components after the GDP details are released.
Note: Residential investment (RI) includes new single family structures, multifamily structures, home improvement, broker's commissions, and a few minor categories.
 The third graph shows non-residential investment in structures, equipment and "intellectual property products". Investment in equipment and non-residential structures - as a percent of GDP - declined.
BEA: Real GDP increased at 3.5% Annualized Rate in Q3
by Calculated Risk on 10/26/2018 08:36:00 AM
From the BEA: Gross Domestic Product: Third Quarter 2018 (Advance Estimate)
Real gross domestic product (GDP) increased at an annual rate of 3.5 percent in the third quarter of 2018, according to the "advance" estimate released by the Bureau of Economic Analysis. In the second quarter, real GDP increased 4.2 percent.The advance Q3 GDP report, with 3.5% annualized growth, was close to expectations.
The Bureau emphasized that the third-quarter advance estimate released today is based on source data that are incomplete or subject to further revision by the source agency (see “Source Data for the Advance Estimate” on page 2). The "second" estimate for the third quarter, based on more complete data, will be released on November 28, 2018.
...
The increase in real GDP in the third quarter reflected positive contributions from personal consumption expenditures (PCE), private inventory investment, state and local government spending, federal government spending, and nonresidential fixed investment that were partly offset by negative contributions from exports and residential fixed investment. Imports, which are a subtraction in the calculation of GDP, increased.
The deceleration in real GDP growth in the third quarter reflected a downturn in exports and a deceleration in nonresidential fixed investment. Imports increased in the third quarter after decreasing in the second. These movements were partly offset by an upturn in private inventory investment.
emphasis added
Note the Change in Private Inventories contributed 2.07 percentage points to GDP growth in Q3, and this will probably unwind in Q4.
Personal consumption expenditures (PCE) increased at 4.0% annualized rate in Q3, up from 3.8% in Q2. Residential investment (RI) decreased 4.0% in Q3. Equipment investment increased at a 0.4% annualized rate, and investment in non-residential structures decreased at a 7.9% pace.
I'll have more later ...
Thursday, October 25, 2018
Freddie Mac: Mortgage Serious Delinquency Rate Unchanged in September
by Calculated Risk on 10/25/2018 07:46:00 PM
Friday:
• At 8:30 AM ET, Gross Domestic Product, 3nd quarter 2018 (Advance estimate). The consensus is that real GDP increased 3.3% annualized in Q3, down from 4.2% in Q2.
• At 10:00 AM, University of Michigan's Consumer sentiment index (Final for October). The consensus is for a reading of 99.0.
Freddie Mac reported that the Single-Family serious delinquency rate in September was 0.73%, unchanged from 0.73% in August. Freddie's rate is down from 0.86% in September 2017.
Freddie's serious delinquency rate peaked in February 2010 at 4.20%.
This ties the lowest serious delinquency rate for Freddie Mac since January 2008.
These are mortgage loans that are "three monthly payments or more past due or in foreclosure".
 Click on graph for larger image
The increase in the delinquency rate late last year was due to the hurricanes (These are serious delinquencies, so it took three months late to be counted). We will probably see another, smaller, bump following hurricanes Florence and Michael.
I expect the delinquency rate to decline to a cycle bottom in the 0.5% to 0.7% range - but this is close to a bottom.
Note: Fannie Mae will report for September soon.
Brad Hunter on Homebuilding
by Calculated Risk on 10/25/2018 04:21:00 PM
CR Note: I've asked Brad Hunter for his thoughts on housing.
Hunter has been in the economic forecasting business for 32 years, and has made a name for himself tracking and forecasting the homebuilding business. He led a nationwide team of consultants in advising home builders (and their financiers) during his long tenure at Metrostudy.
He made several key calls of important turns (he warned his builder and financial clients of the dangers of overpaying for land in 2004/05, and he advised institutional investors to speculate heavily on land in 2009-2012). Here he lays out some of the key factors he sees driving the homebuilding business today. You can follow him at @bradleyhunter.
Home sales are reacting negatively to higher mortgage rates much the same way they did during the "Taper Tantrum" of 2013, when bond markets got the jitters and home sales dropped sharply as a result. Monthly-payment concern is about to become more of an issue for home sales.
A key question is how the home building companies will adjust to a rising-rate environment.
Homebuilders: "Lots" to Talk About
One of the main headwinds for homebuilding has been the supply (and therefore the price) of developed lots in locations where the builders want to build. The pace of lot development has not kept up with the need, particularly for builders who would like to build in a price range that middle-class people can afford.
Homebuilders are reporting fairly high levels of confidence these days, but they do say that lot prices are a major issue for them, as are material and labor costs. Most of these higher costs have been passed on to home buyers. At least so far. Lot costs have had the biggest negative effect on production of homes priced under $300,000, where there is the largest amount of under-served demand.
I discuss this, along with the threat to affordability and home sales posed by tariffs, in my latest interview on Bloomberg Radio: Tariffs Are Big Concern For Homebuilders As Costs Rise (Radio)
My forecast of single-family home sales for the entire year 2018 is 613,000, virtually unchanged versus 2017, reflecting the rapid rate at which builders boosted prices this year. I am forecasting only a modest increase in single-family home sales and housing starts in 2019, reflecting increased affordability problems.
Builders will have to consider land parcels that are farther from the traditional urban cores in order to continue to produce homes that large numbers of households can afford.
The household formation numbers are once again strong. The demand is there. The builders who figure out how to capture that demand are the ones that will come out on top.
Home Price Appreciation: Tapping the Brakes
New data from the S&P CoreLogic Case-Shiller Index of home prices shows that the pace of home price increase is still elevated, but is finally starting to slow, as expected. Appreciation is in the 6% range, according to this measure of home prices, still much higher than the rate of income growth.
Las Vegas, Seattle and San Francisco currently lead the pack, all with double-digit rates of home appreciation.
We are seeing the beginning of a larger slowdown in appreciation. Home prices and monthly payments cannot continue to outrun buyers’ incomes for much longer.
I hasten to clarify that what I see coming is a slower rate of increase; not a nationwide decline in home prices. While a few markets may see some price declines in the months ahead, the overwhelming majority will continue to appreciate, just at a much slower pace.
My prediction going forward is that income ratios and rising interest rates will drive a leveling off of home prices, particularly in the most expensive markets in the country. My forecast is for home price appreciation of existing homes to slow to 4% in 2019, and I believe it could fall to the 2% range shortly after, on average.
Apartment Construction Pace is Finally Easing (a Good Thing)
Apartment construction boomed during the past seven years, and it is slowing now, so as not to get into an overbuilt situation. The apartment market is much more cyclical than single-family housing, more prone to getting ahead of demand. The slowdown in apartment construction is a helpful shift, in that it will reduce the likelihood or impact of a downturn.
Chemical Activity Barometer "Begins to Cool" in October
by Calculated Risk on 10/25/2018 01:48:00 PM
Note: This appears to be a leading indicator for industrial production.
From the American Chemistry Council: Chemical Activity Barometer Begins To Cool At Start of 4th Quarter; Year-Over-Year Growth Continues To Ease
he Chemical Activity Barometer (CAB), a leading economic indicator created by the American Chemistry Council (ACC), posted a 0.2 percent gain in October on a three-month moving average (3MMA) basis. The barometer is up 3.8 percent (3MMA) year-over-year. The pace of growth has slowed form earlier in the year. The unadjusted measure of the CAB declined 0.2 percent in October.
...
Applying the CAB back to 1912, it has been shown to provide a lead of two to fourteen months, with an average lead of eight months at cycle peaks as determined by the National Bureau of Economic Research. The median lead was also eight months. At business cycle troughs, the CAB leads by one to seven months, with an average lead of four months. The median lead was three months. The CAB is rebased to the average lead (in months) of an average 100 in the base year (the year 2012 was used) of a reference time series. The latter is the Federal Reserve’s Industrial Production Index.
emphasis added
 Click on graph for larger image.
This graph shows the year-over-year change in the 3-month moving average for the Chemical Activity Barometer compared to Industrial Production. It does appear that CAB (red) generally leads Industrial Production (blue).
The year-over-year increase in the CAB has softened recently, suggesting further gains in industrial production in 2018 and early 2019, but at a slower pace.
Kansas City Fed: Regional Manufacturing Activity "Expanded at a Slower Pace" in October
by Calculated Risk on 10/25/2018 11:00:00 AM
From the Kansas City Fed: Tenth District Manufacturing Activity Expanded at a Slightly Slower Pace
The Federal Reserve Bank of Kansas City released the October Manufacturing Survey today. According to Chad Wilkerson, vice president and economist at the Federal Reserve Bank of Kansas City, the survey revealed that Tenth District manufacturing activity continued to expand, but at a slower pace. Expectations for future activity eased slightly, but remained positive.This is the lowest level for this index since 2016. The regional surveys for October have mostly indicated slower growth in October as compared to September, and these surveys suggest the ISM index will still be solid, but could be close to the lowest level this year.
“While regional factories reported another month of growth, a number of firms engaged in international trade noted negative effects of tariffs on supply chains,” said Wilkerson.
...
The month-over-month composite index was 8 in October, down from 13 in September and 14 in August. The composite index is an average of the production, new orders, employment, supplier delivery time, and raw materials inventory indexes. The decline in factory growth was driven by slower expansion at durable goods plants, especially for machinery, computer and electronic products, and transportation equipment, while activity at nondurable goods plants increased. Month-over-month indexes were mixed in September, but positive overall. The production and new orders indexes declined slightly, while the order backlog and new orders for exports indexes inched up. The shipments and employment indexes both increased. The materials inventory index declined and the finished goods inventory index was unchanged from last month’s reading.
emphasis added
NAR: Pending Home Sales Index Increased 0.5% in September
by Calculated Risk on 10/25/2018 10:04:00 AM
From the NAR: Pending Home Sales See 0.5 Percent Increase in September
Pending home sales rose slightly in September and saw substantial increases in both the West and Midwest, according to the National Association of Realtors.This was above expectations for this index. Note: Contract signings usually lead sales by about 45 to 60 days, so this would usually be for closed sales in October and November.
The Pending Home Sales Index, a forward-looking indicator based on contract signings, increased 0.5 percent to 104.6 in September from 104.1 in August. However, year-over-year, contract signings dropped 1.0 percent make this the ninth straight month of annual decreases.
...
The PHSI in the Northeast dropped 0.4 percent to 92.3 in September, and is now 2.7 percent below a year ago. In the Midwest, the index rose 1.2 percent to 102.4 in September and is 1.1 percent lower than September 2017.
Pending home sales in the South fell 1.4 percent to an index of 119.6 in September; however, that is 3.3 percent higher than a year ago. The index in the West increased 4.5 percent in September to 93.1 and plunged 7.4 percent below a year ago.
emphasis added
Weekly Initial Unemployment Claims increased to 215,000
by Calculated Risk on 10/25/2018 08:34:00 AM
The DOL reported:
In the week ending October 20, the advance figure for seasonally adjusted initial claims was 215,000, an increase of 5,000 from the previous week's unrevised level of 210,000. The 4-week moving average was 211,750, unchanged from the previous week's unrevised average of 211,750.The previous week was unrevised.
emphasis added
The following graph shows the 4-week moving average of weekly claims since 1971.
 Click on graph for larger image.
The dashed line on the graph is the current 4-week average. The four-week average of weekly unemployment claims was unchanged at 211,750.
This was slightly higher than the consensus forecast. The low level of claims suggest few layoffs.
Wednesday, October 24, 2018
Thursday: Unemployment Claims, Durable Goods, Pending Home Sales, KC Fed Mfg Survey
by Calculated Risk on 10/24/2018 08:45:00 PM
Thursday:
• At 8:30 AM ET, The initial weekly unemployment claims report will be released. The consensus is for 212 thousand initial claims, up from 210 thousand the previous week.
• Also at 8:30 AM, Durable Goods Orders for September from the Census Bureau. The consensus is for a 1.4% decrease in durable goods orders.
• At 10:00 AM, Pending Home Sales Index for September. The consensus is for no change in the index.
• At 11:00 AM, the Kansas City Fed manufacturing survey for October.
Housing and Recessions
by Calculated Risk on 10/24/2018 04:47:00 PM
Following the weak new home sales report, I'd like to update a couple of graphs.
For the economy, what we should be focused on are single family starts and new home sales. As I noted in Investment and Recessions "New Home Sales appears to be an excellent leading indicator, and currently new home sales (and housing starts) are up solidly year-over-year, and this suggests there is no recession in sight."
Since I wrote that post, new home sales and housing starts have weakened.
For the bottoms and troughs for key housing activity, here is a graph of Single family housing starts, New Home Sales, and Residential Investment (RI) as a percent of GDP.
 Click on graph for larger image.
The arrows point to some of the earlier peaks and troughs for these three measures.
The purpose of this graph is to show that these three indicators generally reach peaks and troughs together. Note that Residential Investment is quarterly and single-family starts and new home sales are monthly.
RI as a percent of GDP has been sluggish recently, mostly due to softness in multi-family residential. And it is too early to say that single family housing starts and new home sales have turned down.
Also, look at the relatively low level of RI as a percent of GDP, new home sales and single family starts compared to previous peaks. To have a significant downturn from these levels would be surprising.
 The second graph shows the YoY change in New Home Sales from the Census Bureau.
Note: the New Home Sales data is smoothed using a three month centered average before calculating the YoY change. The Census Bureau data starts in 1963.
Some observations:
1) When the YoY change in New Home Sales falls about 20%, usually a recession will follow. The one exception for this data series was the mid '60s when the Vietnam buildup kept the economy out of recession. Note that the sharp decline in 2010 was related to the housing tax credit policy in 2009 - and was just a continuation of the housing bust.
2) It is also interesting to look at the '86/'87 and the mid '90s periods. New Home sales fell in both of these periods, although not quite 20%. As I noted in earlier posts, the mid '80s saw a surge in defense spending and MEW that more than offset the decline in New Home sales. In the mid '90s, nonresidential investment remained strong.
Although new home sales were down sharply in September, the decline isn't that large historically (at least not yet).
Fed's Beige Book: Economic Growth "modest to moderate", Some Housing Weakness
by Calculated Risk on 10/24/2018 02:05:00 PM
Fed's Beige Book "This report was prepared at the Federal Reserve Bank of Richmond based on information collected on or before October 15, 2018. "
Economic activity expanded across the United States, with the majority of Federal Reserve Districts reporting modest to moderate growth. New York and St. Louis indicated slight growth, overall, while Dallas reported robust growth driven by strong manufacturing, retail, and nonfinancial services activity. On balance, manufacturers reported moderate output growth; however, several Districts indicated that firms faced rising materials and shipping costs, uncertainties over the trade environment, and/or difficulties finding qualified workers. Demand for transportation services remained strong. Labor shortages were broadly noted and were linked to wage increases and/or constrained growth. Reports on commercial and residential real estate were mixed, although several Districts saw rising home prices and low levels of inventory.And some signs of weaker housing market, as an example:
Single-family home sales were steady to down modestly in the suburbs around New York, including northern New Jersey. One contact ascribed some of this weakness to changes in federal tax law that limit deductibility of homeowner costs.
The inventory of homes on the market has risen throughout most of the District--particularly for smaller units in New York City. Still, current inventory levels remain quite low, particularly in upstate New York. Home price trends have been mixed, with values continuing to rise in upstate New York, Long Island, and northern New Jersey, but holding steady across New York City and its northern suburbs. Prices of new condos in New York City, as well as prices at the high end of the condo market more generally, have weakened noticeably.
emphasis added
A few Comments on September New Home Sales
by Calculated Risk on 10/24/2018 12:35:00 PM
New home sales for September were reported at 533,000 on a seasonally adjusted annual rate basis (SAAR). This was well below the consensus forecast, and the three previous months were revised down significantly. A very weak report.
Sales in September were down 13.2% year-over-year compared to September 2017. This was a large YoY decline, although some of the decline might be related to the impact of the hurricanes. However the largest declines were in the North East and the West, and those declines were not hurricane related.
It is not time to panic - or start looking for a recession - but this was a very weak report.
On Inventory: Months of inventory is now above the top of the normal range, however the number of units completed and under construction is still somewhat low. Inventory will be something to watch very closely.
Earlier: New Home Sales decrease sharply to 553,000 Annual Rate in September.
 Click on graph for larger image.
This graph shows new home sales for 2017 and 2018 by month (Seasonally Adjusted Annual Rate).
New home sales had been up year-over-year every month this year prior to this report. Not only were sales down YoY in September, but with revisions, sales were down slightly YoY in June too.
Sales are only up 3.5% through September compared to the same period in 2017.
This is below my forecast for 2018 for an increase of about 6% over 2017. As I noted early this year, there were downside risks to that forecast, primarily higher mortgage rates, but also higher costs (labor and material), the impact of the new tax law, and other possible policy errors. Also new home sales had a strong Q4 2017, so the comparisons will be more difficult - and sales might even be down for the year.
And here is another update to the "distressing gap" graph that I first started posting a number of years ago to show the emerging gap caused by distressed sales. Now I'm looking for the gap to close over the next several years.
 The "distressing gap" graph shows existing home sales (left axis) and new home sales (right axis) through September 2018. This graph starts in 1994, but the relationship had been fairly steady back to the '60s.
Following the housing bubble and bust, the "distressing gap" appeared mostly because of distressed sales. The gap has persisted even though distressed sales are down significantly, since new home builders focused on more expensive homes.
I still expect this gap to slowly close. However, this assumes that the builders will offer some smaller, less expensive homes. If not, then the gap will persist.
Note: Existing home sales are counted when transactions are closed, and new home sales are counted when contracts are signed. So the timing of sales is different.
AIA: "Architecture firm billings slow but remain positive in September"
by Calculated Risk on 10/24/2018 11:46:00 AM
Note: This index is a leading indicator primarily for new Commercial Real Estate (CRE) investment.
From the AIA: Architecture firm billings slow but remain positive in September
Architecture firm billings growth slowed in September but remained positive for the twelfth consecutive month, according to a new report today from The American Institute of Architects (AIA).
AIA’s Architecture Billings Index (ABI) score for September was 51.1 compared to 54.2 in August. However, continued strength in new projects coming into architecture firms points to billings growth in the coming months.
“Similar to the strong conditions we’ve seen nationally, architecture firms located in the Midwest and Southern regions of the country continued to report very strong billings in September,” said AIA Chief Economist Kermit Baker, Hon. AIA, PhD. “However, billings were soft at firms located in the Northeast again, where they have declined or been flat for the entire year so far.”
...
• Regional averages: Midwest (59.7), South (54.1), West (53.1), Northeast (46.6)
• Sector index breakdown: institutional (55.1), multi-family residential (54.9), mixed practice (53.4), commercial/industrial (50.8)
emphasis added
 Click on graph for larger image.
This graph shows the Architecture Billings Index since 1996. The index was at 51.1 in September, down from 54.2 in August. Anything above 50 indicates expansion in demand for architects' services.
Note: This includes commercial and industrial facilities like hotels and office buildings, multi-family residential, as well as schools, hospitals and other institutions.
According to the AIA, there is an "approximate nine to twelve month lag time between architecture billings and construction spending" on non-residential construction. This index has been positive for 12 consecutive months, suggesting a further increase in CRE investment into 2019.
New Home Sales decrease sharply to 553,000 Annual Rate in September
by Calculated Risk on 10/24/2018 10:15:00 AM
The Census Bureau reports New Home Sales in September were at a seasonally adjusted annual rate (SAAR) of 553 thousand.
The previous three months were revised down significantly.
"Sales of new single‐family houses in September 2018 were at a seasonally adjusted annual rate of 553,000, according to estimates released jointly today by the U.S. Census Bureau and the Department of Housing and Urban Development. This is 5.5 percent below the revised August rate of 585,000 and is 13.2 percent below the September 2017 estimate of 637,000."
emphasis added
 Click on graph for larger image.
The first graph shows New Home Sales vs. recessions since 1963. The dashed line is the current sales rate.
Even with the increase in sales over the last several years, new home sales are still somewhat low historically.
The second graph shows New Home Months of Supply.
 The months of supply decreased in September to 7.1 months from 6.5 months in August.
 The all time record was 12.1 months of supply in January 2009.
This is above the normal range (less than 6 months supply is normal).
"The seasonally‐adjusted estimate of new houses for sale at the end of September was 327,000. This represents a supply of 7.1 months at the current sales rate."
 On inventory, according to the Census Bureau:
 "A house is considered for sale when a permit to build has been issued in permit-issuing places or work has begun on the footings or foundation in nonpermit areas and a sales contract has not been signed nor a deposit accepted."Starting in 1973 the Census Bureau broke this down into three categories: Not Started, Under Construction, and Completed.
The third graph shows the three categories of inventory starting in 1973.
The inventory of completed homes for sale is still somewhat low, and the combined total of completed and under construction is also somewhat low.
 The last graph shows sales NSA (monthly sales, not seasonally adjusted annual rate).
In September 2018 (red column), 41 thousand new homes were sold (NSA). Last year, 50 thousand homes were sold in September.
The all time high for September was 99 thousand in 2005, and the all time low for September was 24 thousand in 2011.
This was well below expectations of 625,000 sales SAAR, and the previous months were revised down significantly. I'll have more later today.
Black Knight: National Mortgage Delinquency Rate Increased in September
by Calculated Risk on 10/24/2018 08:31:00 AM
From Black Knight: Black Knight’s First Look: Seasonal, Calendar and Hurricane-Related Pressures Result in Largest Single-Month Mortgage Delinquency Increase in Nearly a Decade
• Mortgage delinquencies rose more than 13 percent in September, the largest single-month rise since November 2008According to Black Knight's First Look report for September, the percent of loans delinquent increased 13.2% in September compared to August, but decreased 9.8% year-over-year.
• 16 of the last 19 Septembers have seen delinquencies increase, averaging a 5.2 percent rise over that time frame, the largest of any month during the calendar year
• September 2018 also ended on a Sunday, which typically creates strong upward pressure on delinquencies
• Hurricane Florence-related delinquencies spiked 38 percent month-over-month, with more than 6,000 borrowers already missing a payment as a direct result of the storm
• Foreclosure starts posted a double-digit monthly decline, hitting a nearly 18-year low at just 40,000 for the month
• Both the inventory of loans in active foreclosure and the foreclosure rate have now fallen below their pre-recession averages for the first time since the financial crisis
The percent of loans in the foreclosure process decreased 4.5% in September and were down 26.0% over the last year.
Black Knight reported the U.S. mortgage delinquency rate (loans 30 or more days past due, but not in foreclosure) was 3.97% in September, up from 3.52% in August.
The percent of loans in the foreclosure process decreased in September to 0.52% from 0.54% in August.
The number of delinquent properties, but not in foreclosure, is down 196,000 properties year-over-year, and the number of properties in the foreclosure process is down 90,000 properties year-over-year.
| Black Knight: Percent Loans Delinquent and in Foreclosure Process | ||||
|---|---|---|---|---|
| Sept 2018 | Aug 2018 | Sept 2017 | Sept 2016 | |
| Delinquent | 3.97% | 3.52% | 4.40% | 4.27% |
| In Foreclosure | 0.52% | 0.54% | 0.70% | 1.00% |
| Number of properties: | ||||
| Number of properties that are delinquent, but not in foreclosure: | 2,049,000 | 1,818,000 | 2,245,000 | 2,165,000 |
| Number of properties in foreclosure pre-sale inventory: | 268,000 | 280,000 | 358,000 | 509,000 |
| Total Properties | 2,317,000 | 2,099,000 | 2,603,000 | 2,674,000 |


