 RSS Feed
 by Calculated Risk on 10/27/2018 08:11:00 AM
Saturday, October 27, 2018
Schedule for Week of October 28, 2018
The key report this week is the October employment report on Friday.
Other key indicators include the October ISM manufacturing index, October auto sales, Personal Income and Outlays for September, Case-Shiller house prices for August, and the September trade deficit.
For manufacturing, the Dallas Fed manufacturing survey will be released this week.
8:30 AM ET: Personal Income and Outlays for September. The consensus is for a 0.4% increase in personal income, and for a 0.4% increase in personal spending. And for the Core PCE price index to increase 0.1%.
10:30 AM: Dallas Fed Survey of Manufacturing Activity for October. This is the last of the regional Fed manufacturing surveys for October.
 9:00 AM ET: S&P/Case-Shiller House Price Index for August.
This graph shows the nominal seasonally adjusted National Index, Composite 10 and Composite 20 indexes through the most recent report (the Composite 20 was started in January 2000).
The consensus is for a 6.0% year-over-year increase in the Comp 20 index for August.
10:00 AM: the Q3 2018 Housing Vacancies and Homeownership from the Census Bureau.
7:00 AM ET: The Mortgage Bankers Association (MBA) will release the results for the mortgage purchase applications index.
8:15 AM: The ADP Employment Report for October. This report is for private payrolls only (no government). The consensus is for 180,000 jobs added, down from 230,000 in September.
9:45 AM: Chicago Purchasing Managers Index for October. The consensus is for a reading of 60.0, down from 60.4 in September.
 All day: Light vehicle sales for October.
The consensus is for 17.0 million SAAR in October, down from the BEA estimate of 17.36 million SAAR in September 2018 (Seasonally Adjusted Annual Rate).
This graph shows light vehicle sales since the BEA started keeping data in 1967. The dashed line is the current sales rate.
8:30 AM: The initial weekly unemployment claims report will be released. The consensus is for 212 thousand initial claims, down from 215 thousand the previous week.
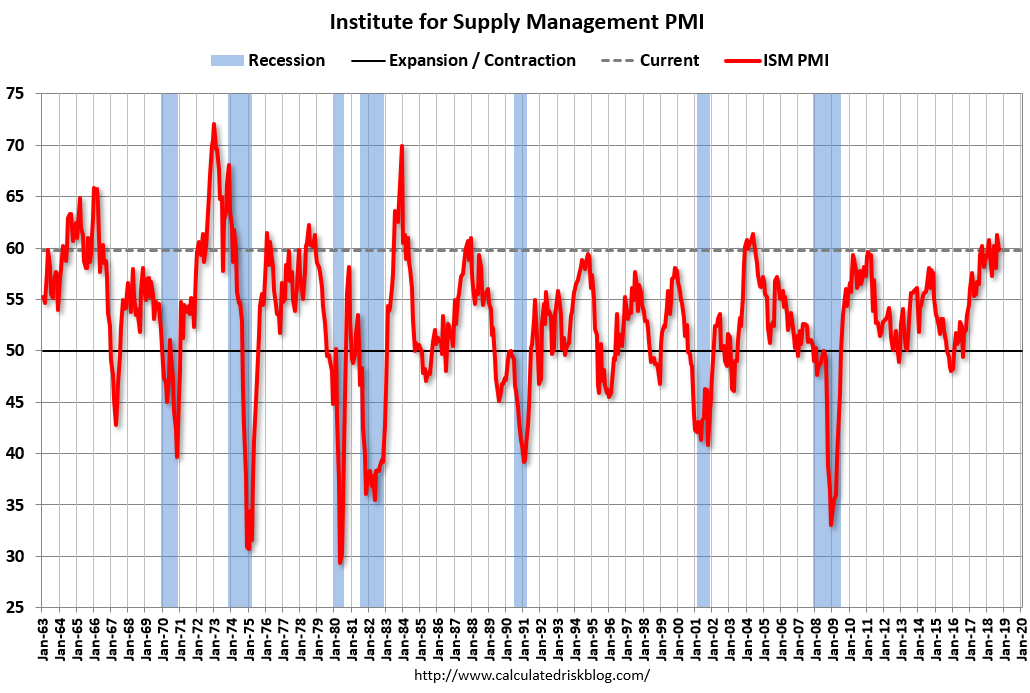 10:00 AM: ISM Manufacturing Index for October. The consensus is for 59.1%, down from 59.8%.
Here is a long term graph of the ISM manufacturing index.
The PMI was at 59.8% in September, the employment index was at 58.8%, and the new orders index was at 61.8%.
10:00 AM: Construction Spending for September. The consensus is for 0.3% increase in spending.
 8:30 AM: Employment Report for October. The consensus is for 190,000 jobs added, and for the unemployment rate to be unchanged at 3.7%.
There were 134,000 jobs added in September, and the unemployment rate was at 3.7%.
This graph shows the year-over-year change in total non-farm employment since 1968.
In September the year-over-year change was 2.537 million jobs.
A key will be the change in wages.
 8:30 AM: Trade Balance report for September from the Census Bureau.
 This graph shows the U.S. trade deficit, with and without petroleum, through the most recent report. The blue line is the total deficit, and the black line is the petroleum deficit, and the red line is the trade deficit ex-petroleum products.
The consensus is the trade deficit to be $53.4 billion. The U.S. trade deficit was at $53.2 billion in August.


