 RSS Feed
 by Calculated Risk on 5/31/2009 11:34:00 PM
Sunday, May 31, 2009
Jim the Realtor: Check out this Backyard!
Another video from Jim ... words can't describe this backyard and other, uh, "features" ... although I think the "long jump" pit is for horseshoes.
GM to file Bankruptcy Monday Morning
by Calculated Risk on 5/31/2009 06:47:00 PM
From the Detroit News: GM bankruptcy filing expected 6 a.m. Monday (ht jb)
The Obama administration will name a veteran turnaround expert as chief restructuring officer for General Motors Corp., which plans to file for bankruptcy protection about 6 a.m. Monday in New York ... Al Koch, a managing director at AlixPartners LLP, will be named chief restructuring officer Monday, a government official familiar with the matter said, and will help to wind down GM's "bad" assets that it plans to leave behind in bankruptcy.The WSJ says 8 AM.
Alt-A Foreclosures in Sonoma
by Calculated Risk on 5/31/2009 03:30:00 PM
The Press Democrat: Alt-A loans: Second wave of foreclosures ahead (ht Atrios) reports that there are 18,000 Alt-A mortgages in Sonoma County (about 18 percent of all mortgages). This is a larger percentage of mortgages in Somona County than for subprime - which accounted for about 10 percent of all mortgages in the county at the peak.
According to the story - using First American CoreLogic as a source - about two-thirds of these Alt-A loans will see a significant payment increase over the next few years, with recasts peaking in 2011.
First, I strongly recommend everyone read Tanta's Reflections on Alt-A
Alt-A is sort of a weird mirror-image of subprime lending. If subprime was traditionally about borrowers with good capacity and collateral but bad credit history, Alt-A was about borrowers with a good credit history but pretty iffy capacity and collateral. That is to say, while subprime makes some amount of sense, Alt-A never made any sense. It is a child of the bubble.There is much more ...
...
Alt-A ... overwhelmingly involved the kind of "affordability product" like ARMs and interest only and negative amortization and 40-year or 50-year terms that "ramps" payment streams. But it doesn't do this in order to help anyone "catch up" on arrearages; people with good credit don't have any arrearages. Alt-A was and has always been about maximizing consumption, whether of housing or of all the other consumer goods you can spend "MEW" on. If subprime was supposed to be about taking a bad-credit borrower and working him back into a good-credit borrower, Alt-A was about taking a good-credit borrower and loading him up with enough debt to make him eventually subprime.
Second, most of those Alt-A loans were in mid-to-high priced areas. So the foreclosure crisis will now be moving up the value chain. But unlike the low priced areas where there are more potential first time buyers and cash flow investors waiting for prices to fall, demand in mid-priced areas usually comes from move up and move across buyers. Since a majority of the sellers in low priced areas are lenders (DataQuick reported 57.1 percent of sales in Sonoma in March were foreclosure resales), there will be few buyers for these Alt-A foreclosures.
NY Times: The Fall of the Mall
by Calculated Risk on 5/31/2009 12:16:00 PM
The NY Times has a graphic of the performance of a theoretical mall: The Fall of the Mall (ht Ann, Pat). 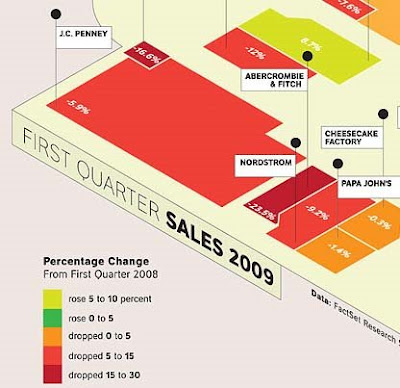 Click on graphic for complete image.
The graphic compares the performance of a number of retailers from Q1 2008 to Q1 2009.
The best performers are a dollar store, a movie theater and a pharmacy.
The worst performers are Saks, Abercrombie & Fitch, Bebe and some others.
This is a theoretical mall where all the retailers are still in business. In reality many stores are vacant, and many malls are dead or dying. See the WSJ: Recession Turns Malls Into Ghost Towns
One industry rule of thumb holds that any large, enclosed mall generating sales per square foot of $250 or less -- the U.S. average is $381 -- is in danger of failure. By that measure, [Eastland Mall in Charlotte] is one of 84 dead malls in a 1,032-mall database compiled by Green Street.
GM Bondholders Agree to Debt-for-Equity, Hummer Sale Near
by Calculated Risk on 5/31/2009 10:12:00 AM
From the NY Times: G.M. Bankruptcy Plan Clears Bondholder Hurdle
General Motors’ bondholders finished voting Saturday on the company’s plan to exchange their debt for an ownership stake ... Bondholders with slightly more than 50 percent of G.M.’s $27.2 billion in bond debt agreed to support the plan by the deadline of 5 p.m ... Bondholders would initially get a 10 percent stake, along with warrants for 15 percent.And the WSJ is reporting that the sale of GM's Hummer brand is near - without details.
Saturday, May 30, 2009
Report: GM Bankruptcy on Monday
by Calculated Risk on 5/30/2009 10:16:00 PM
From the WaPo: GM Bondholders Vote on Sweetened Deal
GM is now speeding toward its day of reckoning, as the automaker will likely file for bankruptcy protection tomorrow.From the WSJ: GM Awaits Fate as Bondholder Votes Are Tallied
General Motors Corp. on Saturday readied for a bankruptcy filing ... The company, the U.S. Treasury and an ad hoc committee representing large institutional creditors all declined comment after the expiration of a 5 p.m. EDT deadline for acceptance of the exchange. However, one member of the ad hoc committee said Saturday that the sweetened deal was expected to be approved by a majority of noteholders ...
GM's board was meeting ahead of an expected announcement on Monday that the auto maker will seek Chapter 11 protection, and GM Chief Executive Fritz Henderson scheduled a news conference Monday in New York.
May Economic Summary in Graphs
by Calculated Risk on 5/30/2009 05:33:00 PM
Here is a collection of real estate and economic graphs for data released in May ...
Note: Click on graphs for larger image in new window. For more info, click on link below graph to original post.
 New Home Sales in April (NSA)
The first graph shows monthly new home sales (NSA - Not Seasonally Adjusted).
Note the Red columns for 2009. This is the second lowest sales for April since the Census Bureau started tracking sales in 1963. (NSA, 33 thousand new homes were sold in March 2009; the record low was 32 thousand in April 1982).
From: New Home Sales Flat in April
 New Home Sales in April
This graph shows shows New Home Sales vs. recessions for the last 45 years. New Home sales have fallen off a cliff.
"Sales of new one-family houses in April 2009 were at a seasonally adjusted annual rate of 352,000, according to estimates released jointly today by the U.S. Census Bureau and the Department of Housing and Urban Development.
This is 0.3 percent (±14.5%)* above the revised March rate of 351,000, but is 34.0 percent (±11.0%) below the April 2008 estimate of 533,000."
From: New Home Sales Flat in April
 New Home Months of Supply in April
There were 10.1 months of supply in April - significantly below the all time record of 12.4 months of supply set in January.
"The seasonally adjusted estimate of new houses for sale at the end of April was 297,000. This represents a supply of 10.1months at the current sales rate.
From: New Home Sales Flat in April
 Existing Home Sales in April
 This graph shows existing home sales, on a Seasonally Adjusted Annual Rate (SAAR) basis since 1993.
Sales in April 2009 (4.68 million SAAR) were 2.9% higher than last month, and were 3.5% lower than April 2008 (4.85 million SAAR).
It's important to note that close to half of these sales were foreclosure resales or short sales. Although these are real transactions, this means activity (ex-distressed sales) is under 3 million units SAAR.
From: Existing Home Sales in April
 Existing Home Inventory April
This graph shows nationwide inventory for existing homes. According to the NAR, inventory increased to 3.97 million in April. The all time record was 4.57 million homes for sale in July 2008. This is not seasonally adjusted.
Typically inventory increases in April, and then really increases over the next few months of the year until peaking in the summer. This increase in inventory was probably seasonal, and the next few months will be key for inventory.
Also, many REOs (bank owned properties) are included in the inventory because they are listed - but not all. Recently there have been stories about a substantial number of unlisted REOs - this is possible.
From: Existing Home Sales in April
 Existing Home Inventory April, Year-over-Year Change
This graph shows the year-over-year change in existing home inventory.
If the trend of declining year-over-year inventory levels continues in 2009 that will be a positive for the housing market. Prices will probably continue to fall until the months of supply reaches more normal levels (in the 6 to 8 month range comparted to the current 10.2 months), and that will take some time.
From: More on Existing Home Sales and Inventory
 Case Shiller House Prices for March
This graph shows the nominal Composite 10 and Composite 20 indices (the Composite 20 was started in January 2000).
The Composite 10 index is off 32.4% from the peak, and off 2.0% in March.
The Composite 20 index is off 31.4% from the peak, and off 2.2% in March.
From: Case-Shiller: Prices Fall Sharply in March
 NAHB Builder Confidence Index in May
This graph shows the builder confidence index from the National Association of Home Builders (NAHB).
The housing market index (HMI) increased to 16 in May from 14 in April from. The record low was 8 set in January.
The increase in April and May followed five consecutive months at either 8 or 9.
From: NAHB: Builder Confidence Increases in May
 Architecture Billings Index for April
"After an eight-point jump in March, the Architecture Billings Index (ABI) fell less than a full point in April. As a leading economic indicator of construction activity, the ABI reflects the approximate nine to twelve month lag time between architecture billings and construction spending. The American Institute of Architects (AIA) reported the April ABI rating was 42.8, down from the 43.7 mark in March. This was the first time since August and September 2008 that the index was above 40 for consecutive months, but the score still indicates an overall decline in demand for design services (any score above 50 indicates an increase in billings)...."
From: Architecture Billings Index Steady in April
 Housing Starts in April
Total housing starts were at 458 thousand (SAAR) in April, the all time record low. The previous record low was 488 thousand in January (the lowest level since the Census Bureau began tracking housing starts in 1959).
Single-family starts were at 368 thousand (SAAR) in April; just above the revised record low in January (357 thousand).
From: Housing Starts at Record Low in April
 Construction Spending in March
This graph shows private residential and nonresidential construction spending since 1993. Note: nominal dollars, not inflation adjusted.
Private residential construction spending is 61.8% below the peak of early 2006.
Private non-residential construction spending is 5.7% below the peak of last September.
From: Private Construction Spending Declines Slightly in March
 April Employment Report
This graph shows the unemployment rate and the year over year change in employment vs. recessions.
Nonfarm payrolls decreased by 539,000 in April. March job losses were revised to
699,000. The economy has lost almost 4 million jobs over the last 6 months, and over 5.7 million jobs during the 16 consecutive months of job losses.
The unemployment rate rose to 8.9 percent; the highest level since 1983.
Year over year employment is strongly negative (there were 5.2 million fewer Americans employed in Apr 2009 than in Apr 2008).
From: Employment Report: 539K Jobs Lost, 8.9% Unemployment Rate
 April Retail Sales
This graph shows the year-over-year change in nominal and real retail sales since 1993.
On a monthly basis, retail sales decreased 0.4% from March to April (seasonally adjusted), and sales are off 11.4% from April 2008 (retail and food services decreased 10.1%).
From: Retail Sales Decline in April
 LA Port Traffic in April
This graph shows the loaded inbound and outbound traffic at the port of Los Angeles in TEUs (TEUs: 20-foot equivalent units or 20-foot-long cargo container). Although containers tell us nothing about value, container traffic does give us an idea of the volume of goods being exported and imported.
Inbound traffic was 21.5% below April 2008.
Outbound traffic was 18.3% below April 2008.
There has been some slight recovery in exports the last two months (the year-over-year comparison was off 30% from December through February). But this is the 2nd worst YoY comparison for imports - only February was worse, and that might have been related to the Chinese New Year. So imports from Asia appear especially weak.
From: LA Area Port Traffic
 U.S. Imports and Exports Through March
This graph shows the monthly U.S. exports and imports in dollars through March 2009.
Both imports and exports declined in March, although it appears the cliff diving in trade might be over.
On a year-over-year basis, exports are off 17.4% and imports are off 27%!
From: U.S. March Trade Deficit: $27.6 billion
 April Capacity Utilization
This graph shows Capacity Utilization. This series is at another record low (the series starts in 1967).
The Federal Reserve reported that "Industrial production decreased 0.5 percent in April after having fallen 1.7 percent in March. Production in manufacturing declined 0.3 percent in April and was 16.0 percent below its recent peak in December 2007. The decreases in manufacturing in April remained broadly based across industries."
From: Industrial Production Declines, now 16% Below Peak
 Vehicle Miles driven in March
The first graph shows the annual change in the rolling 12 month average of U.S. vehicles miles driven. Note: the rolling 12 month average is used to remove noise and seasonality.
By this measure, vehicle miles driven are off 3.3% Year-over-year (YoY); the decline in miles driven was worse than during the early '70s and 1979-1980 oil crisis. However miles driven - compared to the same month of 2008 - has only been off about 1% for the last couple months.
From: D.O.T.: U.S. Vehicle Miles off 1.2% YoY in March
 Unemployment Claims
This graph shows weekly claims and continued claims since 1971.
Continued claims are now at 6.79 million - an all time record. This is 5.1% of covered employment.
Note: continued claims peaked at 5.4% of covered employment in 1982 and 7.0% in 1975. So this isn't a record as a percent of covered employment.
From: Unemployment Claims: Continued Claims at Record 6.79 Million
 Restaurant Performance Index for April
"The outlook for the restaurant industry grew more optimistic in April, as the National Restaurant Association’s comprehensive index of restaurant activity registered its fourth consecutive monthly gain. The Association’s Restaurant Performance Index (RPI) – a monthly composite index that tracks the health of and outlook for the U.S. restaurant industry – stood at 98.6 in April, up 0.8 percent from March, its highest level in 11 months."
From: Restaurant Performance Index Improves in April
 Philly Fed State Conincident Indicators for April
Here is a map of the three month change in the Philly Fed state coincident indicators. All 50 states are showing declining three month activity.
This is the new definition of "Red states" and this is what a widespread recession looks like based on the Philly Fed states indexes.
"Over the past three months, the indexes decreased in all 50 states, for a three-month diffusion index of -100."
From: Philly Fed State Coincident Indexes
U.K.: FSA Aware of Northern Rock Risks in 2004
by Calculated Risk on 5/30/2009 12:58:00 PM
From the Financial Times: War game saw run on Rock
Banking regulators identified Northern Rock as the weak link in Britain's banking system during secret "war games" held as long ago as 2004, the Financial Times has learned.File under "hoocoodanode?"
The risk simulation planning, conducted by the Financial Services Authority, the Bank of England and the Treasury, made clear the systemic risks posed by Northern Rock's business model, and its domino effect on HBOS, then the UK's largest mortgage lender.
The revelation is at odds with government officials' insistence that no one could have foreseen the September 2007 collapse of Northern Rock or the subsequent rescue of HBOS, which was sold to Lloyds Bank.
Even though the exercise revealed the banks' vulnerability, the regulators concluded they could not force the lenders to change their practices, according to several people familiar with the matter.
CRE: See-Through Buildings on the Beltway
by Calculated Risk on 5/30/2009 08:53:00 AM
From the Washington Business Journal: Commercial foreclosures start to spread across Northern Va. (ht Frank)
Anyone who follows the commercial real estate market knows there are buildings in trouble throughout Washington, but as one drives along the Dulles Toll Road or Route 28, it’s hard to miss the signs of distress. “See-through buildings” dot the corridor, bereft of the interior office walls that don’t show up until a tenant does.Vacant buildings. Prices plummeting. Massive refinancing needs of properties with negative equity. Sounds familiar ...
In recent weeks, at least two lenders have given up the waiting game and taken the keys and the title back from the owners: Lincoln Park III and Monument III.
More than 50 office buildings stand empty or virtually empty in Northern Virginia, with 46 lying beyond the Beltway.
...
Some commercial buildings in the Washington region have lost as much as half their value but, on average, his clients are asking tax authorities for 20- to 25-percent reductions in assessed value, said [David Levy, a co-founder of McLean-based Value Advisors Inc., which represents property owners in tax appeals.] said.
...
By next year, a massive wave of properties financed in 2005 through the commercial mortgage-backed securities market will need to find new financing.
U.S. Treasury Estimate: Five Years to Recover $50 Billion GM Outlay
by Calculated Risk on 5/30/2009 12:02:00 AM
From the WaPo: U.S. Hopes To Recoup GM Outlay In 5 Years
The United States would recover most of its planned $50 billion investment in General Motors within five years, according to a preliminary Treasury Department estimate that foresees the company ...
Among the key variables in any such forecast is the number of new cars sold annually in the United States as well as the estimate of GM's share of the market.
During the boom years, the annualized figure for car sales in the United States hovered around 16 million. Recently, it has fallen to between 9 million and 10 million on an annualized basis.
In regulatory filings, GM has estimated that the car market will rebound to 16 million by 2012.
 Click on graph for larger image in new window.
This table from the GM Restructuring Plan (back in February) shows the GM baseline U.S. auto sales forecast and a comparison with J.D. Power and Global Insight forecasts.
Sales will probably be below the Q2 2009 estimate of 10.4 million annual rates since sales in April were at a 9.5 million SAAR - and sales will probably be very weak in May and June with Chrysler and GM in bankruptcy.
 GM expects a modest recovery in sales over the next couple of years - and that seems somewhat reasonable - but it is important to remember that sales during the bubble were inflated as homeowners withdrew equity to buy vehicles. So achieving the levels of the boom years any time soon seems unlikely.
Note: This graph shows U.S. vehicle sales (auto, light truck, heavy truck) since 1967.
Friday, May 29, 2009
Rite Aid and CRE
by Calculated Risk on 5/29/2009 08:11:00 PM
Earlier today Bloomberg reported: Starbucks Pushing Landlords for 25% Cut in Cafe Rents
Starbucks Corp. ... is pushing some U.S. landlords for as much as a 25 percent reduction in lease rates, taking advantage of a declining real estate market to save on rent.Now I've heard through a reliable source (unconfirmed) that Rite Aid is also asking for rent reductions. Rite Aid apparently held a conference call with 60 Rite Aid landlords and asked for a 25% rent reduction - or they would close the stores.
Also, from the Baltimore Business Journal: Rite Aid nixes Baltimore convention
Rite Aid Corp. has canceled its annual convention in Baltimore ... one of Baltimore’s biggest conventions in recent years, bringing 6,000 people to town and pumping $6 million from direct spending into the city in 2008 ... The company had originally booked 14,500 hotel room nights for its nine-day expo in mid-August ...Just more problems for commercial real estate (CRE).
Restaurant Performance Index Improves in April
by Calculated Risk on 5/29/2009 04:54:00 PM
Note: Any reading below 100 shows contraction. So the improvement in the index to 98.6 means the business is still contracting, but contracting at a slower pace.
From the National Restaurant Association (NRA): Restaurant Industry Outlook Continues to Improve as Restaurant Performance Index Hits Highest Level in 11 Months
The outlook for the restaurant industry grew more optimistic in April, as the National Restaurant Association’s comprehensive index of restaurant activity registered its fourth consecutive monthly gain. The Association’s Restaurant Performance Index (RPI) – a monthly composite index that tracks the health of and outlook for the U.S. restaurant industry – stood at 98.6 in April, up 0.8 percent from March, its highest level in 11 months.
“The recent growth in the RPI was driven by the Expectations component, which rose above 100 in April for the first time in 18 months, a level which indicates expansion,” said Hudson Riehle, senior vice president of Research and Information Services for the Association. “Although the RPI’s Current Situation indicators are still in a period of contraction, the solid improvement in the forward-looking indicators suggests that the end of the industry’s downturn may be in sight.”
...
Restaurant operators reported negative customer traffic levels for the 20th consecutive month in April.
...
Along with an improving outlook, restaurant operators are also ramping up plans for capital expenditures in the months ahead. Forty-six percent of restaurant operators plan to make a capital expenditure for equipment, expansion or remodeling in the next six months, up from 44 percent last month and just 37 percent four months ago.
emphasis added
Click on graph for larger image in new window.Unfortunately the data for this index only goes back to 2002.
This is another example of still contracting, but contracting at a slower pace.
The increase in operators planning capital expenditures is a positive.
Market and FDIC Insured Banks with High NPAs
by Calculated Risk on 5/29/2009 03:54:00 PM
First the market graph from Doug:
| Click on graph for larger image in new window. The first graph is from Doug Short of dshort.com (financial planner): "Four Bad Bears". Note that the Great Depression crash is based on the DOW; the three others are for the S&P 500. |  |
TheStreet.com has a list of 89 banks to watch: Eighty-Nine U.S. Banks, Thrifts Lack Capital
Here are the banks with the highest percentage of Non-Performing Assets on TheStreet.com's list (note: Corus and Vineyard make the list)
| Bank | City | State | Assets (Millions) | Percent NPA |
|---|---|---|---|---|
| Community Bank of Lemont | Lemont | Ill. | $86 | 36.3% |
| Security Bank of Gwinnett County | Suwanee | Ga. | $322 | 34.14 |
| Corus Bank, NA | Chicago | Ill. | $7,626 | 32.78 |
| First Security National Bank | Norcross | Ga. | $137 | 32.7 |
| Union Bank, NA | Gilbert | Ariz. | $129 | 31.85 |
| First State Bank of Altus | Altus | Okla. | $105 | 28.48 |
| Southern Community Bank | Fayetteville | Ga. | $372 | 25.9 |
| First Piedmont Bank | Winder | Ga. | $124 | 25.17 |
| Neighborhood Community Bank | Newnan | GA | $213 | 23.24 |
| Bank of Lincolnwood | Lincolnwood | Ill. | $213 | 23.13 |
| McIntosh Commercial Bank | Carrollton | Ga. | $367 | 22.96 |
| Vineyard Bank, NA | Corona | Calif. | $1,856 | 22.22 |
| Florida Community Bank | Immokalee | Fla. | $980 | 21.8 |
| Security Bank of North Metro | Woodstock | Ga. | $224 | 20.96 |
Hotel Occupancy: RevPAR Off 19.4%
by Calculated Risk on 5/29/2009 02:21:00 PM
From HotelNewsNow.com: STR posts US results for 17-23 May 2009
In year-over-year measurements, the industry’s occupancy fell 11.1 percent to end the week at 59.4 percent. Average daily rate dropped 9.3 percent to finish the week at US$98.31. Revenue per available room for the week decreased 19.4 percent to finish at US$58.39.
 Click on graph for larger image in new window.
This graph shows the YoY change in the occupancy rate (3 week trailing average).
The three week average is off 10.3% from the same period in 2008.
The average daily rate is down 9.3%, so RevPAR is off 19.4% from the same week last year.
Note: HotelNewsNow has a free hotel related newsletter available here.
More on S&P and Possible CMBS Downgrades
by Calculated Risk on 5/29/2009 12:54:00 PM
On Tuesday, S&P issued a request for comments on proposed changes to their CMBS rating methodology. This was the key sentence:
Our preliminary findings indicate that approximately 25%, 60%, and 90% of the most senior tranches (by count) within the 2005, 2006, and 2007 vintages, respectively, may be downgraded.After some negative analyst reactions, S&P extended the comment period (ht Jason):
Standard & Poor's Ratings Services today extended the comment period for its proposed changes to its methodology for rating U.S. CMBS conduit/fusion pools to June 9, 2009. The longer consultation period, which many market participants have requested, will allow time to provide further constructive feedback.downgraded.Citi held a conference call this morning to discuss the proposed S&P changes. One of the key points was that Citi considered the S&P rent assumptions draconian. Basically S&P was going to start with the lower of current or market rents, and then decrease rents a further 6 to 30% depending upon property type.
Actually this seems reasonable - rents are falling for all property types. Of course existing tenants will keep paying their current rent - or will they? From Bloomberg: Starbucks Pushing Landlords for 25% Cut in Cafe Rents
Starbucks Corp., the world’s largest coffee-shop operator, is pushing some U.S. landlords for as much as a 25 percent reduction in lease rates, taking advantage of a declining real estate market to save on rent.This seems like deja vu with analysts arguing against subprime rating cuts - the duper AAA are bulletproof - only to find the rating agencies were actually behind the curve.
Philly Fed State Coincident Indexes
by Calculated Risk on 5/29/2009 10:53:00 AM
Click on map for larger image.
Here is a map of the three month change in the Philly Fed state coincident indicators. All 50 states are showing declining three month activity.
This is the new definition of "Red states" and this is what a widespread recession looks like based on the Philly Fed states indexes.
On a one month basis, activity decreased in 45 states in April. Here is the Philadelphia Fed state coincident index release for April.
The Federal Reserve Bank of Philadelphia has released the coincident indexes for all 50 states for April 2009. In the past month, the indexes increased in three states, decreased in 45, and were unchanged in the other two, for a one-month diffusion index of -84. Over the past three months, the indexes decreased in all 50 states, for a three-month diffusion index of -100.
 The second graph is of the monthly Philly Fed data of the number of states with one month increasing activity. Most of the U.S. was has been in recession since December 2007 based on this indicator.
Almost all states showed declining activity in April. Still a widespread recession ...
Home Sales Ratio: Existing to New
by Calculated Risk on 5/29/2009 10:02:00 AM
Yesterday I posted a graph labeled the distressing gap showing that existing home sales have held up much better during the housing bust than new home sales - probably because of distressed sales (foreclosure resales and short sales). Click on graph for larger image in new window.
This graph shows the same information, but as a ratio for existing home sales divided by new home sales (ht Michael)
The recent change in the ratio is probably related to distressed sales - home builders cannot compete with REO sales, and this has pushed down new home sales while keeping existing home sales activity elevated.
Although distressed sales will stay elevated from some time, eventually I expect this ratio to decline - with a combination of falling existing home sales and eventually rising new home sales.  The second graph shows the ratio back to 1969 (annual data before 1994).
Note: the NAR has changed their data collection over time and the older data does not include condos: Single-family data collection began monthly in 1968, while condo data collection began quarterly in 1981; the series were combined in 1999 when monthly collection of condo data began.
Tim Duy: "A Return to a Nasty External Dynamic?"
by Calculated Risk on 5/29/2009 08:57:00 AM
From Tim Duy's Fed Watch: A Return to a Nasty External Dynamic?
An excerpt:
[W]e are stuck with two apparently contrasting views. On one hand, rising long rates and the related steepening of the yield curve should indicate improving economic conditions - after all, rising yields simply imply that market participants are gaining confidence to put their money to work in more risky endeavors. The steeper yield curve should boost bank earnings and, in time, encourage lending. On the other hand, higher yields may undermine support for the housing market, thus extending the downturn.And Duy concludes:
I want to believe that the rapid reversal of Treasury yields is a benign, even positive, event. This is likely the Fed's view; consequently, the[y] will hold steady on policy. Challenging this benign view is that the reversal appears to be lock step with a return to dynamics seen in 2007 and 2008 - exceedingly low US rates encouraging Dollar outflows, stepping up the pace of foreign central bank reserve accumulation and putting upward pressure on key commodity prices. I worry that policymakers have forgotten the external dynamic that was hidden by the crisis induced flight to Dollars last fall. Indeed, capital outflows (indicated by a foreign central bank effort to reverse those flows) would signal that much work still needs to be done to curtail US consumption to bring the global economy back into balance. Policymakers are unprepared for this possibility.A long post well worth reading.
Thursday, May 28, 2009
The U.K Stress Test Scenario
by Calculated Risk on 5/28/2009 11:52:00 PM
From The Times: House prices halved in FSA stress test
The key assumptions in the stress test were that the economy would shrink by 6 per cent from peak to trough with growth not returning until 2011 and trend growth not until 2012. The regulators also assumed unemployment rising to 12 per cent of the workforce, or 3.7 million people, which is 1.5 million more than the present number and would be a higher level of joblessness even than in the recession of the early 1980s.The U.S. more adverse scenario is for unemployment to rise to 10.4% and house prices (Case-Shiller Composite 10) to fall by almost half.
Finally, the FSA posited a 50 per cent fall in house prices from their peak and a 60 per cent fall in commercial property prices - office blocks and shops.
So far, house prices have fallen by 19 per cent from their peak in October 2007, according to the Nationwide Building Society.
...
Analysts said the stress test parameters were, if anything, not severe enough. The market is already expecting a peak-to-trough fall in GDP of 4.5 per cent and unemployment peaking at 10.5 per cent, “which is not significantly better than the assumptions made,” analysts at Credit Suisse commented. However, the house price scenario did look more extreme, it added.
And how about a 60% decline in commercial real estate? How would that impact the S&P CMBS assumptions?
Report: $75 billion of CMBS Market Capitalization Lost in Two Days
by Calculated Risk on 5/28/2009 08:35:00 PM
In a research note today, Citigroup analysts estimated that "more than $75 billion of CMBS market capitalization has been lost" since the S&P request for comment on changes to their U.S. CMBS rating methodology was issued two days ago.
S&P noted:
Our preliminary findings indicate that approximately 25%, 60%, and 90% of the most senior tranches (by count) within the 2005, 2006, and 2007 vintages, respectively, may be downgraded.Citigroup commented that the changes were "a complete surprise", "flawed", lacked "justification" and the "S&P methodology changes do not seem rational or predictable". Ouch.
Citi also noted that this will impact the CMBS legacy TALF announced last week by the Fed. According to Citi the "S&P changes could impact nearly 40% of the triple-A TALF eligible universe" and they expect the Fed to change their criteria.


