 RSS Feed
 by Calculated Risk on 8/31/2010 07:10:00 PM
Tuesday, August 31, 2010
Existing Home Inventory declines slightly in August
Tom Lawler reports that at the end of August, listings on Realtor.com totaled 4,007,860, down 0.7% from 4,038,133 at the end of July. This is 2.5% above August 2009.
The NAR reported inventory at 3.98 million at the end of July, and at 3.924 million in August 2009. So they will probably report inventory at close to 4 million for August.
Since sales probably only increased slightly in August, the months-of-supply metric will be in double digits again in August and probably still over 12 months.
Note: there is a seasonal pattern for existing home inventory. Usually inventory peaks in July and declines slightly through October - and then declines sharply at the end of the year as sellers take their homes off the market for the holidays.
Restaurant Index shows contraction in July
by Calculated Risk on 8/31/2010 04:14:00 PM
This is one of several industry specific indexes I track each month.  Click on graph for larger image in new window.
Same store sales and customer traffic both declined in July (on a year-over-year basis). This is the fourth consecutive month of declines.
Unfortunately the data for this index only goes back to 2002.
Note: Any reading above 100 shows expansion for this index.
From the National Restaurant Association (NRA): Restaurant Industry Outlook Remained Uncertain in July as Restaurant Performance Index Remains Essentially Flat
As a result of soft sales and traffic levels and a deteriorating outlook among restaurant operators, the National Restaurant Association’s comprehensive index of restaurant activity remained essentially flat in July. The Association’s Restaurant Performance Index (RPI) – a monthly composite index that tracks the health of and outlook for the U.S. restaurant industry – stood at 99.4 in July, down 0.1 percent from June and its fourth consecutive decline. In addition, the RPI stood below 100 for the third consecutive month, which signifies contraction in the index of key industry indicators.Restaurants are a discretionary expense, and this contraction could be because of the sluggish recovery or might suggest further weakness in consumer spending in the months ahead.
...
Restaurant operators reported negative same-store sales for the fourth consecutive month in July, with the overall results similar to the June performance.
...
Restaurant operators also reported a net decline in customer traffic levels in July.
...
Restaurant operators have become less optimistic about their prospects for sales growth in recent months.
emphasis added
FOMC August Minutes: Both employment and inflation to fall short of dual mandate
by Calculated Risk on 8/31/2010 02:00:00 PM
From the Fed: Minutes of the Federal Open Market Committee
Economic outlook:
Members still saw the economic expansion continuing, and most believed that inflation was likely to stabilize near recent low readings in coming quarters and then gradually rise toward levels they consider more consistent with the Committee's dual mandate for maximum employment and price stability. Nonetheless, members generally judged that the economic outlook had softened somewhat more than they had anticipated, particularly for the near term, and some saw increased downside risks to the outlook for both growth and inflation. Some members expressed a concern that in this context any further adverse shocks could have disproportionate effects, resulting in a significant slowing in growth going forward. While no member saw an appreciable risk of deflation, some judged that the risk of further near-term disinflation had increased somewhat. More broadly, members generally saw both employment and inflation as likely to fall short of levels consistent with the dual mandate for longer than had been anticipated.And on policy:
All but one member concluded that it would be appropriate to begin reinvesting principal received from agency debt and MBS held in the SOMA by purchasing longer-term Treasury securities in order to keep constant the face value of securities held in the SOMA and thus avoid the upward pressure on longer-term interest rates that might result if those holdings were allowed to decline. Several members emphasized that in addition to continuing to develop and test instruments to facilitate an eventual exit from the period of unusually accommodative monetary policy, the Committee would need to consider steps it could take to provide additional policy stimulus if the outlook were to weaken appreciably further. Given the softer tone of recent data and the more modest near-term outlook, members agreed that some changes to the statement's characterization of the economic and financial situation were necessary.Not much new ...
On Case-Shiller House Prices: October is the "Witching Hour"
by Calculated Risk on 8/31/2010 12:54:00 PM
As we've discussed for some time, the Case-Shiller index is seriously lagged to real time data. The release today was for "June", but it is really an average of April, May and June.
Home sales were strong in April, May and June, and then collapsed in July. And prices have probably been falling for two months now - but that won't show up in Case-Shiller until the end of next month or even October (the Case-Shiller release at the end of October will be for June, July and August).
Note: The title for this post is from Rolfe Winkler at the WSJ's Heard on the Street (last week): Housing's Witching Hour
[T]he S&P/Case-Shiller home-price index ... could be set for another leg down. The index is computed using a three-month rolling average, meaning last month's weakness really should assert itself in late October.RadarLogic released a statement today: As Predicted, June S&P/Case-Shiller Home Price Indices Overstate Housing Market Strength
[T]he latest S&P/Case-Shiller home price indices show healthy improvement in home prices while other housing market indicators, including the RPX Composite price, show that housing markets are starting to weaken.The CoreLogic repeat sales index showed prices were flat from May to June (CoreLogic uses a weighted 3 month average and picks up the trend change a little quicker than Case-Shiller).
... We believe that these figures overstate the current strength of the U.S. housing markets. As we reported in this month’s RPX Monthly Housing Market Report, the RPX 25-MSA Composite Price declined 0.2% through the end of June on a year-over-year basis. ...
The conflict between the strength expressed in the S&P/Case-Shiller indices and the weakness apparent in other housing market indicators likely arises from the fact that the S&P/Case-Shiller indices are calculated using data from transactions that occur over a three-month period. As a result, the indices smooth over recent price movements and can take a number of months to reflect price fluctuations.
... Our concern is that, as we saw in spring 2009, the only effective stimulus of new housing demand will prove to be a precipitous decline in home prices. Our current analysis shows early signs that such a dynamic is approaching.
FDIC Q2 Banking Profile: 829 Problem Banks
by Calculated Risk on 8/31/2010 11:12:00 AM
The FDIC released the Q2 Quarterly Banking Profile today.
The FDIC listed 829 banks with $403 billion in assets as “problem” banks in Q2, up from 775 banks in Q1 2010, but the total assets declined from $431 billion in assets in Q1 2010.
There were 702 banks with $403 billion in assets on the list at the end of 2009.
Note: Not all problem banks will fail - and not all failures will be from the problem bank list - but this shows the problem is significant and still growing.
The Unofficial Problem Bank List shows 840 problem banks with $410 billion in assets - the difference is timing of releases of formal actions (or hints of pending actions). 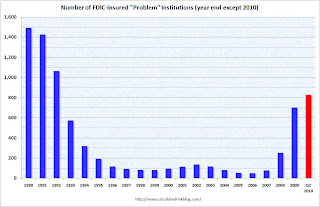 Click on graph for larger image in new window.
This graph shows the number of FDIC insured "problem" banks since 1990.
All data is year end except Q1 2010.
The 829 problem banks reported at the end of Q2 is the highest since 1992.
The FDIC is just behind the pace for 1,000 problem banks by the end of the year, although it also depends on how many banks are removed from the list.
On the Deposit Insurance Fund: The fund had an ending balance of -$15.2 billion at the end of Q2, an improvement from -$20.7 billion at the end of Q1. However the fund has plenty of cash because of the prepaid assessments last year - but those assessments will not be accounted for until they were originally due.
Case-Shiller: Home Price indices increase in June
by Calculated Risk on 8/31/2010 09:00:00 AM
IMPORTANT: These graphs are Seasonally Adjusted (SA). S&P has cautioned that the seasonal adjustment is probably being distorted by irregular factors. These distortions could include distressed sales and the various government programs.
S&P/Case-Shiller released the monthly Home Price Indices for June (actually a 3 month average of April, May and June).
This includes prices for 20 individual cities, and two composite indices (10 cities and 20 cities) and the quarterly national index.
From S&P: For the Past Year Home Prices Have Generally Moved Sideways
Data through June 2010, released today by Standard & Poor’s for its S&P/Case-Shiller Home Price Indices, the leading measure of U.S. home prices, show that the U.S. National Home Price Index rose 4.4% in the second quarter of 2010, after having fallen 2.8% in the first quarter. Nationally, home prices are 3.6% above their year-earlier levels. In June, 17 of the 20 MSAs covered by S&P/Case-Shiller Home Price Indices and both monthly composites were up; and the two composites and 15 MSAs showed year-over-year gains. Housing prices have rebounded from crisis lows, but other recent housing indicators point to more ominous signals as tax incentives have ended and foreclosures continue.
 Click on graph for larger image in new window.
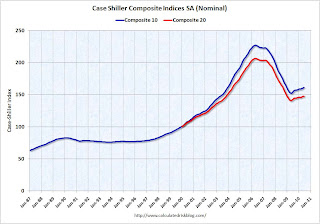
 The first graph shows the nominal seasonally adjusted Composite 10 and Composite 20 indices (the Composite 20 was started in January 2000).
The Composite 10 index is off 29.0% from the peak, and up 0.3% in June (SA).
The Composite 20 index is off 28.4% from the peak, and up 0.3% in June (SA).
 The second graph shows the Year over year change in both indices.
The Composite 10 is up 5.0% compared to June 2009.
The Composite 20 is up 4.2% compared to June 2009.
This is the fifth month with YoY price increases in a row.
The third graph shows the price declines from the peak for each city included in S&P/Case-Shiller indices.
 Prices increased (SA) in 9 of the 20 Case-Shiller cities in June seasonally adjusted.
Prices in Las Vegas are off 56.5% from the peak, and prices in Dallas only off 4.8% from the peak.
Prices are probably falling right now (starting in July), but this will not show up in the Case-Shiller index for a few months since this an average of three months.
Monday, August 30, 2010
Europe Bond Yields
by Calculated Risk on 8/30/2010 11:29:00 PM
Usually I just post the bond spreads in Europe, but I think this excellent tool from Bloomberg shows visually what is happening with bond yields in Europe. Click on graph for larger image in new window.
You can click here for the graph for the Greece 10 year bond yields. Then you can add other bonds for comparison.
This is a 3 year graph from Bloomberg.
Where it says "Add a comparison" you can enter the symbols for Germany (GDBR10:IND) and then Ireland (GIGB10YR:IND) to create this graph.
Here are the symbols for Portugal (GSPT10YR:IND) and Spain (GSPG10YR:IND) too (not graphed). Nemo has links for more countries on the sidebar of his site.
Starting in 2008 the bond yields started to separate - with Greece and Ireland paying more. Then in May of this year, the situation reached crisis levels. And now the spreads are steadily widening again - as the German bond yields have fallen recently (like the U.S. yields) and the Irish and Greek bond yields have been increasing.
Gibbs: Housing Tax Credit not high on list of options
by Calculated Risk on 8/30/2010 08:33:00 PM
From the Press Briefing by Press Secretary Robert Gibbs
Q: A lot of folks have been talking about the first-time homebuyers tax credit sort of propping up the housing market. Is that one of these new measures that he might be considering?And a "hoocoodanode" moment too:
MR. GIBBS: Look, obviously, there was -- that was something that was done originally. I don't -- while I have not see, obviously, a final list, that is -- I think bringing that back is not on -- is not as high on the list as many other things are.
Q: In retrospect, was the stimulus too small?How about Christina Romer (
MR. GIBBS: Look, we always -- I think it makes sense to step back just for a second. If you look at -- and I don't think anybody had -- and I think we’d be the first to admit that nobody had, in January of 2009, a sufficient grasp at the sheer depth of what we were facing. I think that's, quite frankly, true for virtually every economist that made predictions.
the chair of the Council of Economic Advisers)? From Ryan Lizza at the New Yorker:
At the December [2008] meeting, it was Romer’s job to explain just how bad the economy was likely to get. “David Axelrod said we have to have a ‘holy-shit moment,’ ” she began. “Well, Mr. President, this is your ‘holy-shit moment.’ It’s worse than we thought.” She gave a short tutorial about what happens to an economy during a depression, what happened during previous severe recessions, and what could happen if the Administration didn’t act. She showed PowerPoint slides emphasizing that the situation would require a bold government response.So Romer thought the right size was probably about double what was actually enacted (excluding the Alternative Minimum Tax relief).
...
The most important question facing Obama that day was how large the stimulus should be. Since the election, as the economy continued to worsen, the consensus among economists kept rising. ... Romer had run simulations of the effects of stimulus packages of varying sizes: six hundred billion dollars, eight hundred billion dollars, and $1.2 trillion. The best estimate for the output gap was some two trillion dollars over 2009 and 2010. Because of the multiplier effect, filling that gap didn’t require two trillion dollars of government spending, but Romer’s analysis, deeply informed by her work on the Depression, suggested that the package should probably be more than $1.2 trillion.
Lawler: HUD Secretary May Have Just Made Near-Term Home Sales Worse
by Calculated Risk on 8/30/2010 04:53:00 PM
CR Note: Here are economist Tom Lawler's thoughts on HUD Secretary Shaun Donovan comments this weekend ...
In an interview with CNN over the weekend, HUD Secretary Donovan noted that the July plunge in home sales following the end of the federal home buyer tax credit was much sharper than the administration expected; that the administration was “very concerned,” and would “do everything we can” to stabilize the shaky housing market. While he said that “it's too early to say after one month of numbers whether the tax credit will be revived or not,” he also said that "we're going to be focused like a laser on where the housing market is moving going forward, and we are going to go everywhere we can to make sure this market stabilizes and recovers."
Many folks appear to have interpreted Donovan’s remarks as meaning that the administration has not “ruled out” reviving the home buyer tax credit if home sale continue to be weaker than expected, thus confirming some potential home buyers’ views that it’s better to wait to buy a home until the government “does it again.” While follow-ups by CNBC got a comment from a HUD spokesperson that there was “(n)o news here … there are no discussions underway to revive the credit,” in fact to some potential home buyers there was in fact news: the administration’s housing spokesperson said that if housing remains weak, the administration may revive the federal home buyer tax credit!!! CNBC even speculated that the next one might include a credit not just for “first time/move-up (sic) buyers, but a credit for buyers purchasing foreclosed properties or short sales” as well (though CNBC gave no supporting evidence for such a move, and I’m guessing they “made this up.”).
As best as I can tell Secretary Donovan was in New Orleans giving interviews on the “Katrina” anniversary, but CNN’s reporter focused first on housing and the possibility of a “double dip.” and Donovan appeared to be “winging it.”
Nevertheless, Donovan’s comments, and the press reports that followed, could well lead many a prospective home buyer to hold off on buying a home because another tax credit might be coming – which, of course, would lead to weaker than otherwise home sales, which Donovan implied might lead the administration to consider reviving the home buyer tax credit!!!!!! A few realtors and home builders have noted that a few potential buyers have already been citing the possibility of a “revival” of the tax credit as a reason for them “holding off” buying now.
The home buyer tax credit, of course, was an enormously costly and inefficient program where many home buyers who would have purchased a home anyway got a tax credit for doing so. Estimates vary, but the 2009-2010 tax credits probably will “cost” the government in terms of lost revenue somewhere in the neighbor of $26-28 billion. While to some that might not seem like “a lot,” it’s about equal to the combined SF REO carrying value of Fannie, Freddie, and FHA (the latter of which I am estimating)!!! Imagine if the government, rather than enacting yet another costly and ineffective tax credit, instead spent a fraction of the probable cost on more effective REO management, including perhaps a program to rehab and rent out such properties instead of “dumping ‘em” on the market!
Already there are news headlines along the lines of “Homebuyer Tax Credit Back in Play?,” “Another Home Buyer Tax Credit?, and “A Revival of the Homebuyer Tax Credit?,” and right after Donovan’s interview two (whacky) Florida Senate candidates both said they would heartily support a home buyer tax credit “revival.”
If in fact there is “no news here” – and good God I hope administration officials realize that giving potential home buyers the notion that a home buyer tax credit MIGHT be revived will absolutely and unequivocally depress home sales over the next several months – the administration should have Donovan or another HUD spokesperson explicitly state that there is no plan to revive the home buyer tax credit in the foreseeable future – and they should do this SOON!!!!
CR Note: This was from economist Tom Lawler.
Report: No discussions underway to revive housing tax credit
by Calculated Risk on 8/30/2010 02:33:00 PM
Last night I posted some comments from HUD Secretary Shaun Donovan. From CNN's "State of the Union" transcript:
[CNN's Ed] HENRY: Is that housing credit now dead? Or does the administration think you should try to revive it to try to prop this industry up?Diana Olick at CNBC contacted HUD today: Another Home Buyer Tax Credit?
DONOVAN: Look, Ed, I think it's too early to say after one month of numbers whether the tax credit will be revived or not. All I can tell you is that we are watching very carefully.
[A] HUD spokesperson ... responded: "No news here...there are no discussions underway to revive the credit."Hopefully the tax credit is done.
Regional Fed Manufacturing Surveys and the ISM PMI
by Calculated Risk on 8/30/2010 11:39:00 AM
Now that all the regional Fed manufacturing surveys for August have been released, here is an update to the graph I posted last week: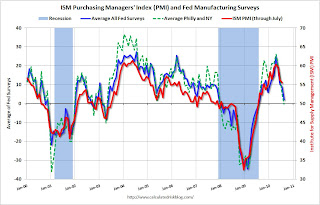 Click on graph for larger image in new window.
For this graph I averaged the New York and Philly Fed surveys (dashed green), and averaged five surveys including New York, Philly, Richmond, Dallas and Kansas City (blue).
The Institute for Supply Management (ISM) PMI (red) is through July (right axis).
ISM PMI for August will be released on Wednesday at 10 AM ET. The consensus is for a decline to 53.0 from 55.5 in July.
Based on the regional surveys, it appears that the PMI will decline in August - but will probably still be above 50 (indicating expansion in August).
Dallas Fed: Texas Manufacturing Activity Still Weak in August
by Calculated Risk on 8/30/2010 10:33:00 AM
From the Dallas Fed: Texas Manufacturing Activity Still Weak
Texas factory activity was unchanged in August, according to business executives responding to the Texas Manufacturing Outlook Survey. The production index, a key measure of state manufacturing conditions, came in at zero, posting a third consecutive month of little to no growth.This is the last of the regional Fed surveys for August, and they all showed manufacturing slowing or even contracting.
Most other indexes for current activity remained negative in August. The new orders index stayed at –9, implying incoming orders continue to fall. The capacity utilization and shipments indexes pushed deeper into negative territory, suggesting further contraction of business.
...
The employment index turned negative for the first time in six months, largely due to the share of firms reporting layoffs rising from 15 percent in July to 23 percent in August, and hours worked contracted again.
The national ISM manufacturing survey will be released on Wednesday.
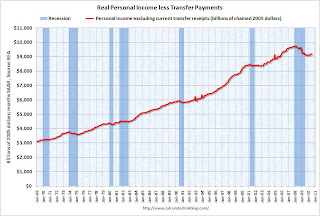
Personal Income, Spending increase in July
by Calculated Risk on 8/30/2010 08:30:00 AM
From the BEA: Personal Income and Outlays, July 2010
Personal income increased $30.0 billion, or 0.2 percent ... Personal consumption expenditures (PCE) increased $44.1 billion, or 0.4 percent
...
Real PCE -- PCE adjusted to remove price changes -- increased 0.2 percent in July, compared with an increase of 0.1 percent in June.
...
Personal saving as a percentage of disposable personal income was 5.9 percent in July, compared with 6.2 percent in June.
 Click on graph for large image.
This graph shows real personal income less transfer payments since 1969.
This measure of economic activity is moving sideways - similar to what happened following the 2001 recession.
This month the saving rate decreased slightly ...
 This graph shows the saving rate starting in 1959 (using a three month trailing average for smoothing) through the July Personal Income report. The saving rate decreased to 5.9% in July from 6.2% in June (flat at 6.1% using a three month average).
 I expect the saving rate to rise further - perhaps to 8% or more.
The increase in income was good news, but personal income less transfer payments are still only 1.2% above the low of last year - and still 5.5% below the pre-recession peak.
Sunday, August 29, 2010
Another Housing Tax Credit?
by Calculated Risk on 8/29/2010 09:17:00 PM
From Reuters: No Decision on Reviving Homebuyer Credit: Donovan
"It's too early to say whether the tax credit will be revived," Donovan said in an interview on CNN's "State of the Union" program. He said the administration would "do everything we can" to stabilize the shaky U.S. housing market.The problem in housing is there is too much supply (at the current price). Incentivizing people to buy existing homes just shuffles households around - it does NOT reduce the overall supply unless the buyer is moving out of their parent's basement. I doubt that happened very often. Note: It is important to remember that rental units are part of the overall supply, so moving people from a rental unit to homeownership doesn't help.
And if the tax credit leads to more new home sales - that ADDS to the excess supply. And that makes the situation WORSE.
It would be far better for housing and the economy to announce "There will be no further housing tax credits."
Earlier today:
Foreclosures: Movin' on up!
by Calculated Risk on 8/29/2010 06:19:00 PM
This is a something we've been watching for some time ...
From Lauren Beale at the Los Angeles Times: Foreclosures of million-dollar-plus homes on the rise
Although the pace of foreclosures has slowed in the general housing market in Southern California and much of the nation, it's still rising for upper-tier homes.Earlier today:
The number of homes in the $1-million-and-up slice of the market that have become bank owned has tripled in the second quarter compared with the same period three years earlier in Los Angeles County, which has the majority of Southern California's high-priced REO houses. And the trend has shown little sign of slowing, according to data from ForeclosureRadar.
...
"We believe the high end is ready to fall apart," [Bryan Ochse of Media West Realty in Burbank, which works with 11 lending institutions and specializes in REO sales] said.
Schedule for Week of August 29th
by Calculated Risk on 8/29/2010 12:55:00 PM
This will be another busy week - the August employment report on Friday is the key economic release this week.
The previous post is the summary of last week.
8:30 AM ET: Personal Income and Outlays for July 2010. The consensus is for a 0.3% increase in both income and spending (compared to June). The core PCE Price Index is expected to increase 0.1%.
10:30 AM Dallas Fed Manufacturing Survey for August. The consensus is for a decrease in the index to flat (neither expanding or contracting) from 5 last month. These regional surveys are important now since it appears manufacturing is slowing (or contracting like the Philly Fed survey showed).
9:00 AM: S&P/Case Shiller Home Price Index for June (3 month average). The consensus is for prices to be mostly flat in the June report.
9:45 AM Chicago Purchasing Managers Index (PMI) for August. The consensus is for a decline to 56.0 from 62.3 in July.
10:00 AM Consumer confidence index from the Conference Board for August. The consensus is for a slight increase to 51.0 from 50.4.
2:00 PM: FOMC Minutes, Meeting of August 10, 2010
7:00 AM: The Mortgage Bankers Association (MBA) will release the mortgage purchase applications index. This index has been fairly flat over the last couple of months - suggesting reported existing home sales in August will not be much stronger than in July.
8:15 AM: ADP Employment Report for August. This report is for private payrolls only (no government). The consensus is for +20,000 payroll jobs in August, down from +42,000 in July.
10:00 AM: ISM Manufacturing Index for August. The regional Fed reports suggest a decline in the ISM manufacturing index. The consensus is for a decline to 53.0 from 55.5 in July.
10:00 AM: Construction Spending for July. The consensus is for a 0.6% decline in spending.
4:00 PM (approx): Light Vehicle Sales for August. The various manufacturers will report August sales in the morning. Usually around 4 PM I post an estimate of SAAR for the month. The consensus is for sales of 11.6 million, about the same as in July.
NOTE: There is a conference on Wednesday and Thursday in Washington, D.C. at the Federal Reserve: Federal Reserve REO and Vacant Properties Summit
8:30 AM: The initial weekly unemployment claims report will be released. Consensus is for a slight decrease to 470K from 473K last week. The increase in weekly claims is very concerning and the 4-week average is at the highest level since last November.
8:30 AM: Nonfarm Productivity for Q2 (Final)
10:00 AM: Manufacturers' Shipments, Inventories and Orders for July.
10:00 AM: Pending Home Sales Index for July. The consensus is for a slight increase (about 1.5%) in contracts signed. This index declined 2.6% in June (after collapsing in May). It usually takes 45 to 60 days to close, so this will provide an early indication of closings in September.
8:30 AM: Employment Report for August. The consensus is for about a loss of 90,000 payroll jobs, with 116,000 fewer Census jobs, or about +26,000 ex-Census increase in payrolls. The consensus is for the unemployment rate to increase slightly to 9.6% from 9.5% in July. For a preview, see: Will the unemployment rate spike higher?
10:00 AM: ISM Non-manufacturing Index for August. The consensus is for a decrease in the service index to 53.0 from 54.3 in July.
After 4:00 PM: The FDIC will probably have another busy Friday afternoon ...
Expected early in the week: Q2 Quarterly Banking Profile from the FDIC.
Expected on Thursday: August Personal Bankruptcy Filings
Summary for Week ending August 28th
by Calculated Risk on 8/29/2010 07:24:00 AM
It was a busy week ...
The NAR reported:
Existing-home sales, which are completed transactions that include single-family, townhomes, condominiums and co-ops, dropped 27.2 percent to a seasonally adjusted annual rate of 3.83 million units in July from a downwardly revised 5.26 million in June, and are 25.5 percent below the 5.14 million-unit level in July 2009.
...
Total housing inventory at the end of July increased 2.5 percent to 3.98 million existing homes available for sale, which represents a 12.5-month supply at the current sales pace, up from an 8.9-month supply in June.
 Click on graph for larger image in new window.
This graph shows existing home sales, on a Seasonally Adjusted Annual Rate (SAAR) basis since 1993.
Sales in July 2010 (3.83 million SAAR) were 27.2% lower than last month, and were 25.5% lower than July 2009 (5.14 million SAAR).
The next graph shows the year-over-year (YoY) change in reported existing home inventory and months-of-supply. Inventory is not seasonally adjusted, so it really helps to look at the YoY change.
 Although inventory increased from June 2010 to July 2010, inventory decreased 1.9% YoY in July. The slight year-over-year decline is probably because some sellers put their homes on the market in the Spring hoping to take advantage of the home buyer tax credit.
 Note: Usually July is the peak month for inventory.
A normal housing market usually has under 6 months of supply. The following graph shows the relationship between supply and house prices (using Case-Shiller).
 This graph show months of supply (through July 2010) and the annualized change in the Case-Shiller Composite 20 house price index (through May 2010).
Below 6 months of supply (blue line) house prices are typically rising (black line).
Above 6 or 7 months of supply, house prices are usually falling. This isn't perfect - it is just a guideline. This is a key reason why I expect house prices to fall further later this year as measured by the Case-Shiller and CoreLogic repeat sales house price indexes.
 The Census Bureau reports New Home Sales in July were at a seasonally adjusted annual rate (SAAR) of 276 thousand. This is an decrease from the record low of 315 thousand in June (revised down from 330 thousand).
This graph shows New Home Sales vs. recessions for the last 47 years.
And another long term graph - this one for New Home Months of Supply.
 Months of supply increased to 9.1 in July from 8.0 in June. The all time record was 12.4 months of supply in January 2009. This is still very high (less than 6 months supply is normal).
 The 276 thousand annual sales rate for July is the all time record low (May was revised up a little). This was another very weak report. New home sales are important for the economy and jobs - and this indicates that residential investment will be a sharp drag on GDP in Q3.
Here is my post on the MBA Q2 delinquency report: 14.42% of Mortgage Loans Delinquent or in Foreclosure . This graph (from the earlier post) shows the delinquency rate by "bucket" (30 days, 60 days, 90+ days, and in foreclosure process):
 The total percent of loans delinquent or in the foreclosure process declined only slightly in Q2 from Q1 - and the rate is the second highest on record.
Loans 30 days delinquent increased to 3.51%, and this is about the same levels as in Q4 2008 (slightly below the peak of 3.77% in Q1 2009).
Delinquent loans decreased in all other buckets - especially in the 90+ day bucket. MBA Chief Economist Jay Brinkmann suggested the decline in the 90+ day bucket was because of some successful modifications - since the lenders reported the loans as delinquent until the modification was made permanent.
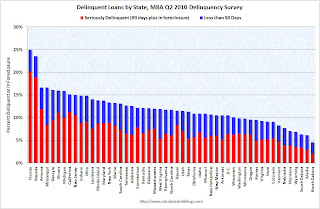 The second graph shows the delinquency rate by state (red is seriously delinquent: 90+ days or in foreclosure, blue is delinquent less than 90 days).
 Clearly Florida and Nevada have a large percentage of loans delinquent or in foreclosure. But the delinquency problem is widespread with 36 states and D.C. all having total delinquency rates above 10%.
With house prices falling - and growth slowing - the delinquency rate will probably increase later this year.
 Here is my post CoreLogic: 11 Million U.S. Properties with Negative Equity in Q2
This graph shows the negative equity and near negative equity by state.
Although Nevada, Arizona, Florida, Michigan and California, have the largest percentage of homeowners underwater, there is a negative equity problem in most states. In 33 states and the D.C., 10 percent or more of homeowners with mortgages have negative equity.
Best wishes to all.
Saturday, August 28, 2010
"Muddling through ... the prescription of the moment"
by Calculated Risk on 8/28/2010 10:31:00 PM
A couple of earlier post that might be of interest:
From Peter Goodman at the NY Times: What Can Be Done to Cure the Ailing Economy?
THE American economy is once again tilting toward danger. ..."Muddling through" and "hoping that things somehow get better" seems very defeatist - but I think it is an apt characterization of the current situation. There is always more that can be done ... and I think some people are confusing cyclical deficits with structural deficits. Oh well ...
Yet even as vital signs weaken ... a sense has taken hold that government policy makers cannot deliver meaningful intervention. That is because nearly any proposed curative could risk adding to the national debt — a political nonstarter. The situation has left American fortunes pinned to an uncertain remedy: hoping that things somehow get better.
...
The growing impression of a weakening economy combined with a dearth of policy options has reinvigorated concerns that the United States risks sinking into the sort of economic stagnation that captured Japan during its so-called Lost Decade in the 1990s.
...
Six months ago, Alan Blinder, a former vice chairman of the Federal Reserve, and now an economist at Princeton, dismissed the idea that America’s political system would ever allow the country to sink into a Japan-style quagmire. “Now I’m looking at the political system turning itself into a paralyzed beast,” he says, adding that a lost decade now looms as “a much bigger risk.”
...
By default, muddling through has emerged as the prescription of the moment.
Petruno: Time to let home prices fall?
by Calculated Risk on 8/28/2010 06:01:00 PM
From Tom Petruno at the LA Times: Time to let home prices fall?
A few excerpts:
[A] grim reality has set in: Despite the still-rich basket of tax breaks for residential property owners, and the lowest mortgage rates in a generation, the pool of willing or able buyers is dwindling. [CR note: These are the lowest mortgage rates in far more than a generation - these are the lowest since at least the '50s if not even longer. Freddie Mac's surveys only go back to 1971.]Supporting house prices has helped the banks, but I think the idea was generally flawed. The key to the housing market is to absorb the excess inventory. That means more households and fewer new housing units. Luckily housing starts are very low right now, but unfortunately there is very little job growth (and therefore little new household formation).
...
Government policy has been aimed at slowing or stopping the decline in prices, for obvious reasons: A further drop in home values would push more owners underwater, meaning their homes would be worth less than their mortgage balance.
...
Dean Baker, co-director of the Center for Economic Policy and Research in Washington, believes home prices still are overvalued by 15% to 20% in many areas.
For government to stand in the way of a further price decline is unfair to the next generation of buyers, he said. "The people who get hurt the most are those who are overpaying for houses today," he said.
Robert Shiller, co-creator of the S&P/Case-Shiller price indexes, said that although he doesn't forecast prices, "I think the scenario of declining home prices for years to come is underemphasized by people."
Petruno quotes NAHB economist David Crowe:
Historically, housing has led the way in recoveries. "But this is a case where housing is going to follow the economy, not lead it," [said David Crowe, chief economist for the National Assn. of Home Builders].This is correct. Usually housing is a key engine of recovery, especially for jobs. But this time housing is going to follow the economy.
That means policy needs to be aimed at making sure that many existing households stay in place (like unemployment benefits, although I'd prefer something along the lines of Minsky's approach) and trying to add new jobs (like infrastructure jobs). More jobs mean more households. More households will absorb the excess inventory. And then eventually housing will recover and help the economy.
Let house prices fall.
Employment Report Preview: Will the unemployment rate spike higher?
by Calculated Risk on 8/28/2010 01:05:00 PM
The August employment report will be released next Friday, Sept 3rd. The consensus is for the loss of around 90,000 payroll jobs, and an increase in the unemployment rate to 9.6% (from 9.5% in July).
The decennial Census will subtract about 116,000 payroll jobs in August (estimate here), so the consensus is for about +26,000 payroll jobs ex-Census.
I will take the under on the number of payroll jobs. I think it is possible that we will see a negative payroll number, ex-Census, because of weak private hiring combined with state and local layoffs.
And I will also take the over on the unemployment rate. Here is why:
The unemployment rate is from the household survey, and is impacted by the participation rate - the percent of the civilian population in the labor force. The following graph shows the sharp decline in the participation rate during the current employment recession.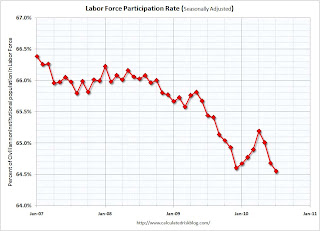 Click on graph for larger image in new window.
Note: y-axis starts at 64% to show the change.
The increase in the participation rate earlier this year was good news. This meant some workers who had given up were rejoining the labor force. The increase in the participation rate pushed up the unemployment rate, since the economy wasn't adding jobs fast enough to employ all the workers rejoining the labor force. But it was still good news that the participation rate was increasing.
However it was bad news when the participation rate started falling again over the last few months. The decline in the unemployment rate - from 9.9% in April to 9.5% in June and July - was related to the decline in the participation rate. And workers leaving the labor force is not great news.
But what will happen to the participation rate in August? The first guess, with the weak economy, is that the participation rate declined further in August, putting downward pressure on the unemployment rate.
But there are two reasons I think the participation rate might have increased.
Summer teen employment: As I noted in June, the record low number of teens joining the labor force appeared to push down the seasonally adjusted participation rate (and therefore pushed down the unemployment rate). I think this will start to unwind in August. As a lower than normal number of teens leave the labor force, the seasonally adjusted teen labor force will probably increase - my guess is by 100,000 to 150,000 workers. All else being equal, this would push up the participation rate, and also push up the unemployment rate to around 9.6%.
Unemployment Benefits: At the end of July, the qualification dates for the various tiers of Federal unemployment benefits were extended through November 30th. This extension was also made retroactive to June 2nd. Some people who have given up, might rejoin the labor force to collect additional benefits. If this happens, the participation rate might increase in August - and that would push up the unemployment rate. Although the number is uncertain, if 250,000 workers rejoin the labor force to collect benefits that would push the unemployment rate to 9.7%. If 500,000 workers rejoin the labor force, plus the 125,000 from the teen adjustment, the unemployment rate would increase to around 9.9%.
As noted above, the weak economy would normally lead to a lower participation rate, but these two reasons might push the participation rate up - and that could mean a higher than expected increase in the unemployment rate.
Unofficial Problem Bank List increases to 840 institutions
by Calculated Risk on 8/28/2010 08:44:00 AM
Note: this is an unofficial list of Problem Banks compiled only from public sources.
Here is the unofficial problem bank list for August 27, 2010.
Changes and comments from surferdude808:
The Unofficial Problem Bank List grew by more than five percent this week as the FDIC released its enforcement actions for July 2010. This week, there were 28 additions and 5 removals. Also, the list was updated to reflect assets as of the second quarter. For institutions on the list since the first quarter, aggregate assets declined by $13.9 billion. With these changes, the Unofficial Problem Bank List includes 840 institutions with aggregate assets of $410.3 billion.
Removals include First National Bank and Trust of Syracuse ($58 million), Town Center Bank ($40 million), and Peoples State Bank ($26 million), which were involved in unassisted mergers during July. Other removals from action termination include Independence Bank ($352 million) and Darien Rowayton Bank ($107 million).
Among the 28 additions are TIB Bank, Naples, FL ($1.7 billion); CB&S Bank, Inc., Russellville, AL ($1.3 billion); First Bank and Trust, New Orleans, LA ($944 million); Citizens Bank of Mukwonago, Mukwonago, WI ($627 million); and First Chatham Bank, Savannah, GA ($596 million). Geographically, the additions include 5 institutions from Illinois, 4 from Florida, and 3 from Minnesota.
Next week, the FDIC likely will release the Official Problem Bank List as of June 30th.
Friday, August 27, 2010
Jim the Realtor: "Good time to be a looker"
by Calculated Risk on 8/27/2010 08:20:00 PM
Prices are falling ... and Jim the Realtor says: "You won’t hear me say it’s a great time to buy, but ... it’s a great time to look.”
U.S. Births decline in 2009
by Calculated Risk on 8/27/2010 04:03:00 PM
From the National Center for Health Statistics: Births, Marriages, Divorces, and Deaths: Provisional Data for 2009
The NCHS reports that U.S. births declined to 4.136 million in 2009, from 4.247 million in 2008. The birth rate declined to 13.5 from 13.9 in 2008 (births per 1000 total population).
Here is a long term graph of annual U.S. births through 2009 ... Click on graph for larger image in new window.
Births have declined for two consecutive years, and are now 4.2% below the peak in 2007. I suspect certain segments of the population were under stress before the recession started - like construction workers - and even more families were in distress in 2008 and 2009. Of course it takes 9 months to have a baby, so families in distress in 2009 probably put off having babies in 2010 too.
Notice that the number of births started declining a number of years before the Great Depression started. Many families in the 1920s were under severe stress long before the economy collapsed. By 1933 births were down by almost 23% from the early '20s levels.
Of course economic distress isn't the only reason births decline - look at the huge decline following the baby boom that was driven by demographics. But it is common for births to slow or decline during tough economic times in the U.S. - and that appears to be happening now.
Last year I guessed that we'd see further declines in births in 2009 (now confirmed) and probably in 2010. But I don't think the declines in births will be anything like what happened during the 1920s.
Estimate of Decennial Census impact on August payroll employment: minus 116,000
by Calculated Risk on 8/27/2010 12:49:00 PM
The Census Bureau released the weekly payroll data for the week ending August 14th this week (ht Bob_in_MA). If we subtract the number of temporary 2010 Census workers in the week containing the 12th of the month, from the same week for the previous month - this provides a close estimate for the impact of the Census hiring on payroll employment.
The Census Bureau releases the actual number with the employment report. 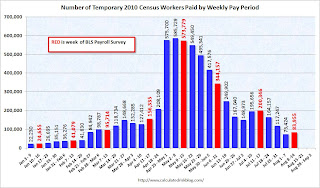 Click on graph for larger image in new window.
This graph shows the number of Census workers paid each week. The red labels are the weeks of the BLS payroll survey.
The Census payroll decreased from 200,346 for the week ending July 17th to 83,955 for the week ending August 14th.
So my estimate for the impact of the Census on August payroll employment is minus 116 thousand (this will probably be close). The employment report will be released on September 3rd, and the headline number for August - including Census numbers - will probably be negative again. But a key number will be the hiring ex-Census (so we will add back the Census workers again this month).
The following table compares the weekly payroll report estimate to the monthly BLS report on Census hiring (the weekly report is revised slightly, so the correlation looks better than in real time):
| Payroll, Weekly Pay Period | Payroll, Monthly BLS | Change based on weekly report | Actual Change (monthly) | |
|---|---|---|---|---|
| Jan | 25 | 24 | ||
| Feb | 41 | 39 | 16 | 15 |
| Mar | 96 | 87 | 55 | 48 |
| Apr | 156 | 154 | 61 | 67 |
| May | 574 | 564 | 418 | 410 |
| Jun | 344 | 339 | -230 | -225 |
| Jul | 200 | 196 | -144 | -143 |
| Aug | 84 | -116 | ||
| All thousands | ||||
Analysis: Bernanke paves the way for QE2
by Calculated Risk on 8/27/2010 11:22:00 AM
Just some quick thoughts on Fed Chairman Ben Bernanke's speech today.
For a sustained expansion to take hold, growth in private final demand--notably, consumer spending and business fixed investment--must ultimately take the lead. On the whole, in the United States, that critical handoff appears to be under way. ... the pace of that growth recently appears somewhat less vigorous than we expected. ... Incoming data on the labor market have remained disappointing. ... Overall, the incoming data suggest that the recovery of output and employment in the United States has slowed in recent months, to a pace somewhat weaker than most FOMC participants projected earlier this year. ... I expect the economy to continue to expand in the second half of this year, albeit at a relatively modest pace.
Despite the weaker data seen recently, the preconditions for a pickup in growth in 2011 appear to remain in place.
Under what conditions would the FOMC make further use of these or related policy tools? At this juncture, the Committee has not agreed on specific criteria or triggers for further action, but I can make two general observations.
First, the FOMC will strongly resist deviations from price stability in the downward direction. ... It is worthwhile to note that, if deflation risks were to increase, the benefit-cost tradeoffs of some of our policy tools could become significantly more favorable.
Second, regardless of the risks of deflation, the FOMC will do all that it can to ensure continuation of the economic recovery. Consistent with our mandate, the Federal Reserve is committed to promoting growth in employment and reducing resource slack more generally. Because a further significant weakening in the economic outlook would likely be associated with further disinflation, in the current environment there is little or no potential conflict between the goals of supporting growth and employment and of maintaining price stability.
A first option for providing additional monetary accommodation, if necessary, is to expand the Federal Reserve's holdings of longer-term securities. As I noted earlier, the evidence suggests that the Fed's earlier program of purchases was effective in bringing down term premiums and lowering the costs of borrowing in a number of private credit markets. I regard the program (which was significantly expanded in March 2009) as having made an important contribution to the economic stabilization and recovery that began in the spring of 2009. Likewise, the FOMC's recent decision to stabilize the Federal Reserve's securities holdings should promote financial conditions supportive of recovery.Bernanke was not as positive on changes to the "extended period" language or reducing the interest rate on excess reserves.
I believe that additional purchases of longer-term securities, should the FOMC choose to undertake them, would be effective in further easing financial conditions.
"Revenue is being affected by weaker than expected demand for consumer PCs in mature markets," the company said in a statement.Or perhaps the unemployment rate ticking up in the August employment report next Friday might be enough. There will be plenty of data released before the September 21 FOMC meeting (and if the data is weaker, the meeting might be expanded to two days). Or perhaps the FOMC will wait until November, but it does appears Bernanke is preparing everyone for QE2.
Bernanke: The Economic Outlook and Monetary Policy
by Calculated Risk on 8/27/2010 10:02:00 AM
From Fed Chairman Ben Bernanke: The Economic Outlook and Monetary Policy. Excerpt on monetary policy:
Policy Options for Further EasingPaving the way for QE2.
...
I will focus here on three that have been part of recent staff analyses and discussion at FOMC meetings: (1) conducting additional purchases of longer-term securities, (2) modifying the Committee's communication, and (3) reducing the interest paid on excess reserves. I will also comment on a fourth strategy, proposed by several economists--namely, that the FOMC increase its inflation goals.
A first option for providing additional monetary accommodation, if necessary, is to expand the Federal Reserve's holdings of longer-term securities. ...
A second policy option for the FOMC would be to ease financial conditions through its communication, for example, by modifying its post-meeting statement. ...
A third option for further monetary policy easing is to lower the rate of interest that the Fed pays banks on the reserves they hold with the Federal Reserve System. Inside the Fed this rate is known as the IOER rate, the "interest on excess reserves" rate. The IOER rate, currently set at 25 basis points, could be reduced to, say, 10 basis points or even to zero. ...
A rather different type of policy option, which has been proposed by a number of economists, would have the Committee increase its medium-term inflation goals above levels consistent with price stability. I see no support for this option on the FOMC.
Update: Bernanke also addressed WHEN the FOMC will act:
Each of the tools that the FOMC has available to provide further policy accommodation--including longer-term securities asset purchases, changes in communication, and reducing the IOER rate--has benefits and drawbacks, which must be appropriately balanced. Under what conditions would the FOMC make further use of these or related policy tools? At this juncture, the Committee has not agreed on specific criteria or triggers for further action, but I can make two general observations.
First, the FOMC will strongly resist deviations from price stability in the downward direction. Falling into deflation is not a significant risk for the United States at this time, but that is true in part because the public understands that the Federal Reserve will be vigilant and proactive in addressing significant further disinflation. It is worthwhile to note that, if deflation risks were to increase, the benefit-cost tradeoffs of some of our policy tools could become significantly more favorable.
Second, regardless of the risks of deflation, the FOMC will do all that it can to ensure continuation of the economic recovery. Consistent with our mandate, the Federal Reserve is committed to promoting growth in employment and reducing resource slack more generally. Because a further significant weakening in the economic outlook would likely be associated with further disinflation, in the current environment there is little or no potential conflict between the goals of supporting growth and employment and of maintaining price stability.
Q2 real GDP revised down to 1.6% annualized growth rate
by Calculated Risk on 8/27/2010 08:48:00 AM
From the BEA: Gross Domestic Product, 2nd quarter 2010 (second estimate)
The following table shows the changes from the advance release (this is the Contributions to Percent Change in Real Gross Domestic Product).
The largest downward revisions were to the change in private inventories, imports, and non-residential structure investment. Personal consumption expenditures and investment in Equipment and software were revised up.
| Advance | 2nd Estimate (Revision) | Change | |
|---|---|---|---|
| Percent change at annual rate: | |||
| Gross domestic product | 2.4 | 1.6 | -0.8 |
| Percentage points at annual rates: | |||
| Personal consumption expenditures | 1.15 | 1.38 | 0.23 |
| Goods | 0.79 | 0.82 | 0.03 |
| Durable goods | 0.53 | 0.49 | -0.04 |
| Nondurable goods | 0.25 | 0.33 | 0.08 |
| Services | 0.36 | 0.56 | 0.20 |
| Gross private domestic investment | 3.14 | 2.75 | -0.39 |
| Fixed investment | 2.09 | 2.12 | 0.03 |
| Nonresidential | 1.50 | 1.54 | 0.04 |
| Structures | 0.14 | 0.01 | -0.13 |
| Equipment and software | 1.36 | 1.53 | 0.17 |
| Residential | 0.59 | 0.58 | -0.01 |
| Change in private inventories | 1.05 | 0.63 | -0.42 |
| Net exports of goods and services | -2.78 | -3.37 | -0.59 |
| Exports | 1.22 | 1.08 | -0.14 |
| Imports | -4.00 | -4.45 | -0.45 |
| Government consumption expenditures and gross investment | 0.88 | 0.86 | -0.02 |
| Federal | 0.72 | 0.72 | 0.00 |
| National defense | 0.4 | 0.39 | -0.01 |
| Nondefense | 0.33 | 0.32 | -0.01 |
| State and local | 0.16 | 0.14 | -0.02 |
Thursday, August 26, 2010
Summary, Fannie-Freddie "Autopsy", and European Bond Spreads
by Calculated Risk on 8/26/2010 10:10:00 PM
Here’s a last-minute option for summer reading material: An autopsy on Fannie Mae and Freddie Mac by their overseer, the Federal Housing Finance Agency.
The report aims to inform the continuing debate in Washington about the future of the government’s role in housing finance. It’s not hard sledding, just 15 pages of bullet points and charts. And it does a good job of making a few key points:
1. Fannie and Freddie did not cause the housing bubble. ...
2. This was not for a lack of trying. ...
3. Importantly, the companies’ losses are mostly in their core business of guaranteeing loans, not in their investment portfolios.
 Click on graph for larger image in new window.
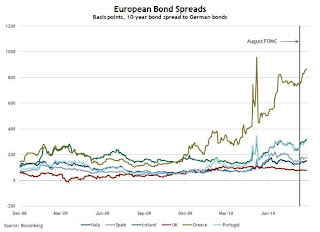
From the Atlanta Fed:
Peripheral European bond spreads (over German bonds) have risen since the August FOMC meeting.In fact the Greece-to-Germany, and the Ireland-to-Germany, bond spreads are near the levels reached during the May financial crisis.
The total percent of loans delinquent or in the foreclosure process declined only slightly in Q2 from Q1 - and the rate is the second highest on record.Loans 30 days delinquent increased to 3.51%, and this is about the same levels as in Q4 2008 (slightly below the peak of 3.77% in Q1 2009).
Delinquent loans decreased in all other buckets - especially in the 90+ day bucket. MBA Chief Economist Jay Brinkmann suggested the decline in the 90+ day bucket was because of some successful modifications - since the lenders reported the loans as delinquent until the modification was made permanent.
This graph shows the negative equity and near negative equity by state. Although the five states mentioned above have the largest percentage of homeowners underwater, 10 percent or more of homeowners with mortgages in 33 states and the D.C. have negative equity.
Are lenders "procrastinating" on foreclosures?
by Calculated Risk on 8/26/2010 07:13:00 PM
From Jeff Horwitz and Kate Berry at American Banker: Procrastination on Foreclosures, Now 'Blatant,' May Backfire
[S]ervicers are not initiating or processing foreclosures at the pace they could be.There is much more in the article.
By postponing the date at which they lock in losses, banks and other investors positioned themselves to benefit from the slow mending of the real estate market. But now industry executives are questioning whether delaying foreclosures — a strategy contrary to the industry adage that "the first loss is the best loss" — is about to backfire. With home prices expected to fall as much as 10% further, the refusal to foreclose quickly on and sell distressed homes at inventory-clearing prices may be contributing to the stall of the overall market seen in July sales data.
...
Banks have filed fewer notices of default so far this year in California ... than they did 2009 or 2008, according to data gathered by [RadarLogic]. Foreclosure default notices are now at their lowest level since the second quarter of 2007, when the percentage of seriously delinquent loans in the state was one-sixth what it is now.
New data from LPS Applied Analytics in Jacksonville, Fla., suggests that the backlog is no longer worsening nationally — but foreclosures are not at the levels needed to clear existing inventory.
...
"The industry as a whole got into a panic mode and was worried about all these loans going into foreclosure and driving prices down, so they got all these programs, started Hamp and internal mods and short sales," said John Marecki, vice president of East Coast foreclosure operations for Prommis Solutions ... "Now they're looking at this, how they held off and they're getting to the point where maybe they made a mistake in that realm."
...
"The math doesn't bode well for what is ultimately going to occur on the real estate market," said Herb Blecher, a vice president at LPS. "You start asking yourself the question when you look at these numbers whether we are fixing the problem or delaying the inevitable."
Note: The LPS delinquency data for July will be released tomorrow. Here are some of the findings (no link):
• July showed an astounding 24.5% month-over-month increase in foreclosure starts, which dovetails with Treasury's latest report on HAMP cancellations (approx. 50% according to Treasury's numbers)The report shows the GSEs are stepping up foreclosures.
• Abysmal foreclosure rates in NV, FL and CA have led to much higher level equity loss for homeowners in those states as compared to the rest of the country.
• Cure rates remain steady, but seriously delinquent (6 mos.+) cures have declined significantly, by approximately 25%
• Origination remains depressed due to much stricter underwriting guidelines and low purchase activity, but what is being originated is of good quality.
• Until the deterioration ratio improves from its steady two deteriorations for every one improvement, it's hard to see how we're going to get out of the hole.
CoreLogic: 11 Million U.S. Properties with Negative Equity in Q2
by Calculated Risk on 8/26/2010 03:32:00 PM
Note that the slight decline in homeowners with negative equity was mostly due to foreclosures.
First American CoreLogic released the Q2 2010 negative equity report today.
CoreLogic reports that 11 million, or 23 percent, of all residential properties with mortgages were in negative equity at the end of the second quarter of 2010, down from 11.2 million and 24 percent from the first quarter of 2010. Foreclosures, rather than meaningful price appreciation, were the primary driver in the change in negative equity. An additional 2.4 million borrowers had less than five percent equity. Together, negative equity and near negative equity mortgages accounted for nearly 28 percent of all residential properties with a mortgage nationwide.From the report:
...
"Negative equity continues to both drive foreclosures and impede the housing market recovery. With nearly 5 million borrowers currently in severe negative equity, defaults will remain at a high level for an extended period of time," said Mark Fleming, chief economist with CoreLogic.
Negative equity remains concentrated in five states: Nevada, which had the highest percentage negative equity with 68 percent of all of its mortgaged properties underwater, followed by Arizona (50 percent), Florida (46 percent), Michigan (38 percent) and California (33 percent). The declines were primarily due to foreclosures, not the stabilization or small increases in prices in some markets. The largest decrease in negative equity occurred among those with loan-to-value (LTV) ratios in excess of 125 percent, where the number of negative equity borrowers fell to 4.8 million, down from 5 million last quarter.
Click on image for larger graph in new window.This graph shows the negative equity and near negative equity by state.
Although the five states mentioned above have the largest percentage of homeowners underwater, 10 percent or more of homeowners with mortgages in 33 states and the D.C. have negative equity.
Note: Louisiana, Maine, Mississippi, South Dakota, Vermont, West Virginia and Wyoming are NA on the graph above.
CoreLogic also released a negative equity report for 164 metro areas (excel file) (with a minimum of 50,000 mortgages). Las Vegas is at the top with 72.8% of homeowners with mortgages in negative equity (another 3.3% are close) - and the top of the list is dominated by Nevada, California, Arizona and Florida - but it is amazing how widespread the problem is!
Even with foreclosures reducing the number of negative equity mortgages, I expect the number of homeowners with negative equity will increase as prices fall later this year.
MBA Q2 2010: 14.42% of Mortgage Loans Delinquent or in Foreclosure
by Calculated Risk on 8/26/2010 01:30:00 PM
The MBA reports that 14.42 percent of mortgage loans were either one payment delinquent or in the foreclosure process in Q2 2010 (seasonally adjusted). This is down slightly from the record 14.69 percent in Q1 2010.
From the MBA: Delinquencies and Foreclosure Starts Decrease in Latest MBA National Delinquency Survey
The delinquency rate for mortgage loans on one-to-four-unit residential properties dropped to a seasonally adjusted rate of 9.85 percent of all loans outstanding as of the end of the second quarter of 2010, a decrease of 21 basis points from the first quarter of 2010, and an increase of 61 basis points from one year ago, according to the Mortgage Bankers Association’s (MBA) National Delinquency Survey.Note: 9.85% (SA) and 4.57% equals 14.42%.
...
The percentage of loans in the foreclosure process at the end of the second quarter was 4.57 percent, a decrease of six basis points from the first quarter of 2010, but an increase of 27 basis points from one year ago.
Much was made at the end of 2009 about the decline in the 30 day delinquency "bucket" (percent of loans between 30 and 60 days delinquent). Unfortunately the seasonally adjusted 30 day delinquency rate increased again in Q2 2010.
And much was made on the conference call this morning about the declines in the other "buckets", however the total percent of loans delinquent or in the foreclosure process declined only slightly in Q2 from Q1 - and is the second highest on record.
Note: there are some questions about the seasonal adjustment, especially for the 90 day bucket since we've never seen numbers this high before, but the adjustment for the 30 and 60 day periods are probably reasonable.
Click on graph for larger image in new window.Loans 30 days delinquent increased to 3.51%, and this is about the same levels as in Q4 2008 (slightly below the peak of 3.77% in Q1 2009).
Delinquent loans decreased in all other buckets - especially in the 90+ day bucket. MBA Chief Economist Jay Brinkmann suggested the decline in the 90+ day bucket was because of some successful modifications - since the lenders reported the loans as delinquent until the modification was made permanent.
The second graph shows the delinquency rate by state (red is seriously delinquent: 90+ days or in foreclosure, blue is delinquent less than 90 days). Clearly Florida and Nevada have a large percentage of loans delinquent or in foreclosure. But the delinquency problem is widespread with 36 states and D.C. all having total delinquency rates above 10%.
When asked if he expected the slight improvements to continue, Brinkmann said "Improvements are more of a hope". He said the problem is jobs, and he is revising down his economic forecasts. He also the improvement in the 90+ day bucket might be because of modifications - and that might not continue.
With house prices falling - and growth slowing - the delinquency rate will probably increase later this year.
Kansas City Fed: Manufacturing activity slowed in August
by Calculated Risk on 8/26/2010 11:25:00 AM
Usually I don't post all the regional manufacturing surveys, but it appears manfuacturing is slowing right now - and the regional surveys provide early clues ...
From the Kansas City Fed:
Tenth District manufacturing activity slowed in August, and producers were somewhat less optimistic than in previous months.This is the lowest level for the Kansas City survey since August 2009.
...
The net percentage of firms reporting month-over-month increases in production in August was 0, down from 14 in July ... The shipments, new orders, and employment indexes dropped into negative territory, and the order backlog index slipped from -2 to -16.
Yesterday I compared the ISM PMI (to be released next week) with the regional Fed surveys, and based on these surveys, I expect the PMI to fall further in August.
Note on MBA: I'll post analysis of the MBA Q2 delinquency data after I receive the material (some sort of glitch this morning).
MBA Q2 National Delinquency Survey Conference Call
by Calculated Risk on 8/26/2010 11:06:00 AM
On the MBA conference call concerning the "Q2 2010 National Delinquency Survey", MBA Chief Economist Jay Brinkmann said this morning:
From MarketWatch: Foreclosure inventory down, new delinquencies up
The percentage of mortgage loans somewhere in the foreclosure process was 4.57% in the second quarter, down from 4.63% in the first quarter; the percentage is still up from 4.3% a year ago. However, the percent of loans one payment behind is now a seasonally adjusted 3.51%, said Jay Brinkmann, the MBA's chief economistNote: I have not received the press release or materials. Hopefully I'll have more later today.


