 RSS Feed
 by Calculated Risk on 8/29/2010 07:24:00 AM
Sunday, August 29, 2010
Summary for Week ending August 28th
It was a busy week ...
The NAR reported:
Existing-home sales, which are completed transactions that include single-family, townhomes, condominiums and co-ops, dropped 27.2 percent to a seasonally adjusted annual rate of 3.83 million units in July from a downwardly revised 5.26 million in June, and are 25.5 percent below the 5.14 million-unit level in July 2009.
...
Total housing inventory at the end of July increased 2.5 percent to 3.98 million existing homes available for sale, which represents a 12.5-month supply at the current sales pace, up from an 8.9-month supply in June.
 Click on graph for larger image in new window.
This graph shows existing home sales, on a Seasonally Adjusted Annual Rate (SAAR) basis since 1993.
Sales in July 2010 (3.83 million SAAR) were 27.2% lower than last month, and were 25.5% lower than July 2009 (5.14 million SAAR).
The next graph shows the year-over-year (YoY) change in reported existing home inventory and months-of-supply. Inventory is not seasonally adjusted, so it really helps to look at the YoY change.
 Although inventory increased from June 2010 to July 2010, inventory decreased 1.9% YoY in July. The slight year-over-year decline is probably because some sellers put their homes on the market in the Spring hoping to take advantage of the home buyer tax credit.
 Note: Usually July is the peak month for inventory.
A normal housing market usually has under 6 months of supply. The following graph shows the relationship between supply and house prices (using Case-Shiller).
 This graph show months of supply (through July 2010) and the annualized change in the Case-Shiller Composite 20 house price index (through May 2010).
Below 6 months of supply (blue line) house prices are typically rising (black line).
Above 6 or 7 months of supply, house prices are usually falling. This isn't perfect - it is just a guideline. This is a key reason why I expect house prices to fall further later this year as measured by the Case-Shiller and CoreLogic repeat sales house price indexes.
 The Census Bureau reports New Home Sales in July were at a seasonally adjusted annual rate (SAAR) of 276 thousand. This is an decrease from the record low of 315 thousand in June (revised down from 330 thousand).
This graph shows New Home Sales vs. recessions for the last 47 years.
And another long term graph - this one for New Home Months of Supply.
 Months of supply increased to 9.1 in July from 8.0 in June. The all time record was 12.4 months of supply in January 2009. This is still very high (less than 6 months supply is normal).
 The 276 thousand annual sales rate for July is the all time record low (May was revised up a little). This was another very weak report. New home sales are important for the economy and jobs - and this indicates that residential investment will be a sharp drag on GDP in Q3.
Here is my post on the MBA Q2 delinquency report: 14.42% of Mortgage Loans Delinquent or in Foreclosure . This graph (from the earlier post) shows the delinquency rate by "bucket" (30 days, 60 days, 90+ days, and in foreclosure process):
 The total percent of loans delinquent or in the foreclosure process declined only slightly in Q2 from Q1 - and the rate is the second highest on record.
Loans 30 days delinquent increased to 3.51%, and this is about the same levels as in Q4 2008 (slightly below the peak of 3.77% in Q1 2009).
Delinquent loans decreased in all other buckets - especially in the 90+ day bucket. MBA Chief Economist Jay Brinkmann suggested the decline in the 90+ day bucket was because of some successful modifications - since the lenders reported the loans as delinquent until the modification was made permanent.
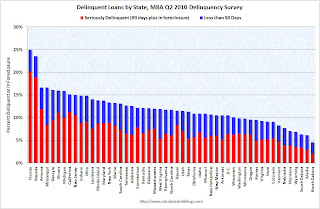 The second graph shows the delinquency rate by state (red is seriously delinquent: 90+ days or in foreclosure, blue is delinquent less than 90 days).
 Clearly Florida and Nevada have a large percentage of loans delinquent or in foreclosure. But the delinquency problem is widespread with 36 states and D.C. all having total delinquency rates above 10%.
With house prices falling - and growth slowing - the delinquency rate will probably increase later this year.
 Here is my post CoreLogic: 11 Million U.S. Properties with Negative Equity in Q2
This graph shows the negative equity and near negative equity by state.
Although Nevada, Arizona, Florida, Michigan and California, have the largest percentage of homeowners underwater, there is a negative equity problem in most states. In 33 states and the D.C., 10 percent or more of homeowners with mortgages have negative equity.
Best wishes to all.


