 RSS Feed
 by Calculated Risk on 8/31/2010 09:00:00 AM
Tuesday, August 31, 2010
Case-Shiller: Home Price indices increase in June
IMPORTANT: These graphs are Seasonally Adjusted (SA). S&P has cautioned that the seasonal adjustment is probably being distorted by irregular factors. These distortions could include distressed sales and the various government programs.
S&P/Case-Shiller released the monthly Home Price Indices for June (actually a 3 month average of April, May and June).
This includes prices for 20 individual cities, and two composite indices (10 cities and 20 cities) and the quarterly national index.
From S&P: For the Past Year Home Prices Have Generally Moved Sideways
Data through June 2010, released today by Standard & Poor’s for its S&P/Case-Shiller Home Price Indices, the leading measure of U.S. home prices, show that the U.S. National Home Price Index rose 4.4% in the second quarter of 2010, after having fallen 2.8% in the first quarter. Nationally, home prices are 3.6% above their year-earlier levels. In June, 17 of the 20 MSAs covered by S&P/Case-Shiller Home Price Indices and both monthly composites were up; and the two composites and 15 MSAs showed year-over-year gains. Housing prices have rebounded from crisis lows, but other recent housing indicators point to more ominous signals as tax incentives have ended and foreclosures continue.
 Click on graph for larger image in new window.
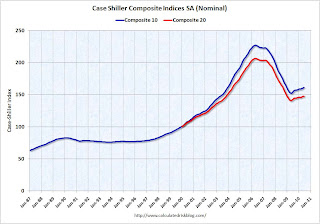
 The first graph shows the nominal seasonally adjusted Composite 10 and Composite 20 indices (the Composite 20 was started in January 2000).
The Composite 10 index is off 29.0% from the peak, and up 0.3% in June (SA).
The Composite 20 index is off 28.4% from the peak, and up 0.3% in June (SA).
 The second graph shows the Year over year change in both indices.
The Composite 10 is up 5.0% compared to June 2009.
The Composite 20 is up 4.2% compared to June 2009.
This is the fifth month with YoY price increases in a row.
The third graph shows the price declines from the peak for each city included in S&P/Case-Shiller indices.
 Prices increased (SA) in 9 of the 20 Case-Shiller cities in June seasonally adjusted.
Prices in Las Vegas are off 56.5% from the peak, and prices in Dallas only off 4.8% from the peak.
Prices are probably falling right now (starting in July), but this will not show up in the Case-Shiller index for a few months since this an average of three months.


