 RSS Feed
 by Calculated Risk on 1/30/2012 08:32:00 AM
Monday, January 30, 2012
Personal Income increased 0.5% in December, Spending decreased slightly
The BEA released the Personal Income and Outlays report for December:
Personal income increased $61.3 billion, or 0.5 percent ... in December, according to the Bureau of Economic Analysis. Personal consumption expenditures (PCE) decreased $2.0 billion, or less than 0.1 percent.The following graph shows real Personal Consumption Expenditures (PCE) through December (2005 dollars). Note that the y-axis doesn't start at zero to better show the change.
...
Real PCE -- PCE adjusted to remove price changes -- decreased 0.1 percent in December ... PCE price index -- The price index for PCE increased 0.1 percent in December, in contrast to a decrease of less than 0.1 percent in
November. The PCE price index, excluding food and energy, increased 0.2 percent, compared with an increase of 0.1 percent.
 Click on graph for larger image.
PCE decreased less than 0.1% in December, and real PCE decreased 0.1%.
Note: The PCE price index, excluding food and energy, increased 0.2 percent.
The personal saving rate was at 4.0% in December.
Not much of an increase in PCE since October.
Sunday, January 29, 2012
European Leaders: Austerity alone not answer
by Calculated Risk on 1/29/2012 07:28:00 PM
The European Union leaders meet in Brussels tomorrow and there is a growing recognition that austerity alone will not work. From the NY Times: E.U. Leaders Set to Admit Austerity Is Not Enough
European leaders are expected to conclude this week that what the debt-laden, sclerotic countries of the Continent need are a dose of economic growth.And on Greece from the NY Times: Greek Coalition Partners to Back New Reforms
...
A draft of the European Union summit meeting communiqué calls for ‘‘growth-friendly consolidation and job-friendly growth,’’ an indication that European leaders have come to realize that austerity measures, like those being put in countries like Greece and Italy, risk stoking a recession and plunging fragile economies into a downward spiral.
As Greece tries to reach a debt-swap agreement with its private creditors, the country’s prime minister suggested on Sunday that the three leaders in his fractious coalition were prepared to back additional austerity measures and reforms needed to receive a second bailout.Prime Minister Lucas Papademos is in the middle of a three ring circus negotiating with private creditors, negotiating with the "troika" (European Union, ECB, IMF), and negotiating with the various political parties in Greece.
Yesterday:
• Summary for Week Ending January 27th
• Schedule for Week of Jan 29th
Existing Home Inventory declines 17% year-over-year in January
by Calculated Risk on 1/29/2012 02:11:00 PM
Another update: I've been using inventory numbers from HousingTracker / DeptofNumbers to track changes in inventory. Tom Lawler mentioned this last year.
According to the deptofnumbers.com for monthly inventory (54 metro areas), listed inventory is probably back to early 2005 levels. Unfortunately the deptofnumbers only started tracking inventory in April 2006.
This graph shows the NAR estimate of existing home inventory through December (left axis) and the HousingTracker data for the 54 metro areas through January.
 Click on graph for larger image.
Since the NAR released their revisions for sales and inventory, the NAR and HousingTracker inventory numbers are tracking pretty well.
Seasonally, housing inventory usually bottoms in December and January and then starts to increase again in February. So inventory should increase over the next 6+ months.
The second graph shows the year-over-year change in inventory for both the NAR and HousingTracker.
 HousingTracker reported that the January listings - for the 54 metro areas - declined 17% from the same month last year. The year-over-year decline will probably start to slow since listed inventory is getting close to normal levels. Also if there is an increase in foreclosures (as expected), this will give some boost to listed inventory.
This is just inventory listed for sale, sometimes referred to as "visible inventory". There is also a large "shadow inventory" that is currently not on the market, but is expected to be listed in the next few years. Shadow inventory could include bank owned properties (REO: Real Estate Owned), properties in the foreclosure process, other properties with delinquent mortgages (both serious delinquencies of over 90+ days, and less serious), condos that were converted to apartments (and will be converted back), investor owned rental properties, and homeowners "waiting for a better market", and a few other categories - as long as the properties are not currently listed for sale. Some of this "shadow inventory" will be forced on the market, such as completed foreclosures, but most of these sellers will probably wait for a "better market".
However listed inventory has clearly declined in many areas. And it is the listed months-of-supply (currently 6.2 months) combined with the number of distressed sales that mostly impacts prices.
Yesterday:
• Summary for Week Ending January 27th
• Schedule for Week of Jan 29th
Mortgage Settlement and New Investigation
by Calculated Risk on 1/29/2012 11:15:00 AM
Last week President Obama announced a new task force to investigate abuses related to the origination and securitization of mortgages during the housing bubble: "I am asking my Attorney General to create a special unit of federal prosecutors and leading state attorneys general to expand our investigations into the abusive lending and packaging of risky mortgages that led to the housing crisis."
Some people have argued that his will derail the proposed mortgage settlement.
Even though Eric Schneiderman, the New York attorney general will be a co-chair, it sounds like this will be a federal investigation and will be focused on origination and securtization abuses.
Loren Berlin at the HuffPo noted:
Senior officials at the Department of Justice were quick to emphasize that the fate of the settlement talks is unrelated to the new unit. "We have certainly heard criticisms that the settlement would give immunity for all [the mortgage-related misconduct], but that's simply not true ...This [unit] is addressing a very different problem than the servicing settlement," said one official.I've seen several commentaries that lump servicing and origination abuses together. Obviously the banks wanted broad immunity in any mortgage settlement, and the state attorneys general wanted narrower releases.
According to reports about the mortgage settlement, the banks would be released from claims brought by the states and the federal government for servicing and foreclosure abuses, but injured homeowners could still bring legal action.
And the states (but not the federal government) would release the banks from origination claims. Note: I could have the details wrong, but that is what has been reported.
Since the new task force is a federal investigation, my guess is this is intended to address complaints from some attorneys general about origination and securitization, since the states were being asked to release the banks on origination claims. So this new investigation doesn't sound like it will derail the mortgage servicer settlement - it might even lead to more states joining the settlement (although the banks may not like it).
Saturday, January 28, 2012
Europe Update: Greece nears debt deal
by Calculated Risk on 1/28/2012 08:43:00 PM
The European Union leaders meet in Brussels on Monday, and two key topics will be a "re-focus on growth and job creation"1 and Greece. Even if a deal is reached on the debt - and enough bondholders can be persuaded to participate - Greece still needs to come to terms on the next round of financing.
1Quote from European Council President Herman Van Rompuy.
From the WSJ: Greek Debt Deal, New Loan Agreement to Finish Next Week
Greece and its private sector creditors said Saturday they were on the verge of a deal to write off €100 billion ($132 billion) worth of the country's debt, pending the outcome of separate talks on a new, multi-billion euro bailout for Athens.From the NY Times: Greek Debt Talks Again Seem to Be on the Verge of a Deal
...
Effectively, the focus now shifts to a European summit in Brussels Monday where the continent's leaders will sanctify -- or not -- the terms of the debt restructuring and the new loan. But complicating those discussions are concerns that Greece's funding needs might be bigger than originally thought ...
[C]reditors now seem willing to accept a rate below 4 percent for the 30-year bonds — perhaps as low as 3.6 percent. ... Officials from the three institutions that are keeping the near-bankrupt nation financially afloat — the European Commission, the monetary fund and the European Central Bank — are demanding another round of spending cuts and reforms to justify a release of as much as 30 billion euros ($39 billion) in the months ahead.Here are a few key dates in Europe:
Jan 30th: European Union leaders meet in Brussels on debt crisis.
Feb 9th: ECB holds rate meeting.
Feb 20th: Euro-area finance ministers meet in Brussels.
Feb 29th to March 1st: Italy redeems 46.5 billion euros of bonds.
March 1st and 2nd: EU leaders meet in Brussels.
March 8th: ECB holds rate meeting
March 12th: Euro-area finance ministers meet in Brussels
March 20th: Greece redeems 14.4 billion euros of bonds.
March 30th: Euro-area finance ministers meet in Copenhagen.
Late April: Proposed date for Greek general election.
April 22nd: France election.
Earlier:
• Summary for Week Ending January 27th
• Schedule for Week of Jan 29th
Unofficial Problem Bank list declines to 958 Institutions
by Calculated Risk on 1/28/2012 04:29:00 PM
This is an unofficial list of Problem Banks compiled only from public sources.
Here is the unofficial problem bank list for Jan 27, 2012. (table is sortable by assets, state, etc.)
Changes and comments from surferdude808:
Busy week with many changes to the Unofficial Problem Bank List as the FDIC released its enforcement action activity for December 2011 and they closed several banks. In total, there were 11 removals and six additions, which leave the list with 958 institutions with assets of $389.0 billion. A year ago, there were 949 institutions with assets of $410.9 billion on the list. For the month of January 2012, changes to the list were nine cures, six failures, four unassisted mergers, one voluntary liquidation, and eight additions. The list fell by 12 institutions during the current month and it is the seventh consecutive monthly decline after the list peaked on a month-end basis at 1,001 institutions in June 2011.Earlier:
The FDIC terminated actions against Open Bank, Los Angeles, CA ($136 million Ticker: OPBK); Citizens Bank & Trust Company, Covington, LA ($110 million); First Security Bank & Trust Company, Norton, KS ($63 million); and West One Bank, Kalispell, MT ($44 million). Three banks were removed as they were acquired through unassisted deals including Ravalli County Bank, Hamilton, MT ($187 million); First State Bank of Red Bud, Red Bud, IL ($94 million); and Griffith Savings Bank, Griffith, IN ($89 million), which was acquired by United Federal Credit Union in the reportedly first successful acquisition of a commercial bank by a federally chartered credit union.
The FDIC stepped up its closing activities this week with four closures. The last time the FDIC closed this many banks in a week was on October 21, 2011. Failures include Tennessee Commerce Bank, Franklin, TN ($1.2 billion Ticker: TNCC); First Guaranty Bank and Trust Company of Jacksonville, Jacksonville, FL ($378 million); BankEast, Knoxville, TN ($273 million); and Patriot Bank Minnesota, Forest Lake, MN ($111 million). The failures in Tennessee are the first in that state since the on-set of the financial crisis. Conspicuously, the state stood out for not having yet experienced a failure. Ironically, the banking trade publication American Banker had an article today that questioned how much longer the state could remain failure free and said several lawyers thought the state banking commissioner wanted to avoid failures. While avoiding failures is laudable; however, some may say the delay in closing leads to higher resolution costs. As a share of their assets, the FDIC estimates the resolution of Tennessee Commerce Bank will cost 35.2% and BankEast 27.7%. Perhaps the reluctance for closings as mentioned in the article contributed to the high resolution costs of these banks.
The additions this week include Colorado East Bank & Trust, Lamar, CO ($829 million); Chambers Bank, Danville, AR ($722 million); American Gateway Bank, Port Allen, LA ($434 million); Pacific International Bank, Seattle, WA ($250 million Ticker: PIBW); Prairie Community Bank, Marengo, IL ($128 million); and Woodland Bank, Deer River, MN ($108 million).
The FDIC issued Prompt Corrective Action Orders against Mile High Banks, Longmont, CO ($1.0 billion) and Waukegan Savings Bank, Waukegan, IL ($88 million). Also, the FDIC issued an order terminating the deposit insurance of Fireside Bank, Pleasanton, CA ($278 million). Usually a chartering authority does not allow an institution to operate very long after receiving a deposit insurance termination order. Under a deposit insurance termination order, existing deposits eligible for insurance are covered for two years but any new deposits are not covered.
• Summary for Week Ending January 27th
• Schedule for Week of Jan 29th
Schedule for Week of Jan 29th
by Calculated Risk on 1/28/2012 01:07:00 PM
Earlier:
• Summary for Week Ending January 27th
This will be a very busy week for economic releases. The key report is the January employment report to be released on Friday, Feb 3rd. Other key reports include the Case-Shiller house price index on Tuesday, the ISM manufacturing index on Wednesday, vehicle sales on Wednesday, and the ISM non-manufacturing (service) index on Friday.
On Thursday, Fed Chairman Ben Bernanke provides testimony to Congress on the economic outlook.
8:30 AM ET: Personal Income and Outlays for December. The consensus is for a 0.4% increase in personal income in December, and a 0.1% increase in personal spending, and for the Core PCE price index to increase 0.1%.
10:30 AM: Dallas Fed Manufacturing Survey for January. The consensus is for expansion of 1.0 from contraction of -1.3 in December. This is the last of the regional Fed manufacturing surveys for January, and the other surveys have shown stronger expansion in January.
2:00 PM: The January 2011 Senior Loan Officer Opinion Survey on Bank Lending Practices from the Federal Reserve.
 9:00 AM: S&P/Case-Shiller House Price Index for November. Although this is the November report, it is really a 3 month average of September, October and November.
 This graph shows the nominal seasonally adjusted Composite 10 and Composite 20 indexes (the Composite 20 was started in January 2000).
The consensus is for a 0.4% decrease in prices in November. I expect a larger decline NSA, and a decline of 0.1% to 0.2% seasonally adjusted. The CoreLogic index declined 1.4% decrease in November (NSA).
9:45 AM: Chicago Purchasing Managers Index for January. The consensus is for an increase to 63.0, up from 62.5 in December.
10:00 AM: Conference Board's consumer confidence index for January. The consensus is for an increase to 68.0 from 64.5 last month.
10:00 AM: Q4 Housing Vacancies and Homeownership report from the Census Bureau. As a reminder: Be careful with the Housing Vacancies and Homeownership report. This report is frequently mentioned by analysts and the media to track the homeownership rate, and the homeowner and rental vacancy rates. Unfortunately the report is based on a fairly small sample, and does not track the decennial Census data.
7:00 AM: The Mortgage Bankers Association (MBA) will release the mortgage purchase applications index. This index was especially weak last year, although this does not include all the cash buyers.
8:15 AM: The ADP Employment Report for January. This report is for private payrolls only (no government). The consensus is for 172,000 payroll jobs added in January, down from the 325,000 reported last month.
10:00 AM: Construction Spending for December. The consensus is for a 0.5% increase in construction spending.
 10:00 AM ET: ISM Manufacturing Index for January.
 Here is a long term graph of the ISM manufacturing index. The consensus is for a slight increase to 54.5 from 53.9 in December.
All day: Light vehicle sales for January. Light vehicle sales are expected to increase to 13.6 million from 13.5 million in December (Seasonally Adjusted Annual Rate).
 This graph shows light vehicle sales since the BEA started keeping data in 1967. The dashed line is the December sales rate.
 Edmunds is forecasting:
[A] projected Seasonally Adjusted Annual Rate (SAAR) of 13.4 million units, forecasts Edmunds.com ... This sales pace is relatively flat from the 13.5 million SAAR recorded last month, but up from the 12.6 million SAAR from January 2011.And TrueCar is forecasting:
The January 2012 forecast translates into a Seasonally Adjusted Annualized Rate (SAAR) of 13.6 million new car sales, up from 12.7 million in January 2011Expected: National Multi Housing Council (NMHC) Quarterly Apartment Survey. This is a key survey for apartment vacancy rates and rents.
8:30 AM: The initial weekly unemployment claims report will be released. The consensus is for a dencrease to 370,000 from 377,000 last week.
10:00 AM: Testimony from Fed Chairman Ben Bernanke, "The Economic Outlook and the Federal Budget Situation", Before the Committee on the Budget, U.S. House of Representatives
 8:30 AM: Employment Report for December. The consensus is for an increase of 135,000 non-farm payroll jobs in January, down from the 200,000 jobs added in December. Note: it appears the seasonal adjustment for "Transportation and warehousing" over-counted employment in December by about 42,000 and this should be unwound in January. So December payroll growth was probably overstated, and January will be understated.
The consensus is for the unemployment rate to remain unchanged at 8.5%.
 This second employment graph shows the percentage of payroll jobs lost during post WWII recessions through December.
 The economy has added 2.65 million jobs since employment bottomed in February 2010 (3.16 million private sector jobs added, and 500 thousand public sector jobs lost).
There are still 5.7 million fewer private sector jobs now than when the recession started. (6.1 million fewer total nonfarm jobs).
10:00 AM: ISM non-Manufacturing Index for January. The consensus is for an increase to 53.3 in January from 52.6 in December. Note: Above 50 indicates expansion, below 50 contraction.
10:00 AM: Manufacturers' Shipments, Inventories and Orders (Factory Orders) for December. The consensus is for a 1.5% increase in orders.
Summary for Week ending January 27th
by Calculated Risk on 1/28/2012 08:12:00 AM
The key story last week was that the Federal Open Market Committee (FOMC) noted that “economic conditions … are likely to warrant exceptionally low levels for the federal funds rate at least through late 2014.” This was a change from mid-2013.
In addition the FOMC released their inaugural forecasts of the appropriate path for the Fed Funds rate, and most participants expect rates to be low for a long long time. The FOMC also set a long run inflation target of 2 percent (this was understood, but now it is official).
The January Summary of Economic Projections (SEP) showed the FOMC is projecting inflation will remain below target through 2014, whereas the unemployment rate will remain too high for years. This suggest that further action is likely, and Fed Chairman Bernanke seemed to pave the way for QE3 with his comments at the press briefing. My view is QE3 could be announced as early as the next FOMC meeting in March, or perhaps at one of the two day meetings in April or June.
In general the economic data released last week was disappointing. The advance report showed that real GDP only increased at a 2.8% annual rate in Q4. Much of the increase was related to changes in private inventories, and PCE only increased at a 2.0% annual rate. New home sales also disappointed, with sales falling to 307 thousand annual rate in December.
There was some mild good news: two regional Fed manufacturing surveys (Richmond and Kansas City) showed faster expansion in January, and consumer sentiment increased again.
Overall this is consistent with sluggish growth.
Here is a summary in graphs:
• Real GDP increased 2.8% annual rate in Q4
The BEA reported that "Real gross domestic product ... increased at an annual rate of 2.8 percent in the fourth quarter of 2011"
 Click on graph for larger image.
This graph shows the quarterly GDP growth (at an annual rate) for the last 30 years. The dashed line is the current growth rate. Growth in Q4 at 2.8% annualized was below trend growth (around 3%) - and very weak for a recovery - but the best since Q2 2010.
PCE increased at a 2.0 percent annual rate. GDP was boosted significantly by the "change in private inventories" that added 1.94 percentage points. That was somewhat offset by a decline in government spending (subtracted 0.93 percentage points).
Another key story is that residential investment is now adding to GDP. Since RI is historically the best leading indicator for the economy, this suggests further growth in 2012 (although still sluggish).
• New Home Sales declined in December to 307,000 Annual Rate
 The Census Bureau reports New Home Sales in December were at a seasonally adjusted annual rate (SAAR) of 307 thousand. This was down from a revised 314 thousand in November (revised down from 315 thousand).
This graph shows New Home Sales vs. recessions since 1963. The dashed line is the current sales rate.
 Starting in 1973 the Census Bureau broke down inventory into three categories: Not Started, Under Construction, and Completed. This graph shows the three categories of inventory starting in 1973.
The inventory of completed homes for sale was at 61,000 units in December. The combined total of completed and under construction is at the lowest level since this series started.
New home sales have averaged only 300 thousand SAAR over the 20 months since the expiration of the tax credit ... mostly moving sideways at a very low level.
• ATA Trucking Index increased sharply in December
 "The American Trucking Associations’ advanced seasonally adjusted (SA) For-Hire Truck Tonnage Index jumped 6.8% in December after rising 0.3% in November 2011. The latest gain put the SA index at 124.5 (2000=100) in December, up from the November level of 116.6."
Here is a long term graph that shows ATA's For-Hire Truck Tonnage index.
The dashed line is the current level of the index. This index stalled early in 2011, but increased sharply at the end of the year.
• State Unemployment Rates "slightly lower" in December
 This graph shows the current unemployment rate for each state (red), and the max during the recession (blue). Every state has some blue - indicating no state is currently at the maximum during the recession.
The states are ranked by the highest current unemployment rate. Only four states and the District of Columbia still have double digit unemployment rates. This is the fewest since early 2009. At the end of 2009, 18 states and D.C. had double digit unemployment rates.
• Weekly Initial Unemployment Claims increased to 377,000
 The following graph shows the 4-week moving average of weekly claims since January 2000.
The dashed line on the graph is the current 4-week average. The four-week average of weekly unemployment claims decreased this week to 377,500.
The 4-week moving average remains below 400,000.
Weekly claims have been bouncing around lately - January is a period with large seasonal adjustments and that can lead to some large swings - but the 4-week average of weekly claims have been mostly trending down.
• Consumer Sentiment increased in January
 The final January Reuters / University of Michigan consumer sentiment index increased to 75.0, up from the preliminary reading of 74.0, and up from the December reading of 69.9.
Sentiment is still fairly weak, although above the consensus forecast of 74.0.
• Other Economic Stories ...
• FOMC Statement: Rates likely exceptionally low through late 2014
• FOMC: Sets 2% Inflation Target, January Summary of Economic Projections (SEP) and Press Briefing
• Analysis: Bernanke paves the way for QE3
• Pending Home Sales Decline in December
• From the Richmond Fed: Manufacturing Activity Picks Up the Pace in January; Expectations Upbeat
• Kansas City Fed: Tenth District Manufacturing Activity Rebounded in January
• DOT: Vehicle Miles Driven declined 0.9% in November
Friday, January 27, 2012
Government to triple HAMP payments for principal reductions
by Calculated Risk on 1/27/2012 09:03:00 PM
From Jon Prior at HousingWire: Treasury to pay investors triple for HAMP principal reductions
The Treasury Department will triple payments to mortgage investors for reducing borrower principal through an expanded Home Affordable Modification Program announced Friday [CR note: Treasury will pay incentives ranging from .18 to .63 cents on the dollar - depending on the change in LTV]Based on DeMarco's comments, it doesn't sound like Fannie and Freddie will participate in the principal reductions.
Officials announced several critical changes to HAMP, including an enrollment extension to Dec. 31, 2013, from its original expiration date at the end of this year.
The Treasury will also require servicers to factor in second liens and other obligations in the debt-to-income ratio calculation. Previously, if a borrower's first-lien mortgage monthly payment was below 31% of the income, the borrower was deemed ineligible. Factoring other debts to the DTI evaluation will expand the pool of borrowers who could receive the assistance.
To combat blight, officials said they would also expand HAMP to investors who are renting properties to tenants.
...
Department of Housing and Urban Development Secretary Shaun Donovan said in the conference call Friday that the Treasury would make these payments to Fannie Mae and Freddie Mac if they participate in the principal reduction program.
To date, the GSEs have not committed to such a program.
...
"FHFA’s assessment of the investor incentives now being offered will follow its previous analysis, including consideration of the eligible universe, operational costs to implement such changes, and potential borrower incentive effects," said FHFA Acting Director Edward DeMarco in a statement Friday.
Bank Failure #6 & 7: Tennessee and Minnesota
by Calculated Risk on 1/27/2012 06:10:00 PM
Failure for all the small fish
Pardons for the whales
by Soylent Green is People
From the FDIC: First Resource Bank, Savage, Minnesota, Assumes All of the Deposits of Patriot Bank Minnesota, Forest Lake, Minnesota
As of September 30, 2011, Patriot Bank Minnesota had approximately $111.3 million in total assets and $108.3 million in total deposits. ... The FDIC estimates that the cost to the Deposit Insurance Fund (DIF) will be $32.6 million. ... Patriot Bank Minnesota is the sixth FDIC-insured institution to fail in the nation this year, and the first in Minnesota. The last FDIC-insured institution closed in the state was The Riverbank, Wyoming, Minnesota, on October 7, 2011.From the FDIC: U.S. Bank National Association, Cincinnati, Ohio, Assumes All of the Deposits of BankEast, Knoxville, Tennessee
As of September 30, 2011, BankEast had approximately $272.6 million in total assets and $268.8 million in total deposits. ... The FDIC estimates that the cost to the Deposit Insurance Fund (DIF) will be $75.6 million. ... BankEast is the seventh FDIC-insured institution to fail in the nation this year, and the second in Tennessee. The last FDIC-insured institution closed in the state was Tennessee Commerce Bank, Franklin, earlier today.That makes four today.
Bank Failures #4 and 5 in 2012: Florida and Tennessee
by Calculated Risk on 1/27/2012 05:13:00 PM
Sack Panther and Titan banks
A Patriots chore
by Soylent Green is People
From the FDIC: CenterState Bank of Florida, National Association, Winter Haven, Florida, Assumes All of the Deposits of First Guaranty Bank and Trust Company of Jacksonville, Jacksonville, Florida
As of September 30, 2011, First Guaranty Bank and Trust Company of Jacksonville had approximately $377.9 million in total assets and $349.5 million in total deposits. ... The FDIC estimates that the cost to the Deposit Insurance Fund (DIF) will be $82.0 million. ... First Guaranty Bank and Trust Company of Jacksonville is the fourth FDIC-insured institution to fail in the nation this year, and the second in Florida. The last FDIC-insured institution closed in the state was Central Florida State Bank, Belleview, on January 20, 2012.From the FDIC: Republic Bank & Trust Company, Louisville, Kentucky, Assumes All of the Deposits of Tennessee Commerce Bank, Franklin, Tennessee
As of September 30, 2011, Tennessee Commerce Bank had approximately $1.185 billion in total assets and $1.156 billion in total deposits. ... The FDIC estimates that the cost to the Deposit Insurance Fund (DIF) will be $416.8 million. ... Tennessee Commerce Bank is the fifth FDIC-insured institution to fail in the nation this year, and the first in Tennessee. The last FDIC-insured institution closed in the state was Bank of Alamo, Alamo, on November 8, 2002.Hey, Tennessee is on the board. Another failure in Florida? No surprise.
LPS: 2010, 2011 Mortgage Originations have record low default rates
by Calculated Risk on 1/27/2012 02:46:00 PM
From LPS Applied Analytics: LPS' Mortgage Monitor Shows 2010, 2011 Originations Among Best Quality on Record
The December Mortgage Monitor report released by Lender Processing Services shows mortgage originations continued their decline from 2011’s September peak, down 10.1 percent from the month before. At the same time, those loans originated over the last two years have proven to be some of the best quality originations on record.According to LPS, 8.15% of mortgages were delinquent in December, unchanged from November, and down from 8.83% in December 2010.
...
Looking at judicial vs. non-judicial foreclosure states, LPS found that half of all loans in foreclosure in judicial states have not made a payment in more than two years. Foreclosure sale rates in non-judicial states stood at approximately four times that of judicial foreclosure states in December. Still, on average, pipeline ratios (the time it would take to clear through the inventory of loans either seriously delinquent or in foreclosure at the current rate of foreclosure sales) have declined significantly from earlier this year.
LPS reports that 4.11% of mortgages were in the foreclosure process, down from 4.16% in November, and down slightly from 4.15% in December 2010.
This gives a total of 12.26% delinquent or in foreclosure. It breaks down as:
• 2.31 million loans less than 90 days delinquent.
• 1.79 million loans 90+ days delinquent.
• 2.07 million loans in foreclosure process.
For a total of 6.17 million loans delinquent or in foreclosure in December.
 Click on graph for larger image.
This graph shows the total delinquent and in-foreclosure rates since 1995.
The total delinquent rate has fallen to 8.15% from the peak in January 2010 of 10.97%, but the decline has "halted". A normal rate is probably in the 4% to 5% range, so there is a long ways to go.
The in-foreclosure rate was at 4.11%, down from the record high in October 2011 of 4.29%. There are still a large number of loans in this category (about 2.07 million). LPS reported that foreclosure starts were down nearly 40% in December, probably due to process issues.
 This graph provided by LPS Applied Analytics shows foreclosure inventories by process.
 As LPS noted earlier: "Judicial vs. non-judicial foreclosure processes remain a significant factor in the reduction of foreclosure pipelines from state to state, with non-judicial foreclosure inventory percentages less than half that of judicial states. This is largely a result of the fact that foreclosure sale rates in non-judicial states have been proceeding at four to five times that of judicial. Non-judicial foreclosure states made up the entirety of the top 10 states with the largest year-over-year decline in non-current loans percentages."
 The third graph shows the 90+ day default rate by vintage.
LPS noted "2010 and 2011 originations are among the best on record".
And this isn't just because of tighter lending standards, LPS also noted (see report) that there were vintage improvements for high risk cohorts too (high risk defined as "Credit Score less than 660 and LTV greater than 80").
Notice the early payment default for the bubble years. The jump in payment 3 means the buyer missed the first three payments!
Overall this means newer loans are performing very well, but that there are a large number of delinquent loans stuck in the pipeline - especially in the judicial states.
Q4 GDP: Residential Investment now making a positive contribution
by Calculated Risk on 1/27/2012 11:19:00 AM
The following graph shows the contribution to GDP from residential investment, equipment and software, and nonresidential structures (3 quarter centered average). This is important to follow because residential investment tends to lead the economy, equipment and software is generally coincident, and nonresidential structure investment trails the economy.
For the following graph, red is residential, green is equipment and software, and blue is investment in non-residential structures. So the usual pattern - both into and out of recessions is - red, green, blue.
The dashed gray line is the contribution from the change in private inventories.
 Click on graph for larger image.
Residential Investment (RI) made a positive contribution to GDP in Q4 for the third consecutive quarter. Usually residential investment leads the economy, but not this time because of the huge overhang of existing inventory.
The contribution from RI will probably continue to be sluggish compared to previous recoveries. Still the positive contribution is a significant story.
Equipment and software investment has made a significant positive contribution to GDP for ten straight quarters (it is coincident). However the contribution from equipment and software investment in Q4 was the weakest since the recovery started.
The contribution from nonresidential investment in structures was negative in Q4. Nonresidential investment in structures typically lags the recovery, however investment in energy and power has masked the ongoing weakness in office, mall and hotel investment (the underlying details will be released next week).
 Residential Investment as a percent of GDP increased slightly in Q4.
Most of the increase was probably due to multifamily and home improvement investment. I'll break down Residential Investment (RI) into components after the GDP details are released this coming week. Note: Residential investment (RI) includes new single family structures, multifamily structures, home improvement, broker's commissions, and a few minor categories.
Residential investment will increase further in 2012, and I expect investment in single family structures will also add to growth this year.
 The last graph shows non-residential investment in structures and equipment and software.
Equipment and software investment had been increasing sharply, however the growth slowed in Q4.
Non-residential investment in structures decreased in Q4 and is still near record lows as a percent of GDP. The recent small increase has come from investment in energy and power. I'll add details for investment in offices, malls and hotels next week.
The key story is that residential investment is starting to increase. This trend will probably continue in 2012 - although the recovery in RI will be sluggish.
Earlier ...
• Real GDP increased 2.8% annual rate in Q4
Consumer Sentiment increases in January
by Calculated Risk on 1/27/2012 09:55:00 AM
Click on graph for larger image.
The final January Reuters / University of Michigan consumer sentiment index increased to 75.0, up from the preliminary reading of 74.0, and up from the December reading of 69.9.
Sentiment is still fairly weak, although above the consensus forecast of 74.0.
Real GDP increased 2.8% annual rate in Q4
by Calculated Risk on 1/27/2012 08:30:00 AM
Real gross domestic product -- the output of goods and services produced by labor and property located in the United States -- increased at an annual rate of 2.8 percent in the fourth quarter of 2011 (that is, from the third quarter to the fourth quarter), according to the "advance" estimate released by the Bureau of Economic Analysis.The following graph shows the quarterly GDP growth (at an annual rate) for the last 30 years. The dashed line is the current growth rate. Growth in Q4 at 2.8% annualized was below trend growth (around 3%) - and very weak for a recovery - but the best since Q2 2010.
The acceleration in real GDP in the fourth quarter primarily reflected an upturn in private inventory investment and accelerations in PCE and in residential fixed investment that were partly offset by a deceleration in nonresidential fixed investment, a downturn in federal government spending, an acceleration in imports, and a larger decrease in state and local government spending.
Click on graph for larger image.
A few key numbers:
• Real personal consumption expenditures increased 2.0 percent in the second quarter, compared with an increase of 1.7 percent in the third.
• Change in private inventories added 1.94 percentage point. This was partially ffset by a decline in government spending (subtracted 0.93 percentage points).
• Investment growth slowed, except residential investment: "Real nonresidential fixed investment increased 1.7 percent in the fourth quarter, compared with an increase of 15.7 percent in the third. Nonresidential structures decreased 7.2 percent, in contrast to an increase of 14.4 percent. Equipment and software increased 5.2 percent, compared with an increase of 16.2 percent. Real residential fixed investment increased 10.9 percent, compared with an increase of 1.3 percent."
I'll have more on GDP later ...
Thursday, January 26, 2012
GDP Report expected to show 3% annualized growth
by Calculated Risk on 1/26/2012 10:05:00 PM
On December New Home Sales:
• New Home Sales decline in December to 307,000 Annual Rate
• 2011: Record Low New Home Sales and 'Distressing Gap'
• New Home Sales graphs
Last week on Existing Home sales:
• Existing Home Sales in December: 4.61 million SAAR, 6.2 months of supply
• Existing Home Sales: Inventory and NSA Sales Graph
• Existing Home Sales graphs
 The BEA will release the Q4 advance GDP report Friday morning. The consensus is that real GDP increased 3.0% annualized in Q4.
This graph shows the quarterly GDP growth (at an annual rate) for the last 30 years. The Red column is the forecast for Q4 GDP.
At 3% this would be the fastest growth rate since Q2 2010, however PCE growth will probably still be weak and will probably be closer to 2% annualized.
Case Shiller House Price Forecasts: New Post-bubble lows Seasonally Adjusted
by Calculated Risk on 1/26/2012 05:07:00 PM
The Case Shiller house price indexes for November will be released next Tuesday. Here are a couple of forecasts:
• Zillow Forecast: November Case-Shiller Composite-20 Expected to Show 3.2% Decline from One Year Ago
Zillow predicts that the 20-City Composite Home Price Index (non-seasonally adjusted, NSA) will decline by 3.2 percent on a year-over-year basis, while the 10-City Composite Home Price Index (NSA) will show a year-over-year decline of 2.7 percent. The seasonally adjusted (SA) month-over-month change from October to November will be -0.2 percent and -0.1 percent for the 20 and 10-City Composite Home Price Index (SA), respectively.• From RadarLogic: Home Prices Declined at an Accelerating Rate in November as Sales Increased
The S&P/Case-Shiller Composite Home Price Indices for November 2011 will decline again on a month-over-month basis.Below is a summary table. Case-Shiller will probably report house prices are at a new post-bubble low seasonally adjusted, but still above the NSA (Not Seasonally Adjusted) levels of March 2011.
...
This month, we expect the November 2011 10-City composite index to be about 152 and the 20-City index to be roughly 138.
| Case Shiller Composite 10 | Case Shiller Composite 20 | ||||
|---|---|---|---|---|---|
| NSA | SA | NSA | SA | ||
| Case Shiller (actual) | Nov-10 | 157.5 | 156.44 | 143.77 | 142.77 |
| Oct-11 | 154.1 | 152.24 | 140.3 | 138.56 | |
| Zillow Forecast | YoY | -2.7% | -2.7% | -3.2% | -3.2% |
| MoM | -0.6% | -0.1% | -0.8% | -0.2% | |
| Zillow Forecasts1 | 153.2 | 152.2 | 139.2 | 138.2 | |
| RadarLogic Forecast | 152 | 138 | |||
| Post Bubble Lows2 | 150.44 | 152.24 | 137.64 | 138.56 | |
| 1Estimate based on Year-over-year and Month-over-month Zillow forecasts2NSA lows were in March 2011, SA lows were last month. | |||||
Misc: Tenth District manufacturing increases, Chicago Fed National Activity Index, State Coincident indexes
by Calculated Risk on 1/26/2012 02:31:00 PM
Catching up ...
• Kansas City Fed: Tenth District Manufacturing Activity Rebounded in January
The month-over-month composite index was 7 in January, up from revised totals of -2 in December and 4 in November. The composite index is an average of the production, new orders, employment, supplier delivery time, and raw materials inventory indexes. ... The production and shipments indexes jumped to their highest levels since June, and the new orders index climbed from -2 to 8.All of the regional manufacturing surveys have indicated stronger expansion in January (Empire state, Philly, Richmond and Kansas City). The Dallas Fed survey is scheduled to be released on Monday.
• The Chicago Fed released the national activity index (a composite index of other indicators): Index shows economic activity improved in December
Led by improvements in production- and employment-related indicators, the Chicago Fed National Activity Index increased to +0.17 in December from –0.46 in November. ...This graph shows the Chicago Fed National Activity Index (three month moving average) since 1967.
The index’s three-month moving average, CFNAI-MA3, increased from –0.19 in November to –0.08 in December—its highest value since March 2011. December’s CFNAI-MA3 suggests that growth in national economic activity was slightly below its historical trend. The economic slack reflected in this level of the CFNAI-MA3 suggests limited inflationary pressure from economic activity over the coming year.
 Click on graph for larger image.
According to the Chicago Fed:
A zero value for the index indicates that the national economy is expanding at its historical trend rate of growth; negative values indicate below-average growth; and positive values indicate above-average growth.• From the Philly Fed:
The Federal Reserve Bank of Philadelphia has released the coincident indexes for the 50 states for December 2011. In the past month, the indexes increased in 39 states, decreased in seven, and remained unchanged in four (Arizona, Nebraska, New York, and Wyoming) for a one-month diffusion index of 64.
 This is a graph is of the number of states with one month increasing activity according to the Philly Fed. This graph includes states with minor increases (the Philly Fed lists as unchanged).
In December, 42 states had increasing activity, down from 44 in November.
Note: These are coincident indexes constructed from state employment data. From the Philly Fed:
The coincident indexes combine four state-level indicators to summarize current economic conditions in a single statistic. The four state-level variables in each coincident index are nonfarm payroll employment, average hours worked in manufacturing, the unemployment rate, and wage and salary disbursements deflated by the consumer price index (U.S. city average). The trend for each state’s index is set to the trend of its gross domestic product (GDP), so long-term growth in the state’s index matches long-term growth in its GDP.
 Here is a map of the three month change in the Philly Fed state coincident indicators. This map was all red during the worst of the recession, and all green in early 2011 - but this is an improvement from last summer.
2011: Record Low New Home Sales and 'Distressing Gap'
by Calculated Risk on 1/26/2012 12:04:00 PM
2011 was the worst year for new home sales since the Census Bureau started tracking sales in 1963. The three worst years were 2011, 2010, and 2009 - and 2008 is also on the worst ten list. Although sales will probably increase in 2012, this year will probably be high in the list too.
See list at bottom.
The following graph shows existing home sales (left axis) and new home sales (right axis) through December. This graph starts in 1994, but the relationship has been fairly steady back to the '60s.
Following the housing bubble and bust, the "distressing gap" appeared mostly because of distressed sales. The flood of distressed sales has kept existing home sales elevated, and depressed new home sales since builders can't compete with the low prices of all the foreclosed properties.
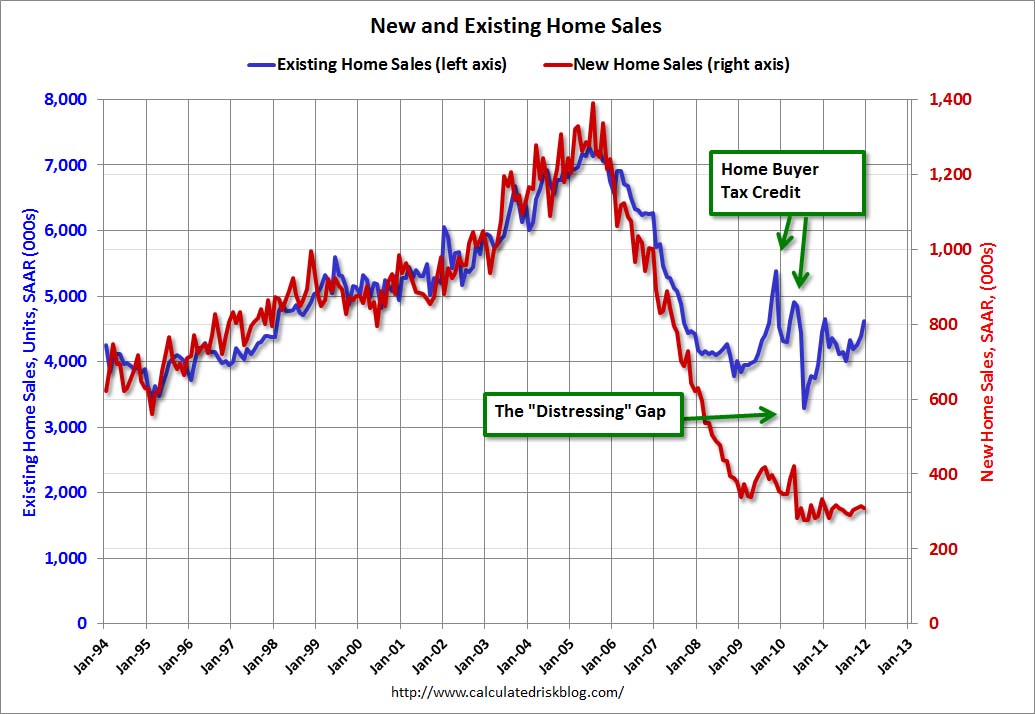 Click on graph for larger image.
I expect this gap to eventually close once the number of distressed sales starts to decline.
Note: Existing home sales are counted when transactions are closed, and new home sales are counted when contracts are signed. So the timing of sales is different.
On December New Home Sales:
• New Home Sales decline in December to 307,000 Annual Rate
• New Home Sales graphs
Last week on Existing Home sales:
• Existing Home Sales in December: 4.61 million SAAR, 6.2 months of supply
• Existing Home Sales: Inventory and NSA Sales Graph
• Existing Home Sales graphs
| Ten Worst Years for New Home Sales since 1963 | |
|---|---|
| Year | Sales (000s) |
| 2011 | 302 |
| 2010 | 323 |
| 2009 | 375 |
| 1982 | 412 |
| 1981 | 436 |
| 1969 | 448 |
| 1966 | 461 |
| 1970 | 485 |
| 2008 | 485 |
| 1967 | 487 |
New Home Sales decline in December to 307,000 Annual Rate
by Calculated Risk on 1/26/2012 10:00:00 AM
The Census Bureau reports New Home Sales in December were at a seasonally adjusted annual rate (SAAR) of 307 thousand. This was down from a revised 314 thousand in November (revised down from 315 thousand).
The first graph shows New Home Sales vs. recessions since 1963. The dashed line is the current sales rate.
Sales of new single-family houses in December 2011 were at a seasonally adjusted annual rate of 307,000 ... This is 2.2 percent (±13.2%) below the revised November rate of 314,000 and is 7.3 percent (±16.6%) below the December 2010 estimate of 331,000.
Click on graph for larger image in graph gallery.The second graph shows New Home Months of Supply.
Months of supply increased to 6.1 in December.
The all time record was 12.1 months of supply in January 2009.
 This is now close to normal (less than 6 months supply is normal).
The seasonally adjusted estimate of new houses for sale at the end of December was 157,000. This represents a supply of 6.1 months at the current sales rate.On inventory, according to the Census Bureau:
"A house is considered for sale when a permit to build has been issued in permit-issuing places or work has begun on the footings or foundation in nonpermit areas and a sales contract has not been signed nor a deposit accepted."Starting in 1973 the Census Bureau broke this down into three categories: Not Started, Under Construction, and Completed.
This graph shows the three categories of inventory starting in 1973.The inventory of completed homes for sale was at 61,000 units in December. The combined total of completed and under construction is at the lowest level since this series started.
The last graph shows sales NSA (monthly sales, not seasonally adjusted annual rate).
In December 2011 (red column), 21 thousand new homes were sold (NSA). This was the weakest December since this data has been tracked, and was below the previous record low for December of 23 thousand set in 1966 and tied in 2010. The high for December was 87 thousand in 2005.
 This was below the consensus forecast of 320 thousand, and was a new record low for the month of December (NSA).
 New home sales have averaged only 300 thousand SAAR over the 20 months since the expiration of the tax credit ... mostly moving sideways at a very low level.


