 RSS Feed
 by Calculated Risk on 1/26/2012 12:04:00 PM
Thursday, January 26, 2012
2011: Record Low New Home Sales and 'Distressing Gap'
2011 was the worst year for new home sales since the Census Bureau started tracking sales in 1963. The three worst years were 2011, 2010, and 2009 - and 2008 is also on the worst ten list. Although sales will probably increase in 2012, this year will probably be high in the list too.
See list at bottom.
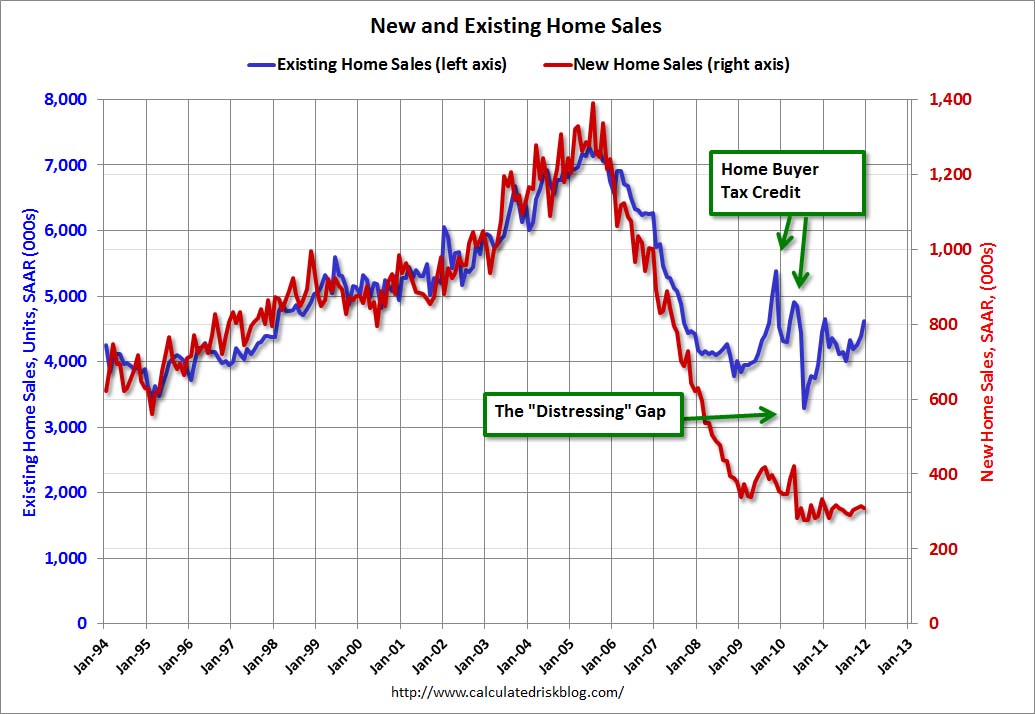
The following graph shows existing home sales (left axis) and new home sales (right axis) through December. This graph starts in 1994, but the relationship has been fairly steady back to the '60s.
Following the housing bubble and bust, the "distressing gap" appeared mostly because of distressed sales. The flood of distressed sales has kept existing home sales elevated, and depressed new home sales since builders can't compete with the low prices of all the foreclosed properties.
 Click on graph for larger image.
I expect this gap to eventually close once the number of distressed sales starts to decline.
Note: Existing home sales are counted when transactions are closed, and new home sales are counted when contracts are signed. So the timing of sales is different.
On December New Home Sales:
• New Home Sales decline in December to 307,000 Annual Rate
• New Home Sales graphs
Last week on Existing Home sales:
• Existing Home Sales in December: 4.61 million SAAR, 6.2 months of supply
• Existing Home Sales: Inventory and NSA Sales Graph
• Existing Home Sales graphs
| Ten Worst Years for New Home Sales since 1963 | |
|---|---|
| Year | Sales (000s) |
| 2011 | 302 |
| 2010 | 323 |
| 2009 | 375 |
| 1982 | 412 |
| 1981 | 436 |
| 1969 | 448 |
| 1966 | 461 |
| 1970 | 485 |
| 2008 | 485 |
| 1967 | 487 |


