 RSS Feed
 by Calculated Risk on 11/03/2010 02:15:00 PM
Wednesday, November 03, 2010
FOMC Statement: QE2 Arrives, $600 Billion by end of Q2 2011
I'll have more later ...
Update: from the NY Fed: Statement Regarding Purchases of Treasury Securities. About 86% of the purchases will be in the 2.5 to 10 year Maturity range.
The FOMC also directed the Desk to continue to reinvest principal payments from agency debt and agency mortgage-backed securities into longer-term Treasury securities. Based on current estimates, the Desk expects to reinvest $250 billion to $300 billions over the same period, though the realized amount of reinvestment will depend on the evolution of actual principal payments.From the Federal Reserve's Federal Open Market Committee:
Taken together, the Desk anticipates conducting $850 billion to $900 billion of purchases of longer-term Treasury securities through the end of the second quarter. This would result in an average purchase pace of roughly $110 billion per month, representing about $75 billion per month associated with additional purchases and roughly $35 billion per month associated with reinvestment purchases.
...
To provide operational flexibility and to ensure that it is able to purchase the most attractive securities on a relative-value basis, the Desk is temporarily relaxing the 35 percent per-issue limit on SOMA holdings under which it has been operating. However, SOMA holdings of an individual security will be allowed to rise above the 35 percent threshold only in modest increments.
Information received since the Federal Open Market Committee met in September confirms that the pace of recovery in output and employment continues to be slow. Household spending is increasing gradually, but remains constrained by high unemployment, modest income growth, lower housing wealth, and tight credit. Business spending on equipment and software is rising, though less rapidly than earlier in the year, while investment in nonresidential structures continues to be weak. Employers remain reluctant to add to payrolls. Housing starts continue to be depressed. Longer-term inflation expectations have remained stable, but measures of underlying inflation have trended lower in recent quarters.
Consistent with its statutory mandate, the Committee seeks to foster maximum employment and price stability. Currently, the unemployment rate is elevated, and measures of underlying inflation are somewhat low, relative to levels that the Committee judges to be consistent, over the longer run, with its dual mandate. Although the Committee anticipates a gradual return to higher levels of resource utilization in a context of price stability, progress toward its objectives has been disappointingly slow.
To promote a stronger pace of economic recovery and to help ensure that inflation, over time, is at levels consistent with its mandate, the Committee decided today to expand its holdings of securities. The Committee will maintain its existing policy of reinvesting principal payments from its securities holdings. In addition, the Committee intends to purchase a further $600 billion of longer-term Treasury securities by the end of the second quarter of 2011, a pace of about $75 billion per month. The Committee will regularly review the pace of its securities purchases and the overall size of the asset-purchase program in light of incoming information and will adjust the program as needed to best foster maximum employment and price stability.
The Committee will maintain the target range for the federal funds rate at 0 to 1/4 percent and continues to anticipate that economic conditions, including low rates of resource utilization, subdued inflation trends, and stable inflation expectations, are likely to warrant exceptionally low levels for the federal funds rate for an extended period.
The Committee will continue to monitor the economic outlook and financial developments and will employ its policy tools as necessary to support the economic recovery and to help ensure that inflation, over time, is at levels consistent with its mandate.
Voting for the FOMC monetary policy action were: Ben S. Bernanke, Chairman; William C. Dudley, Vice Chairman; James Bullard; Elizabeth A. Duke; Sandra Pianalto; Sarah Bloom Raskin; Eric S. Rosengren; Daniel K. Tarullo; Kevin M. Warsh; and Janet L. Yellen.
Voting against the policy was Thomas M. Hoenig. Mr. Hoenig believed the risks of additional securities purchases outweighed the benefits. Mr. Hoenig also was concerned that this continued high level of monetary accommodation increased the risks of future financial imbalances and, over time, would cause an increase in long-term inflation expectations that could destabilize the economy.
General Motors: October U.S. sales increase year-over-year
by Calculated Risk on 11/03/2010 11:12:00 AM
Note: The real key is the seasonally adjusted annual sales rate (SAAR) compared to the last few months, not the year-over-year comparison provided by the automakers.
From MarketWatch: GM reports 3.5% rise in Oct. U.S. car sales
[GM] sold 183,759 cars and trucks, up from 177,603 a year ago.This is not adjusted for selling days, and there was one more selling day in October 2009 than in October 2010.
Once all the reports are released, I'll post a graph of the estimated total October light vehicle sales (SAAR) - usually around 4 PM ET. Most estimates are for an increase to 12.0 million SAAR in October from the 11.71 million SAAR in September.
I'll add reports from the other major auto companies as updates to this post.
Update: from MarketWatch: Ford U.S. October sales rise 19.2% to 157,935
From MarketWatch: Chrysler October U.S. sales jump 37%
Chrysler ... reported a 37% jump in October U.S. auto sales to 90,137 vehicles, up from 65,803 a year ago.From MarketWatch: Toyota U.S. October sales decline 4.4%
ISM non-Manufacturing Index increases in October
by Calculated Risk on 11/03/2010 10:00:00 AM
The October ISM Non-manufacturing index was at 54.3%, up from 53.2% in September - and above expectations of 54.0%. The employment index showed expansion in October at 50.9%, up from 50.2% in September. Note: Above 50 indicates expansion, below 50 contraction.
 Click on graph for larger image in new window.
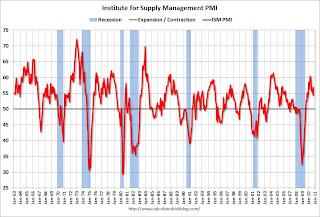
This graph shows the ISM non-manufacturing index (started in January 2008) and the ISM non-manufacturing employment diffusion index.
From the Institute for Supply Management: October 2010 Non-Manufacturing ISM Report On Business®
Economic activity in the non-manufacturing sector grew in October for the 10th consecutive month, say the nation's purchasing and supply executives in the latest Non-Manufacturing ISM Report On Business®.Slightly better than expected.
The report was issued today by Anthony Nieves, C.P.M., CFPM, chair of the Institute for Supply Management™ Non-Manufacturing Business Survey Committee; and senior vice president — supply management for Hilton Worldwide. "The NMI (Non-Manufacturing Index) registered 54.3 percent in October, 1.1 percentage points higher than the 53.2 percent registered in September, and indicating continued growth in the non-manufacturing sector at a slightly faster rate. The Non-Manufacturing Business Activity Index increased 5.6 percentage points to 58.4 percent, reflecting growth for the 11th consecutive month at a substantially faster rate than in September. The New Orders Index increased 1.8 percentage points to 56.7 percent, and the Employment Index increased 0.7 percentage point to 50.9 percent, indicating growth in employment for the second consecutive month and the fourth time in the last six months.
emphasis added
ADP: Private Employment increases by 43,000 in October
by Calculated Risk on 11/03/2010 08:15:00 AM
ADP reports:
Private-sector employment increased by 43,000 from September to October on a seasonally adjusted basis, according to the latest ADP National Employment Report® released today. The estimated change of employment from August to September was revised up from the previously reported decline of 39,000 to a smaller decline of 2,000.Note: ADP is private nonfarm employment only (no government jobs).
Since employment began rising in February, the monthly gain has averaged 34,000 with a range of -2,000 to +65,000 during the period. October’s figure is within this recent range and is consistent with the deceleration of economic growth that occurred in the spring. Employment gains of this magnitude are not sufficient to lower the unemployment rate.
The consensus was for ADP to show an increase of about 20,000 private sector jobs in October, so this was above consensus.
The BLS reports on Friday, and the consensus a 60,000 increase in payroll jobs in October, on a seasonally adjusted (SA) basis and for the unemployment rate to stay steady at 9.6%.
MBA: Mortgage Purchase Applications Increase slightly last week
by Calculated Risk on 11/03/2010 07:32:00 AM
The MBA reports: Mortgage Purchase Applications Increase, while Refinance Applications Decline in Latest MBA Weekly Survey
The Refinance Index decreased 6.4 percent from the previous week. This is the third straight week the Refinance Index has decreased. The seasonally adjusted Purchase Index increased 1.4 percent from one week earlier.
...
The average contract interest rate for 30-year fixed-rate mortgages increased to 4.28 percent from 4.25 percent, with points increasing to 1.07 from 1.00 (including the origination fee) for 80 percent loan-to-value (LTV) ratio loans.
 Click on graph for larger image in new window.
This graph shows the MBA Purchase Index and four week moving average since 1990.
The four-week moving average of the purchase index decreased 2.7% last week, and is about 30% below the levels of April 2010. This suggests existing home sales will remain weak through the end of the year.
Tuesday, November 02, 2010
Wednesday: More than just QE2
by Calculated Risk on 11/02/2010 11:59:00 PM
Just a preview - tomorrow will be busy ...
7:00 AM: The Mortgage Bankers Association (MBA) will release the mortgage purchase applications index.
8:15 AM: The ADP Employment Report for October. This report is for private payrolls only (no government). The consensus is for +20,000 payroll jobs in October - still weak, but an improvement over the 39,000 jobs reported lost in September.
All day: Light vehicle sales for October. Light vehicle sales are expected to increase in October to around 12.0 million (Seasonally Adjusted Annual Rate), from 11.76 million in September. If correct, this will be highest sales rate in 2 years (excluding Cash-for-clunkers in August 2009).
10:00 AM: Manufacturers' Shipments, Inventories and Orders for September. The consensus is for a 1.8% increase in orders. Also important will be the growth in inventories, and the inventory-to-sales ratio.
10:00 AM: ISM non-Manufacturing Index for October. The consensus is for an increase to 54.0 from 53.2 in September.
2:15 PM: FOMC statement released. The key will be how the FOMC will implement the 2nd round of quantitative easing.
New Feature: CR Graph Galleries
by Calculated Risk on 11/02/2010 06:54:00 PM
To make it easier to review the most recent version of frequently updated graphs, I've created a set of graph galleries (thanks to Ken!).
The Graph Galleries are grouped by Employment, New Home Sales, and much more. There are tabs for each gallery.
Clicking on a tab will load a gallery. Then thumbnails will appear below the main graph for all of the graphs in the selected gallery. Clicking on the thumbnails will display each graph.
The title below each large image is a link to the related blog post on Calculated Risk (I'll put the date in the title to show the most recent update).
To access the galleries, just click on a graph on the blog - or click on "Graph Galleries" in the menu bar above.
 As an example, clicking on this graph (based on the most recent employment report), will open the "employment" chart gallery and display this graph - with thumbnails for other employment related graphs.
The "print" key displays the full size image of the selected graph for printing from your browser.
Note: The graphs are free to use on websites or for presentations. All I ask is that online sites link to my site http://www.calculatedriskblog.com/ (or to the graphics gallery), and that printed presentations credit www.calculatedriskblog.com.
Enjoy. Best to all.
It's the economy ...
by Calculated Risk on 11/02/2010 04:46:00 PM
Since apparently there is an election today, here is a reminder from Sandhya Somashekhar at the WaPo of the key issue: Economic worries overshadow other issues
[O]ne issue is [in voters'] minds like no other this year: the economy. Nearly 40 percent of voters in a recent Washington Post poll rated the nation's fiscal[CR Note: they meant "economic"] situation as their top concern in the days leading to the election ...Yes - as always - it's the economy.
The good news is the robo-calls and election ads will stop.
LPS: Over 4.3 million loans 90+ days or in foreclosure
by Calculated Risk on 11/02/2010 12:35:00 PM
LPS Applied Analytics released their September Mortgage Performance data today. According to LPS:
• The average number of days delinquent for loans in foreclosure is now 484 days
• In five judicial states (NY, FL, NJ, HI and ME), the average exceeds 500 days
• Over 4.3 million loans are 90 days or more delinquent or in foreclosure
• New problem loans (60+ days delinquent) are back on the rise
 Click on graph for larger image in new window.
This graph provided by LPS Applied Analytics shows the percent delinquent, percent in foreclosure, and total non-current mortgages.
According to LPS, 9.27 percent of mortgages are delinquent, and another 3.84 are in the foreclosure process for a total of 13.11 percent. It breaks down as:
• 2.64 million loans less than 90 days delinquent.
• 2.32 million loans 90+ days delinquent.
• 2.05 million loans in foreclosure process.
For a total of 7.02 million loans delinquent or in foreclosure.
This is similar to the quarterly data from the Mortgage Bankers Association.
Q3 2010: Homeownership Rate at 1999 Levels
by Calculated Risk on 11/02/2010 10:00:00 AM
The Census Bureau reported the homeownership and vacancy rates for Q3 2010 this morning.
 Click on graph for larger image in new window.
The homeownership rate was at 66.9%, the same level as in Q2. This is at about the level of early 1999.
Note: graph starts at 60% to better show the change.
The homeownership rate increased in the '90s and early '00s because of changes in demographics and "innovations" in mortgage lending. The increase due to demographics (older population) will probably stick, so I've been expecting the rate to decline to around 66%, and probably not all the way back to 64% to 65%. I'll revisit this soon - and the impact on the homebuilders.
 The homeowner vacancy rate was at 2.5% in Q3 2010. This is the same level as in Q2, and below the of 2.9% in 2008.
A normal rate for recent years appears to be about 1.7%.
This leaves the homeowner vacancy rate about 0.8% above normal. This data is not perfect, but based on the approximately 75 million homeowner occupied homes, we can estimate that there are close to 600 thousand excess vacant homes.
The rental vacancy rate declined to 10.3% in Q3 2010 from 10.6% in Q2.
 This decline fits with the Reis apartment vacancy data and the NMHC apartment survey. This report is nationwide and includes homes for rent.
It's hard to define a "normal" rental vacancy rate based on the historical series, but we can probably expect the rate to trend back towards 8%. According to the Census Bureau there are close to 41 million rental units in the U.S. If the rental vacancy rate declined from 10.3% to 8%, then 2.3% X 41 million units or about 950 thousand excess units would have to be absorbed.
This suggests there are still about 1.55 million excess housing units. These excess units will keep pressure on housing starts, rents and house prices for some time.
NOTE: The graphs in this post link to a new Gallery graphics tool (Thanks Ken!). This CR Gallery is a collection of current graphs from the blog. There are tabs for several categories: Employment, New home Sales, etc.
Click on a tab, and a gallery is loaded. Then thumbnails appear below the main graph for all of the graphs in the selected gallery. Click on the thumbnails to view each graph. The title below each large image is a link to the related blog post on Calculated Risk (or click on the main image to view the blog post).
The "print" key displays the full size image of the selected graph for printing from your browser. Enjoy!
Wilmington Trust: A warning of more CRE Construction Losses coming?
by Calculated Risk on 11/02/2010 09:14:00 AM
Yesterday M&T Bank bought Wilmington Trust. From the WSJ: A Fire Sale in Wilmington
Wilmington announced that M&T Bank would buy it, in an all-stock deal, for about $3.84 a share, compared with Friday's $7.11 close. Wilmington did so while releasing results that showed third-quarter, tangible book value dropped to $3.84 compared with $7.92 in the second quarter. ... Most striking is the speed of the deterioration in the loan book.

Click on graph for larger image in new window.
This table is from the Wilmington Trust press release yesterday. It shows that commercial real estate - construction nonperforming assets jumped from $240.7 million at the end of Q2 to $461.9 million at the end of Q3. Quite a jump ...
Here is the M&T Bank presentation too.
And from the conference call:
CEO: “Credit quality clearly remains the big story. So, let me say a few more things on that subject. The negative effects of the protracted recessionary environment in Delaware, and how these pressures are challenging the financial health of many of our borrowers, simply cannot be over stated. In the third quarter, evidence mounted that had things were getting worse for some of our borrowers. And even some of our strongest clients began to feel the pressure. The financial conditions of more of our borrowers weakened, their cash flows tightened, and appraisals continued to show significant declines in collateral valuations. These issues manifested themselves in our credit metrics, to a significantly greater degree than in the second quarter.So much for extend and hope ... and it sounds like this merger might have been driven by a regulatory review:
By the end of the third quarter, we had evaluated more than 92% of our Commercial Real Estate/Construction and mortgage loans, and the trend line is not encouraging. It appears to us, that there is no significant economic or real estate recovery on the horizon. This gives us little assurance that our loan portfolio will strengthen significantly in the near term, and our capital position will not erode further.”
Analyst: Don, the Company obviously had credit issues, but the decline in TC, book value, etc., the magnitude of increase of non-performers still was pretty surprising. Can you talk at all about whether or not a specific event drove this quarter's results? Was there a regulatory exam, if not, what changed so dramatically in the last 90 days?Sounds like a possible push from the regulators. I wonder how many other regional banks have similar issues?
Wilmington Trust, CEO: Well, what we saw an acceleration in the deterioration of the credit quality of many of our customers over this quarter. We receive a lot in terms of the appraisal information that we gathered. all indicating that both the magnitude and velocity of this credit deterioration was -- was very significant for us.
Analyst: When was your last exam?
Wilmington Trust CEO: We are -- our soundness exam started some time at the end of June, beginning of July. And we are still going through the exit process at this point.
Monday, November 01, 2010
Borrowing costs for Ireland and Portugal increase sharply
by Calculated Risk on 11/01/2010 09:12:00 PM
From the Financial Times: Debt costs jump for Dublin and Lisbon(ht Nemo)
Borrowing costs for Ireland and Portugal shot up as investors took fright at European proposals to force them to take a greater share of losses in future state bail-outs. ... The moves ... follow agreement at last week’s European Union summit on a Franco-German proposal on a mechanism to resolve future Greek-style sovereign debt crises.The yield on the Ireland 10-year bonds jumped to 7.1%, and the spread to the German 10-year bonds is at 462 bps - both are new highs. The yield on the Portugal 10-year bonds increased to 6.1%, and Greece 10-year bonds are now yielding 10.7%.
excerpt with permission
Real Estate Brokers' Commissions Lowest since 1982 as Percent of GDP
by Calculated Risk on 11/01/2010 05:45:00 PM
More from the Q3 2010 GDP underlying detail tables ...
Note: Residential investment (RI), according to the Bureau of Economic Analysis (BEA), includes new single family structures, multifamily structures, home improvement, broker's commissions, and a few minor categories.
 Click on graph for larger image in new window.
This graph shows the various components of RI as a percent of GDP for the last 50 years. Usually the most important components are investment in single family structures followed by home improvement.
Investment in home improvement was at a $146.6 billion Seasonally Adjusted Annual Rate (SAAR) in Q3 (1.0% of GDP), significantly above the level of investment in single family structures of $110.0 billion SAAR, or 0.75% of GDP.
Brokers' commissions also declined sharply in Q3 as the number of existing homes sold fell off a cliff in Q3. This has pushed brokers' commissions (0.33% of GDP), to the lowest level since 1982, as a percent of GDP.
Brokers' commissions peaked at 0.91% of GDP in Q3 2005. In nominal terms, commissions have declined from an annual peak rate of $116.5 billion in Q3 2005, to an annual rate of $48.2 billion in Q3 2010 - a decline of over 58%.
And investment in multifamily structures - already at a series low as a percent of GDP (since 1959) - declined further in Q3. This might be the low for multifamily structures since multifamily starts increased in recent months.
NMHC Quarterly Apartment Survey: Market Conditions Tighten
by Calculated Risk on 11/01/2010 03:29:00 PM
From the National Multi Housing Council (NMHC): Across-the-Board Improvement in the Apartment Industry, According to NMHC Quarterly Survey of Apartment Market Conditions
The Market Tightness Index, which measures changes in occupancy rates and/or rents, decreased from 83 to 77, but remained well above the “break-even” mark of 50. Sixty percent of respondents said markets were tighter, meaning lower vacancies and/or higher rents.
...
“While demand for apartment residences and apartment properties is still below the peak levels seen in the last decade, the further shift from owning to renting may well add to apartment demand in the near-term, while population growth and a rebound in household formation should strengthen demand over the longer term. But at some point, economic growth will have to shift into a higher gear for the apartment industry to see conditions continue to register improvements of this level.” [said NMHC Chief Economist Mark Obrinsky]

Click on graph for larger image in new window.
This graph shows the quarterly Apartment Tightness Index.
The index has indicated tighter market conditions for the last three quarters (from very weak conditions).
A reading above 50 suggests the vacancy rate is falling. Based on limited historical data, I think this index will lead reported apartment rents by about 6 months to 1 year.
This fits with the recent Reis data showing apartment vacancy rates fell in Q3 to 7.2% from 7.8% in Q2.
Also this data is a survey of large apartment owners only. The data released in late July from the Census Bureau showed the rental vacancy rate was steady in Q2 for all rental units in all areas. The Census Bureau will release the Q3 vacancy rates tomorrow, along with the homeownership rate.
A final note: The results of this survey suggest the rental market might have bottomed. I heard from a few sources that effective rents increased slightly over the first half of 2010 at some large apartment complexes. Just something to be aware of ... (I've posted about this before).
Q3: Office, Mall and Lodging Investment
by Calculated Risk on 11/01/2010 01:05:00 PM
First - the advance Q3 GDP report released last Friday showed an annualized real increase of 3.9% for investment in non-residential structures. This broke a streak of eight straight quarterly declines. However the construction spending report released this morning suggests that most (probably all) of this gain will be revised away.
Second - with the release of underlying detail data today - we can see that most of the reported small gains for non-residential structure investment in Q3 were for power and petroleum mining structures.
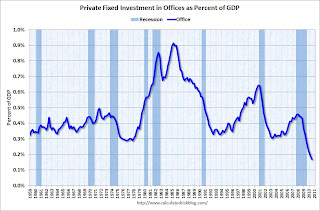
If we look at just office, mall and lodging investment, non-residential structure investment continued to decline in Q3.
 Click on graph for larger image in new window.
This graph shows investment in offices as a percent of GDP. Office investment as a percent of GDP peaked at 0.46% in Q1 2008 and has declined sharply to a new series low as a percent of GDP (data series starts in 1959).
Reis reported that the office vacancy rate is at a 17 year high at 17.5% in Q3, up from 17.4% in Q2, and 16.6% in Q3 2009. With the office vacancy rate still rising, office investment will probably decline further - although most of the decline in investment has already happened.
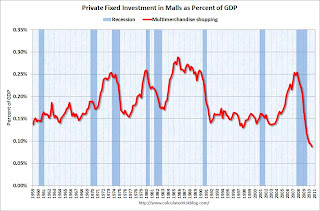 The second graph is for investment in malls.
Investment in multimerchandise shopping structures (malls) peaked in 2007 and has fallen by two-thirds (note that investment includes remodels, so this will not fall to zero). Mall investment is also at a series low (as a percent of GDP).
Reis reported that the mall vacancy rate declined slightly in Q3 2010 from the record high in Q2. However the vacancy rate will have to decline substantially before there is significant new investment.
 The third graph is for lodging (hotels).
The bubble boom in lodging investment was stunning. Lodging investment peaked at 0.32% of GDP in Q2 2008 and has fallen by over 70% already.
As projects are completed there will be little new investment in these categories for some time.
Also notice that investment for all three categories typically falls for a year or two after the end of a recession, and then usually recovers very slowly (flat as a percent of GDP for 2 or 3 years). Something similar will probably happen again, and there will not be a recovery in these categories until the vacancy rates fall significantly.
Private Construction Spending Flat in September: July and August Revised Down
by Calculated Risk on 11/01/2010 10:53:00 AM
The Census Bureau reported overall construction spending increased in September compared to August.
[C]onstruction spending during September 2010 was estimated at a seasonally adjusted annual rate of $801.7 billion, 0.5 percent (±1.9%)* above the revised August estimate of $797.5 billion.However private construction spending was about the same as the downwardly revised August rate:
Spending on private construction was at a seasonally adjusted annual rate of $482.0 billion, nearly the same as (±1.1%)* the revised August estimate of $481.9 billion. [revised down from $498.2 billion]
 Click on graph for larger image in new window.
This graph shows private residential and nonresidential construction spending since 1993. Note: nominal dollars, not inflation adjusted.
Residential spending is 65.7% below the peak early 2006, and non-residential spending is 39.5% from the peak in January 2008.
The downward revisions to construction spending in July and August were significant.
These downward revisions will negatively impact Q3 GDP for both residential investment, and non-residential investment in structures.
ISM Manufacturing Index increases to 56.9 in October
by Calculated Risk on 11/01/2010 10:00:00 AM
PMI at 56.9% in October, up from 54.4% in September. The consensus was for an increase to 54.5%.
From the Institute for Supply Management: October 2010 Manufacturing ISM Report On Business®
The report was issued today by Norbert J. Ore, CPSM, C.P.M., chair of the Institute for Supply Management™ Manufacturing Business Survey Committee. "The manufacturing sector grew during October, with both new orders and production making significant gains. Since hitting a peak in April, the trend for manufacturing has been toward slower growth. However, this month's report signals a continuation of the recovery that began 15 months ago, and its strength raises expectations for growth in the balance of the quarter. Survey respondents note the recovery in autos, computers and exports as key drivers of this growth. Concerns about inventory growth are lessened by the improvement in new orders during October. With 14 of 18 industries reporting growth in October, manufacturing continues to outperform the other sectors of the economy."
 Click on graph for larger image in new window.
Here is a long term graph of the ISM manufacturing index.
In addition to the increase in the PMI, the ISM's new orders index was up sharply to 58.9 from 51.1 in September.
The employment index increased to 57.7 from 56.5 in September.
And the inventory index declined to 53.9 from 55.6, but this was the 4th month in a row of increasing inventories.
The internals were stronger this month. It was just last month that Ore cautioned that the new orders and inventory indexes were "sending strong negative signals of weakening performance in the [manufacturing] sector".
The increase in the ISM index was in line with the increases in the regional Fed manufacturing surveys.
Personal income declines 0.1%, Spending increases 0.2% in September
by Calculated Risk on 11/01/2010 08:30:00 AM
From the BEA: Personal Income and Outlays, June 2010
Personal income decreased $16.8 billion, or 0.1 percent, and disposable personal income (DPI) decreased $20.3 billion, or 0.2 percent, in September ... Personal consumption expenditures (PCE) increased $17.3 billion, or 0.2 percent.
...
Real PCE -- PCE adjusted to remove price changes -- increased 0.1 percent in September, compared with an increase of 0.3 percent in August.
...
Personal saving as a percentage of disposable personal income was 5.3 percent in September, compared with 5.6 percent in August.
 Click on graph for large image.
This graph shows real personal income less transfer payments since 1969.
This measure of economic activity is moving sideways - similar to what happened following the 2001 recession.
This month the saving rate decreased ...
 This graph shows the saving rate starting in 1959 (using a three month trailing average for smoothing) through the Setpember Personal Income report.
 In September, income declined 0.1%, and spending increased 0.2% - so the saving rate decreased to 5.3% in September (5.5% using a three month average).
I expect the saving rate to rise some more over the next year, perhaps to 8% or so - keeping the pace of PCE growth below income growth.
Sunday, October 31, 2010
Two Extremes: Paying on Underwater Mortgages, and Living in Default
by Calculated Risk on 10/31/2010 09:22:00 PM
Earlier posts:
The following articles illustrate two extremes we've discussed before. The first is about borrowers with significant negative equity who are still paying their mortgage. They can't refinance. They can't sell. And it is difficult to move for new employment. This is probably a drag on economic growth.
And at the other extreme are borrowers staying in their homes for extended periods without paying their mortgage or property taxes. This might be providing some "stealth stimulus" for the economy. Note: Some people call this the "squatter stimulus", but I think that term is demeaning since many of these people are facing serious financial problems and living with uncertainty.
From Don Lee at the LA Times: Millions of homeowners keep paying on underwater mortgages
Of the estimated 15 million homeowners underwater, about 7.8 million owed at least 25% more than their properties were worth in the first quarter of this year ... More than 4 million borrowers ... were underwater more than 50%.The borrowers with negative equity are still receiving the same housing service, and making the same payment, as a few years ago. In that sense it isn't a drag on the economy. However they can't take advantage of low rates to refinance, they can't sell, it is difficult to move, and they are frequently reluctant to invest in home improvements - and they might even forgo needed repairs. And there is probably a negative wealth effect impacting their overall consumption.
... They still have jobs and can afford to make the payments. ... But they can't refinance because they owe too much.
And from Mark Whitehouse at the WSJ: The Stealth Stimulus of Defaulters Living for Free
Defaulters living in their homes are getting a subsidy worth about $2.6 billion a month, according to a Wall Street Journal analysis based on mortgage data from LPS Applied Analytics and rent data from the Commerce Department.For the borrowers in default, many are probably unemployed or facing other serious financial issues. If they weren’t living “rent free”, they’d probably move in with friends or relatives, or even live in their cars or worse. So the "free" housing service they are currently receiving will probably be replaced with another low cost housing alternative. And if even if they move into an apartment, they will probably still be spending the same amount (just on different items). So for many people in this situation, I don't think there is really much "stealth stimulus".
Music: Quantitative Easin'
by Calculated Risk on 10/31/2010 05:45:00 PM
Earlier posts:
For your enjoyment, from singer Curtis Threadneedle (in the style of Barry White), a song co-written by Curtis Threadneedle and Merle Hazard, and produced by Merle Hazard.


