 RSS Feed
 by Calculated Risk on 10/11/2010 06:06:00 PM
Monday, October 11, 2010
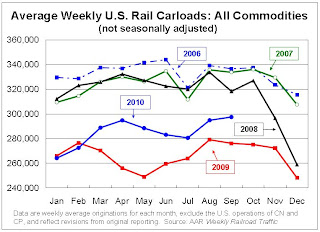
Rail Intermodal Traffic at 2008 levels, Carload Traffic Lags
From the Association of American Railroads: Rail Time Indicators. The AAR reports carload traffic in September 2010 was up 7.7% compared to September 2009 - and carload traffic was 7.5% lower than in September 2008. Intermodal traffic (using intermodal or shipping containers) is up up 17.3% over September 2009 and up 0.2% over September 2008.
 Click on graph for larger image in new window.
This graph shows U.S. average weekly rail carloads (NSA). Traffic increased in 16 of 19 major commodity categories year-over-year.
From AAR:
• U.S. freight railroads originated 1,487,511 carloads in September 2010, an average of 297,502 carloads per week. That’s up 7.7% from September 2009 and down 7.5% from September 2008 on a non-seasonally adjusted basis. It’s also the highest weekly average for any month since October 2008.As the graph above shows, rail carload traffic collapsed in November 2008, and now, a year into the recovery, carload traffic has only recovered half way. However ...
• Average unadjusted weekly carloads are typically lower in September than in August because of the Labor Day holiday. This year, though, September’s weekly unadjusted average (297,502) was higher than August’s (294,862). Why? The week with Labor Day was, as usual, one of the lowest-volume weeks of the year, but the other four weeks in September 2010 were all among the six highest-volume weeks of the year. The top two weeks so far in 2010 were in September.
• That explains why seasonally adjusted U.S. rail carloads were up 1.9% in September 2010 over August 2010, reaching their highest level since November 2008.

• U.S. railroads originated 1,165,288 intermodal trailers and containers in September 2010, an average of 233,058 per week on an unadjusted basis. That’s down slightly from August 2010, but that’s just due to Labor Day. The four non-Labor Day weeks in September were four of the top five intermodal weeks so far in 2010. September 2010 intermodal traffic was up 17.3% over September 2009 and up 0.2% over September 2008.The increase in intermodal traffic, along with the increase in West Coast port import traffic, are two of the indicators that suggest retailers might have over-ordered for the holidays. Stephanie Clifford and Catherine Rampell mentioned this possibility in the NY Times article last week: Dim Outlook for Holiday Jobs
• On an unadjusted basis, September is traditionally the second (sometimes third) highest-volume month of the year for intermodal, behind October. Intermodal peaks in the fall as retailers stock up for the holidays.
excerpts with permission
While retailers are just now making plans for Christmas hiring, they had to make plans for Christmas merchandise months ago, and that lag might create some inventory problems.
In the first part of the year, the economic picture looked much brighter. ... That was at about the same time that retailers had to order holiday merchandise because of the time it takes to produce and ship the inventory.
And recent traffic at the nation’s ports suggests that retailers made optimistic bets.
Economic Nobel Prize: Matching "the honored work with the moment"
by Calculated Risk on 10/11/2010 03:22:00 PM
A couple of reviews and explanations of the work of Peter Diamond, Dale Mortensen and Christopher Pissarides ...
From Edward Glaeser at Economix: The Work Behind the Nobel Prize
This year’s Nobel Memorial Prize in Economic Science ... was awarded today to Peter A. Diamond, Dale T. Mortensen and Christopher A. Pissarides for their research on “markets with search frictions,” which means any setting where buyers and sellers don’t automatically find each other. Search models are relevant in many settings, including dating, used cars and housing, but above all, these models help us make sense of unemployment.And more from Paul Krugman: What We Learn From Search Models
...
Professor Diamond’s ... work was distinguished both by elegant modeling — building the theoretical tools needed to make sense of labor turnover—and important insights. Perhaps the key idea is the “search externality,” the idea that each “additional worker makes it easier for vacancies to find workers and harder for other workers to find jobs.” ... Whenever one worker passes up a job, that worker makes finding a job easier for other workers. This insight led to Professor Diamond’s conclusion that higher levels of unemployment insurance could improve the workings of the labor market by making some workers pass up marginal jobs.
...
The work of these economists does not tell us how to fix our current high unemployment levels, but it does help us to make some sense of our current distress. Their models tell us that common wisdom — like the belief that higher unemployment benefits always increase unemployment — may be wrong and that policies that improve matching may have great value. Rarely has the prize committee been better able to match the honored work with the moment.
With regard to current concerns, probably the most relevant paper is Blanchard and Diamond on the Beveridge Curve — the relationship between job vacancies and unemployment. ... It shows that structural unemployment is a real issue, and that the volume of structural unemployment shifts over time. It also shows, however, that short-term movements in unemployment are overwhelmingly the result of overall shocks to demand ...And from Catherine Rampell at the NY Times: 3 Share Nobel Economics Prize for Labor Analysis
In a telephone interview with reporters at the Nobel news conference in Sweden, Professor Pissarides said he thought the work being honored had one lesson in particular for today’s policy makers: “What we should really be doing is make sure the unemployed do not stay unemployed for too long, to try to give them direct work experience,” so that they “don’t lose their attachment to the labor force.”
Professor Diamond, in a news conference at M.I.T., echoed his colleague’s advice about getting people back to work as quickly as possible, but said fears about permanently higher unemployment rates and structural displacement of workers were overblown.
“I think the economy is very adaptive,” he said. “Workers and employers will adapt to what will make the economy function. I see no reason why, once we get fully over this, we won’t go back to normal times,” with more “normal” unemployment rates.
Real GDP Growth and the Unemployment Rate
by Calculated Risk on 10/11/2010 12:33:00 PM
At the November FOMC meeting, the Fed will update their economic forecasts.
In June, the Fed forecast was for GDP growth of between 3.5% and 4.2% in 2011, with the unemployment rate falling to 8.3% to 8.7%. However since their forecasts were too optimistic for 2010, the unemployment rate would even be higher next year with the same growth forecast in 2011 (because the FOMC had expected the unemployment rate to fall further in 2010).
 Click on graph for larger image.
Here is an update on a version of Okun's Law. This graph shows the annual change in real GDP (x-axis) vs. the annual change in the unemployment rate (y-axis).
Note: For this graph I used a rolling four quarter change - so all the data points are not independent. However - remember - this "law" is really just a guide.
Using this graph and the previous Fed forecasts for 2011 (3.5% to 4.2% GDP growth), we can estimate that the unemployment rate will be in the 9.0% to 9.4% range in a year (although the spread is pretty wide).
The following table summarizes several scenarios over the next year (starting from the current 9.6% unemployment rate):
| Real GDP Growth | Unemployment Rate in One Year |
|---|---|
| 0.0% | 11.0% |
| 1.0% | 10.5% |
| 2.0% | 10.0% |
| 3.0% | 9.6% |
| 4.0% | 9.1% |
| 5.0% | 8.7% |
I expected a sluggish recovery in 2010, so I thought the unemployment rate would stay elevated throughout 2010 (that was correct).
Going forward, I think the recovery will stay sluggish and choppy for some time and I'd guess the unemployment rate will tick up in the short term and still be above 9% later next year. You can see why those expecting 1% to 2% growth next year (like Goldman Sachs) are expecting the unemployment rate to be close to 10%.
Obviously higher growth rates would mean an even quicker decline in the unemployment rate, and a decline in real GDP would mean much higher unemployment rates.
CNBC Survey: Fed Certain to act in November
by Calculated Risk on 10/11/2010 09:23:00 AM
Market participants now expects QE2 to be announced at 2:15 PM ET on November 3rd (when the FOMC statement is released at the conclusion of the two day meeting).
From Steve Liesman at CNBC: Fed Certain to Act in November In a Big Way: Survey
[M]arket participants are now virtually certain that the Federal Reserve will announce [QE2] at the conclusion of its November meeting and do so in a sizeable way, according to an exclusive CNBC Fed Survey. ... participants forecast that the Fed will announce plans to purchase $500 billion in assets ...The FOMC might announce a large amount - or they might announce a monthly pace of purchases like the $100 billion we've discussed before, with the intention of reviewing the purchase pace at each subsequent FOMC meeting.
Note: This coming Friday, at 8:15 AM ET, Fed Chairman Ben Bernanke will address the tools and goals of QE2 at the Federal Reserve Bank of Boston Conference. His speech is titled: "Monetary Policy Objectives and Tools in a Low-Inflation Environment".
Sunday, October 10, 2010
Fed's Dudley: Costs of higher capital requirements under Basel III are "exaggerated"
by Calculated Risk on 10/10/2010 09:53:00 PM
Earlier:
The following speech focuses on Basel III capital and liquidity standards.
From NY Fed President William Dudley: Basel and the Wider Financial Stability Agenda
[T]he new standards will require banking organizations to significantly increase the amount of high-quality, loss-absorbing capital that they hold; significantly improve risk capture in trading, counterparty credit, securitization and other activities that the prior regulatory capital requirements did not adequately capture; make it more expensive for banks to provide liquidity guarantees to shadow banks; constrain the leverage that banking companies can take by introducing a credible, non-risk-based backstop; and increase the capacity of banks to absorb shocks that might temporarily impede their ability to access short-term funding markets. While these changes apply directly only to large internationally active banks, they will have wider ramifications for the financial system as a whole, including nonbanks and the capital markets.Note that the word "intended" is highlighted in the speech. The requirement are intended to encourage banks to change thier business models and reduce risk.
...
The new capital rules are intended to provide strong incentives for banks to change their business models in ways that make the system more stable and reduce the negative impact their actions have on others—for instance, by providing incentives to standardize OTC derivatives contracts and clear such standardized trades through central counterparties. To understand what these new requirements mean for the amount of capital banks will ultimately have to hold, it is important to note that one of the intended consequences of these changes is for banks to adjust their business models in ways that reduce the risks their activities generate.
And on the costs:
[S]ome argue that the new [Basel] standards are too severe. They argue that, in the short run, the higher standards could lead to a significant constraint in credit that could hurt the nascent economic expansion. And, they argue, in the long run, that the higher capital standards will inevitably drive up lending costs and that this will hurt economic performance. Although I believe the new standards do impose some real costs on the financial system in order to achieve real benefits, I believe that concerns over the costs are exaggerated.The new standards will be phased in over several years.
Summary for Week ending Oct 9th
by Calculated Risk on 10/10/2010 03:55:00 PM
A summary of last week - mostly in graphs.
The weak employment report all but guaranteed QE2 will be announced on November 3rd. The "whisper" number is for an announcement of an initial $500 billion in purchases of long term Treasury securities over the following six months.
 Click on graph for larger image.
This graph shows the job losses from the start of the employment recession, in percentage terms (as opposed to the number of jobs lost).
The dotted line is ex-Census hiring. The two lines have joined since the decennial Census is almost over.
The BLS reported:
1) Nonfarm payroll employment decreased by -95,000 in September
2) the Unemployment Rate was unchanged at 9.6%
3) Private employment increased by 64,000.
4) Government employment declined by 159,000 (mostly Census and local government).
5) Census 2010 employment decreased 77,000 in September.
6) so there were 18,000 payroll jobs lost ex-Census.
Note: This will be the last "ex-Census" report until the 2020 Census!
 The second graph shows the unemployment rate vs. recessions.
The unemployment rate has mostly moved sideways since falling to 9.7% in January 2010.
The economy has gained 334,000 jobs over the last year, and lost 7.75 million jobs since the recession started in December 2007. However the preliminary benchmark revision (to be announced with the January 2011 report) is for a downward revision of 366,000 jobs as of March 2010 - and that suggests over 8.1 million jobs have been lost since the start of the employment recession.
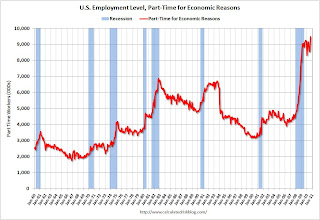 The number of workers only able to find part time jobs (or have had their hours cut for economic reasons) was at 9.472 million in September, up sharply from August.
 This is a new record high, and is obviously bad news.
These workers are included in the alternate measure of labor underutilization (U-6) that increased to 17.1% in September from 16.7% in August. The high for U-6 was 17.4% in October 2009.
 This graph shows the employment-population ratio; this is the ratio of employed Americans to the adult population.
The Employment-Population ratio was steady at 58.5% in September (the same low level as in August).
Note: the graph doesn't start at zero to better show the change.
The Labor Force Participation Rate was also steady at 64.7% in September. This is the percentage of the working age population in the labor force. The participation rate is well below the 66% to 67% rate that was normal over the last 20 years.
 The blue line is the number of workers unemployed for 27 weeks or more. The red line is the same data as a percent of the civilian workforce.
According to the BLS, there are 6.123 million workers who have been unemployed for more than 26 weeks and still want a job. This is 4.0% of the civilian workforce. It appears the number of long term unemployed has peaked ... Although this may be because people are giving up.
Employment Report Summary
The number of private sector jobs increased modestly by 64,000, otherwise the underlying details of the employment report were grim.
The negatives include the loss of 18,000 jobs ex-Census, the sharp increase in part time workers for economic reasons (and jump in U-6 unemployment rate), hours worked were flat (down for manufacturing workers), the employment-population ratio and labor force participation were flat at very low levels, and the unemployment rate was flat at a very high level.
This was another weak employment report.
 This graph shows the ISM non-manufacturing index (started in January 2008) and the ISM non-manufacturing employment diffusion index.
The September ISM Non-manufacturing index was at 53.2%, up from 51.5% in August - and above expectations of 52.0%. The employment index showed slight expansion in September at 50.2%, up from 48.2% in August. Note: Above 50 indicates expansion, below 50 contraction.
 This graph shows the office vacancy rate starting in 1991.
Reis is reporting the vacancy rate rose to 17.5% in Q3 2010, up from 17.4% in Q2 2010, and up from 16.6% in Q3 2009. The peak following the previous recession was 16.9%.
From the WSJ Signs of Recovery For Office Market
It appears the rate of increase in the vacancy rate has slowed - and rents may be stabilizing.
 Reis reported that the vacancy rate for large regional malls fell to 8.8% in Q3 from 9.0% in Q2. The vacancy rate at strip malls fell to 10.9%.
At regional malls, the record vacancy rate was 9.0% in Q2 2010 (Reis started tracking regional malls in 2000). The record vacancy rate for strip malls was in 1990 at 11.1%.
From Reuters: U.S. mall vacancy rate dips for first time in 3 years
And on apartment vacancies: From Ilaina Jonas at Reuters: US apartment vacancy rate drops sharply in 3rd qtr.
The national vacancy rate fell to 7.2 percent from 7.8 percent in the second quarter as renters soaked up 84,382 more units than were vacated ...This is for large apartment building in major cities, and it shows a significant drop in the vacancy rate.
Best wishes to all.
Schedule for Week of Oct 10th
by Calculated Risk on 10/10/2010 12:30:00 PM
The key release this week will be September retail sales on Friday. Also Fed Chairman Ben Bernanke will try to explain the objectives of QE2 on Friday "Monetary Policy Objectives and Tools in a Low-Inflation Environment".
Ceridian-UCLA Pulse of Commerce Index™ This is the diesel fuel index for September (a measure of transportation).
CoreLogic House Price Index for August. This release could show further declines in house prices. The index is a weighted 3 month average for June, July and August.
Association of American Railroads rail traffic indicators for September. Trucking, rail traffic and the Ceridian diesel fuel index are all measures of transportation (a coincident indicator).
2:45 PM ET: Federal Reserve Vice Chair Janet Yellen speaks at the National Association for Business Economics meeting in Denver: "Macroprudential Supervision and Monetary Policy in the Post-Crisis World"
7:30 AM: NFIB Small Business Optimism Index for September. This index has been showing small businesses remain pessimistic and the survey shows that the major concern of small businesses is lack of customers.
11:45 AM: Kansas City Fed President Thomas Hoenig speaks at the National Association for Business Economics meeting in Denver. "The Economic Outlook and Monetary Policy: Challenges Ahead"
2:00 PM: FOMC Minutes, Meeting of September 21, 2010. Investors will focus on any discussion of QE2.
7:00 AM: The Mortgage Bankers Association (MBA) will release the mortgage purchase applications index. This index declined sharply following the expiration of the tax credit. The index has increased a little recently - possibly due to borrowers trying to beat the slightly tighter FHA requirements.
7:45 PM: Richmond Fed President Jeffrey Lacker will speak in Chapel Hill, NC.
8:30 AM: The initial weekly unemployment claims report will be released. Consensus is for a slight decrease to 443K from 445K last week.
8:30 AM: Trade Balance report for August from the Census Bureau. The consensus is for the U.S. trade deficit to increase to $44 billion (from $42.8 billion in July).
8:30 AM: Producer Price Index for September. The consensus is for a 0.1% increase in producer prices.
8:15 AM: Fed Chairman Ben S. Bernanke will speak at the Federal Reserve Bank of Boston Conference "Monetary Policy Objectives and Tools in a Low-Inflation Environment"
8:30 AM: Consumer Price Index for September. The consensus is for a 0.2% increase in prices. This is being closely watched for further disinflation, and also because Q3 is the quarter the annual annual cost-of-living adjustment (COLA) is calculated for Social Security (this will make it official that there will be no change in 2011).
8:30 AM: Retail Sales for September. The consensus is for a 0.4% increase from August.
8:30 AM: Empire Manufacturing Survey for October. The consensus is for a reading of 8.0, up from 4.1 in September. These regional surveys have been showing a slowdown in manufacturing and are being closely watched right now.
9:15 AM: Atlanta Fed President Dennis Lockhart participates in a question-and-answer session on the economy in Atlanta.
9:55 AM: Reuters/University of Mich Consumer Sentiment preliminary for October. The consensus is for a slight increase to 69.0 from 68.2 in September.
10:00 AM: Manufacturing and Trade: Inventories and Sales for August. Consensus is for a 0.4% increase in inventories in August.
After 4:00 PM: The FDIC has really slowed down closing banks - even though the Unofficial problem bank list continues to increase. The pace of closures will probably pickup soon ...
8:15 AM: Boston Fed President Eric Rosengren speaks at Federal Reserve Bank of Boston Conference
Pearlstein on Foreclosure-Gate
by Calculated Risk on 10/10/2010 09:08:00 AM
From Steve Pearlstein at the WaPo: To sort this mess, both banks and borrowers must do the right thing
Listening to the fiery rhetoric about the mortgage mess emanating from politicians this week, you'd think that big bad banks were trying to foreclose on hundreds of thousands of homeowners who were current on their payments but had become victims of sloppy business practices.I've pointed this out several times: the basic facts are 1) the homeowners have a mortgage and 2) the homeowner is seriously delinquent.
...
But if, as appears to be the case, the overwhelming majority of homeowners facing foreclosure have fallen far behind on their payments, then it is a good deal harder to summon up the same moral outrage over reports that the banks and loan service companies cut corners, failed to keep the right documents and engaged in shoddy and even fraudulent practices. Just because the banks and servicers have screwed up doesn't mean they and their investors are no longer entitled to get their money back.
Certainly banks and servicers should, at their own expense, be sent back to do things right. Those who engaged in fraud should be punished. And if there are legitimate questions about who owns a loan, those will need to be resolved before the proceeds of any foreclosure are distributed.
But none of that changes the basic reality that there are millions of Americans who took out mortgages they could not support on houses they could not afford.
As Tom Lawler wrote "mortgage servicers who messed up should bear all of the costs associated with their mess up". And I'd prefer alternatives to foreclosure (mortgage modification or even short sales / deed-in-lieu), but we also need to remember that the basic facts are not in dispute.
Saturday, October 09, 2010
IMF: Concern about fragile economy and exchange rates
by Calculated Risk on 10/09/2010 09:57:00 PM
Via MarketWatch: Summary of IMF meeting communique
Global economy: “Economic recovery is proceeding, but remains fragile and uneven across the membership. Faced with this source of potential stress, we underscore our strong commitment to continue working collaboratively to secure strong, sustainable and balanced growth and to refrain from policy actions that would detract from this shared goal. ... The rejection of protectionism in all its forms must remain a key element of our coordinated response to the crisis; renewed efforts are urgently needed to bring the Doha Round to a successful conclusion.”Not that anything will come of this, but clearly the IMF is still concerned about the "fragile" economy, and about exchange rates.
...
Mandate for international monetary stability: “While the international monetary system has proved resilient, tensions and vulnerabilities remain as a result of widening global imbalances, continued volatile capital flows, exchange rate movements and issues related to the supply and accumulation of official reserves. Given that these issues are critically important for the effective operation of the global economy and the stability of the international monetary system, we call on the Fund to deepen its work in these areas, including in-depth studies to help increase the effectiveness of policies to manage capital flows. We look forward to reviewing further analysis and proposals over the next year.”
Music: "Nobody Knows the Bubbles I've Seen"
by Calculated Risk on 10/09/2010 04:55:00 PM
Watch for the "Hoocoodanode" mention (A Tanta snark and the name of our message board) ...
Duration of Unemployment
by Calculated Risk on 10/09/2010 11:45:00 AM
An update by request ...
 Click on graph for larger image.
This graph shows the duration of unemployment as a percent of the civilian labor force. The graph shows the number of unemployed in four categories: less than 5 week, 6 to 14 weeks, 15 to 26 weeks, and 27 weeks or more.
Note: The BLS reports 15+ weeks, so the 15 to 26 weeks number was calculated.
In Setpember 2010, the number of unemployed for 27 weeks or more declined to 6.123 million (seasonally adjusted) from 6.249 million in August. It appears the number of long term unemployed has peaked, but it is still very difficult for these people to find a job - and this is a very serious employment issue.
The 5 to 14 week category declined in September, however the less than 5 week category continued to increase - and is now at the highest level since January 2010.
The less than 5 week category shows how the turnover in the labor market has changed. Back in the '70s and '80s there was much more turnover in the labor market. And that added turnover is a key reason the overall unemployment rate was higher in the early '80s recession than right now.
Note: Even though these numbers are all seasonally adjusted, they can't be added together to calculate the unemployment rate.
And a repeat of a popular graph ...
The second graph shows the job losses from the start of the employment recession, in percentage terms (as opposed to the number of jobs lost).
The dotted line is ex-Census hiring. The two lines have joined since the decennial Census is almost over.
Best to all
Employment posts yesterday (with many graphs):
Unofficial Problem Bank List 877 Institutions
by Calculated Risk on 10/09/2010 07:27:00 AM
Note: this is an unofficial list of Problem Banks compiled only from public sources.
Here is the unofficial problem bank list for Oct 8, 2010.
Changes and comments from surferdude808:
The number of institutions on the Unofficial Problem Bank List remained unchanged this week at 877 but assets rose slightly from $416.1 billion to $417.3 billon.
Three institutions were removed with one because of action termination -- First National Bank and Trust Company ($296 million), and two others -- First National Bank & Trust Company in Larned ($34 million) and Clear Creek National Bank ($24 million) because they merged into other banks that are on the Unofficial Problem Bank List.
Additions this week include Valley Bank, Roanoke, VA ($763 million Ticker: VYFC); Fullerton Community Bank, FSB, Fullerton, CA ($705 million); and Fort Lee Federal Savings Bank, FSB, Fort Lee, NJ ($75 million), which received about $1.3 million of TARP capital in May 2009.
We anticipate for the OCC to release its actions from mid-August through mid-September next Friday.
Friday, October 08, 2010
Late night Foreclosure-Gate
by Calculated Risk on 10/08/2010 11:36:00 PM
From Dina ElBoghdady at the WaPo: Buyers anxiously await foreclosure deals to go through
From David Streitfeld and Nelson Schwartz at the NY Times: Largest U.S. Bank Halts Foreclosures in All States
Note: the media is in a frenzy about this, but I've hardly mentioned it other than linking to a few articles and posting Tom Lawler's piece about Who will, and who should "pay"?.
Best to all.
Employment posts today (with many graphs):
Daily Show on Foreclosure-Gate
by Calculated Risk on 10/08/2010 07:26:00 PM
While we wait for the FDIC ...
From the Daily Show (link if embed doesn't work) Foreclosure Crisis
| The Daily Show With Jon Stewart | Mon - Thurs 11p / 10c | |||
| Foreclosure Crisis | ||||
| ||||
Impact of estimated Benchmark Revision on Job Losses
by Calculated Risk on 10/08/2010 03:05:00 PM
This morning I mentioned the annual benchmark revision for the employment report - here are some more details, and a graph showing the impact on job losses.
As part of the employment report, the BLS released the preliminary annual benchmark revision of minus 366,000 payroll jobs. This will be finalized next February when the January 2011 employment report is released. Usually the preliminary estimate is pretty close to the final benchmark estimate.
 Click on graph for larger image.
This graph shows the impact of the preliminary benchmark revision on job losses in percentage terms from the start of the employment recession.
The red line on the graph is the current estimate, and the dotted line shows the impact of estimated coming benchmark revision. This puts the current payroll employment about 8.1 million jobs below the pre-recession peak in December 2007.
Using the preliminary benchmark estimate, this means that payroll employment in March 2010 was 366,000 lower than originally estimated. This is slightly larger than a normal adjustment (see table below). So in February 2011, the payroll numbers will be revised down to reflect this estimate. The number is then "wedged back" to the previous revision (March 2009).
For details on the benchmark revision process, see from the BLS: Methodology
"The benchmark adjustment, a standard part of the payroll survey estimation process, is a once-a-year re-anchoring of the sample-based employment estimates to full population counts available principally through unemployment insurance (UI) tax records filed by employers with State Employment Security Agencies."The following table shows the benchmark revisions since 1979.
| Year | Percent difference | Difference in thousands |
|---|---|---|
| 1979 | 0.5 | 447 |
| 1980 | -0.1 | -63 |
| 1981 | -0.4 | -349 |
| 1982 | -0.1 | -113 |
| 1983 | * | 36 |
| 1984 | 0.4 | 353 |
| 1985 | * | -3 |
| 1986 | -0.5 | -467 |
| 1987 | * | -35 |
| 1988 | -0.3 | -326 |
| 1989 | * | 47 |
| 1990 | -0.2 | -229 |
| 1991 | -0.6 | -640 |
| 1992 | -0.1 | -59 |
| 1993 | 0.2 | 263 |
| 1994 | 0.7 | 747 |
| 1995 | 0.5 | 542 |
| 1996 | * | 57 |
| 1997 | 0.4 | 431 |
| 1998 | * | 44 |
| 1999 | 0.2 | 258 |
| 2000 | 0.4 | 468 |
| 2001 | -0.1 | -123 |
| 2002 | -0.2 | -313 |
| 2003 | -0.2 | -122 |
| 2004 | 0.2 | 203 |
| 2005 | -0.1 | -158 |
| 2006 | 0.6 | 752 |
| 2007 | -0.2 | -293 |
| 2008 | -0.1 | -89 |
| 2009 | -0.7 | -902 |
| 2010 | -0.3 | -366 estimate |
Earlier employment posts today (with many graphs):
Unemployment by Level of Education and Employment Diffusion Indexes
by Calculated Risk on 10/08/2010 12:34:00 PM
By request ...
 Click on graph for larger image in new window.
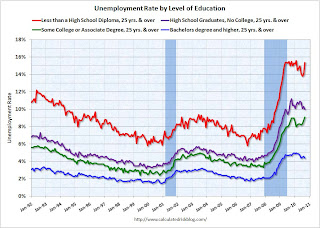
This graph shows the unemployment rate by four levels of education (all groups are 25 years and older).
Note that the unemployment rate increased sharply for all four categories in 2008 and into 2009.
Unfortunately this data only goes back to 1992 and only includes one previous recession (the stock / tech bust in 2001). Clearly education matters with regards to the unemployment rate - but education didn't seem to matter as far as the recovery rate in unemployment following the 2001 recession. All four groups recovered slowly.
Earlier this year, the group with "less than a high school diploma" recovered a little better than the more educated groups - possibly because of the tax credit related increase in construction - but that changed in September as the unemployment rate increased sharply.
For the group with some college or an associate degree, the unemployment rate is at a new high for this employment recession.
Diffusion Indexes
This is a little more technical ...
 The BLS diffusion index for total private employment declined to 49.8 from 54.1 in August. For manufacturing, the diffusion index declined to 46.3 from 48.2 in August.
Both indexes are down sharply from earlier this year.
Think of this as a measure of how widespread job gains are across industries. The further from 50 (above or below), the more widespread the job losses or gains reported by the BLS. From the BLS:
Figures are the percent of industries with employment increasing plus one-half of the industries with unchanged employment, where 50 percent indicates an equal balance between industries with increasing and decreasing employment.The increases in the diffusion indexes in 2009 and earlier this year, was a clear positive in the monthly employment reports. However the decrease in the diffusion indexes over the last few months (falling below 50% for both in September), is disappointing.
Earlier employment posts today (with many graphs):
Employment-Population Ratio, Part Time Workers, Unemployed over 26 Weeks
by Calculated Risk on 10/08/2010 09:50:00 AM
Here are a few more graphs based on the employment report ...
Percent Job Losses During Recessions, aligned at Bottom
 Click on graph for larger image.
This graph shows the job losses from the start of the employment recession, in percentage terms - this time aligned at the bottom of the recession (Both the 1991 and 2001 recessions were flat at the bottom, so the choice was a little arbitrary).
The dotted line shows the impact of Census hiring. As of the end of September, there were only 6,000 temporary 2010 Census workers still on the payroll. So the gap between the solid and dashed red lines is almost completely gone.
Part Time for Economic Reasons
From the BLS report:
The number of persons employed part time for economic reasons (sometimes referred to as involuntary part-time workers) rose by 612,000 over the month to 9.5 million. Over the past 2 months, the number of such workers has increased by 943,000. These individuals were working part time because their hours had been cut back or because they were unable to find a full-time job.The number of workers only able to find part time jobs (or have had their hours cut for economic reasons) was at 9.472 million in September, up sharply from August.
This is a new record high, and is obviously bad news.
These workers are included in the alternate measure of labor underutilization (U-6) that increased to 17.1% in September from 16.7% in August. The high for U-6 was 17.4% in October 2009. Grim.
Employment-Population Ratio
The Employment-Population ratio was steady at 58.5% in September (the same as in August).
This graph shows the employment-population ratio; this is the ratio of employed Americans to the adult population.Note: the graph doesn't start at zero to better show the change.
The Labor Force Participation Rate was also steady at 64.7% in September. This is the percentage of the working age population in the labor force. The participation rate is well below the 66% to 67% rate that was normal over the last 20 years.
When the employment picture eventually improves, people will return to the labor force and the participation rate will increase from these very low levels. And that will put upward pressure on the unemployment rate.
Unemployed over 26 Weeks
The blue line is the number of workers unemployed for 27 weeks or more. The red line is the same data as a percent of the civilian workforce.According to the BLS, there are 6.123 million workers who have been unemployed for more than 26 weeks and still want a job. This is 4.0% of the civilian workforce. It appears the number of long term unemployed has peaked ... Although this may be because people are giving up.
The number of long term unemployed is staggering - still over 6 million people who are looking for a job.
Summary
The underlying details of the employment report were grim. The number of private sector jobs increased modestly by 64,000, otherwise ...
The negatives include the loss of 18,000 jobs ex-Census, the sharp increase in part time workers for economic reasons (and jump in U-6 unemployment rate), hours worked were flat (down for manufacturing workers), the employment-population ratio and labor force participation were flat at very low levels, and the unemployment rate was flat at a very high level.
Overall this was a weak report.
September Employment Report: 18K Jobs Lost ex-Census, 9.6% Unemployment Rate
by Calculated Risk on 10/08/2010 08:30:00 AM
Note: This will be the last "ex-Census" report this decade.
From the BLS:
Nonfarm payroll employment edged down (-95,000) in September, and the unemployment rate was unchanged at 9.6 percent, the U.S. Bureau of Labor Statistics reported today. Government employment declined (-159,000), reflecting both a drop in the number of temporary jobs for Census 2010 and job losses in local government. Private-sector payroll employment continued to trend up modestly (+64,000).Census 2010 hiring decreased 77,000 in September. Non-farm payroll employment decreased 18,000 in September ex-Census.
Both July and August payroll employment were revised down. The change in total nonfarm payroll employment for July was revised from -54,000 to -66,000, and the change for August was revised from -54,000 to -57,000.
Click on graph for larger image.This graph shows the unemployment rate vs. recessions.
Nonfarm payrolls decreased by 95 thousand in August. The economy has gained 334 thousand jobs over the last year, and lost 7.75 million jobs since the recession started in December 2007.
The second graph shows the job losses from the start of the employment recession, in percentage terms (as opposed to the number of jobs lost).The dotted line is ex-Census hiring. The two lines have joined since the decennial Census is almost over.
For the current employment recession, employment peaked in December 2007, and this recession is by far the worst recession since WWII in percentage terms, and 2nd worst in terms of the unemployment rate (only early '80s recession with a peak of 10.8 percent was worse).
Note: The preliminary benchmark payroll revision is minus 366,000 jobs. This is a little larger than the normal adjustment (last year was especially large). The actual adjustment will be made in February 2011. This is the preliminary estimate of the annual revision, from the BLS: "The benchmark adjustment, a standard part of the payroll survey estimation process, is a once-a-year re-anchoring of the sample-based employment estimates to full population counts available principally through unemployment insurance (UI) tax records filed by employers with State Employment Security Agencies."
This is another weak employment report. I'll have much more soon ...
For more, see next post: Employment-Population Ratio, Part Time Workers, Unemployed over 26 Weeks
Thursday, October 07, 2010
NY Times: Foreclosure-Gate starting to impact home sales
by Calculated Risk on 10/07/2010 10:23:00 PM
From Andrew Martin and David Streitfeld at the NY Times: Flawed Foreclosure Documents Thwart Home Sales
[A]s a scandal unfolds over mortgage lenders’ shoddy preparation of foreclosure documents, the fallout is beginning to hammer the housing market, especially in states like Florida where distressed properties are abundant. ... the agents are being told the freeze will last 30 to 90 days ...This will probably just be a delay. And the delays will mostly be in the judicial foreclosure states, although the story has one example of a house withdrawn from the market in California.
[One Florida] agency had 35 deals that were supposed to close this month. As of Thursday, Fannie had postponed 11 of them.
Video of Krugman, Feldstein and Hatzius from Oct 5th
by Calculated Risk on 10/07/2010 08:00:00 PM
Here is the video of Professors Paul Krugman and Martin Feldstein (former Reagan advisor and NBER president), and Jan Hatzius, chief economist of Goldman Sachs:
The Economic Policy Institute conference on October 5, 2010
I'm not sure who is the most pessimistic.


