 RSS Feed
 by Calculated Risk on 10/10/2010 03:55:00 PM
Sunday, October 10, 2010
Summary for Week ending Oct 9th
A summary of last week - mostly in graphs.
The weak employment report all but guaranteed QE2 will be announced on November 3rd. The "whisper" number is for an announcement of an initial $500 billion in purchases of long term Treasury securities over the following six months.
 Click on graph for larger image.
This graph shows the job losses from the start of the employment recession, in percentage terms (as opposed to the number of jobs lost).
The dotted line is ex-Census hiring. The two lines have joined since the decennial Census is almost over.
The BLS reported:
1) Nonfarm payroll employment decreased by -95,000 in September
2) the Unemployment Rate was unchanged at 9.6%
3) Private employment increased by 64,000.
4) Government employment declined by 159,000 (mostly Census and local government).
5) Census 2010 employment decreased 77,000 in September.
6) so there were 18,000 payroll jobs lost ex-Census.
Note: This will be the last "ex-Census" report until the 2020 Census!
 The second graph shows the unemployment rate vs. recessions.
The unemployment rate has mostly moved sideways since falling to 9.7% in January 2010.
The economy has gained 334,000 jobs over the last year, and lost 7.75 million jobs since the recession started in December 2007. However the preliminary benchmark revision (to be announced with the January 2011 report) is for a downward revision of 366,000 jobs as of March 2010 - and that suggests over 8.1 million jobs have been lost since the start of the employment recession.
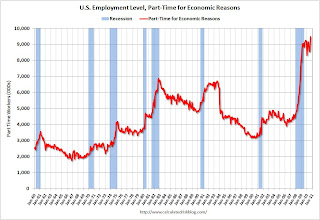 The number of workers only able to find part time jobs (or have had their hours cut for economic reasons) was at 9.472 million in September, up sharply from August.
 This is a new record high, and is obviously bad news.
These workers are included in the alternate measure of labor underutilization (U-6) that increased to 17.1% in September from 16.7% in August. The high for U-6 was 17.4% in October 2009.
 This graph shows the employment-population ratio; this is the ratio of employed Americans to the adult population.
The Employment-Population ratio was steady at 58.5% in September (the same low level as in August).
Note: the graph doesn't start at zero to better show the change.
The Labor Force Participation Rate was also steady at 64.7% in September. This is the percentage of the working age population in the labor force. The participation rate is well below the 66% to 67% rate that was normal over the last 20 years.
 The blue line is the number of workers unemployed for 27 weeks or more. The red line is the same data as a percent of the civilian workforce.
According to the BLS, there are 6.123 million workers who have been unemployed for more than 26 weeks and still want a job. This is 4.0% of the civilian workforce. It appears the number of long term unemployed has peaked ... Although this may be because people are giving up.
Employment Report Summary
The number of private sector jobs increased modestly by 64,000, otherwise the underlying details of the employment report were grim.
The negatives include the loss of 18,000 jobs ex-Census, the sharp increase in part time workers for economic reasons (and jump in U-6 unemployment rate), hours worked were flat (down for manufacturing workers), the employment-population ratio and labor force participation were flat at very low levels, and the unemployment rate was flat at a very high level.
This was another weak employment report.
 This graph shows the ISM non-manufacturing index (started in January 2008) and the ISM non-manufacturing employment diffusion index.
The September ISM Non-manufacturing index was at 53.2%, up from 51.5% in August - and above expectations of 52.0%. The employment index showed slight expansion in September at 50.2%, up from 48.2% in August. Note: Above 50 indicates expansion, below 50 contraction.
 This graph shows the office vacancy rate starting in 1991.
Reis is reporting the vacancy rate rose to 17.5% in Q3 2010, up from 17.4% in Q2 2010, and up from 16.6% in Q3 2009. The peak following the previous recession was 16.9%.
From the WSJ Signs of Recovery For Office Market
It appears the rate of increase in the vacancy rate has slowed - and rents may be stabilizing.
 Reis reported that the vacancy rate for large regional malls fell to 8.8% in Q3 from 9.0% in Q2. The vacancy rate at strip malls fell to 10.9%.
At regional malls, the record vacancy rate was 9.0% in Q2 2010 (Reis started tracking regional malls in 2000). The record vacancy rate for strip malls was in 1990 at 11.1%.
From Reuters: U.S. mall vacancy rate dips for first time in 3 years
And on apartment vacancies: From Ilaina Jonas at Reuters: US apartment vacancy rate drops sharply in 3rd qtr.
The national vacancy rate fell to 7.2 percent from 7.8 percent in the second quarter as renters soaked up 84,382 more units than were vacated ...This is for large apartment building in major cities, and it shows a significant drop in the vacancy rate.
Best wishes to all.


