 RSS Feed
 by Calculated Risk on 10/09/2010 09:57:00 PM
Saturday, October 09, 2010
IMF: Concern about fragile economy and exchange rates
Via MarketWatch: Summary of IMF meeting communique
Global economy: “Economic recovery is proceeding, but remains fragile and uneven across the membership. Faced with this source of potential stress, we underscore our strong commitment to continue working collaboratively to secure strong, sustainable and balanced growth and to refrain from policy actions that would detract from this shared goal. ... The rejection of protectionism in all its forms must remain a key element of our coordinated response to the crisis; renewed efforts are urgently needed to bring the Doha Round to a successful conclusion.”Not that anything will come of this, but clearly the IMF is still concerned about the "fragile" economy, and about exchange rates.
...
Mandate for international monetary stability: “While the international monetary system has proved resilient, tensions and vulnerabilities remain as a result of widening global imbalances, continued volatile capital flows, exchange rate movements and issues related to the supply and accumulation of official reserves. Given that these issues are critically important for the effective operation of the global economy and the stability of the international monetary system, we call on the Fund to deepen its work in these areas, including in-depth studies to help increase the effectiveness of policies to manage capital flows. We look forward to reviewing further analysis and proposals over the next year.”
Music: "Nobody Knows the Bubbles I've Seen"
by Calculated Risk on 10/09/2010 04:55:00 PM
Watch for the "Hoocoodanode" mention (A Tanta snark and the name of our message board) ...
Duration of Unemployment
by Calculated Risk on 10/09/2010 11:45:00 AM
An update by request ...
 Click on graph for larger image.
This graph shows the duration of unemployment as a percent of the civilian labor force. The graph shows the number of unemployed in four categories: less than 5 week, 6 to 14 weeks, 15 to 26 weeks, and 27 weeks or more.
Note: The BLS reports 15+ weeks, so the 15 to 26 weeks number was calculated.
In Setpember 2010, the number of unemployed for 27 weeks or more declined to 6.123 million (seasonally adjusted) from 6.249 million in August. It appears the number of long term unemployed has peaked, but it is still very difficult for these people to find a job - and this is a very serious employment issue.
The 5 to 14 week category declined in September, however the less than 5 week category continued to increase - and is now at the highest level since January 2010.
The less than 5 week category shows how the turnover in the labor market has changed. Back in the '70s and '80s there was much more turnover in the labor market. And that added turnover is a key reason the overall unemployment rate was higher in the early '80s recession than right now.
Note: Even though these numbers are all seasonally adjusted, they can't be added together to calculate the unemployment rate.
 And a repeat of a popular graph ...
The second graph shows the job losses from the start of the employment recession, in percentage terms (as opposed to the number of jobs lost).
The dotted line is ex-Census hiring. The two lines have joined since the decennial Census is almost over.
Best to all
Employment posts yesterday (with many graphs):
Unofficial Problem Bank List 877 Institutions
by Calculated Risk on 10/09/2010 07:27:00 AM
Note: this is an unofficial list of Problem Banks compiled only from public sources.
Here is the unofficial problem bank list for Oct 8, 2010.
Changes and comments from surferdude808:
The number of institutions on the Unofficial Problem Bank List remained unchanged this week at 877 but assets rose slightly from $416.1 billion to $417.3 billon.
Three institutions were removed with one because of action termination -- First National Bank and Trust Company ($296 million), and two others -- First National Bank & Trust Company in Larned ($34 million) and Clear Creek National Bank ($24 million) because they merged into other banks that are on the Unofficial Problem Bank List.
Additions this week include Valley Bank, Roanoke, VA ($763 million Ticker: VYFC); Fullerton Community Bank, FSB, Fullerton, CA ($705 million); and Fort Lee Federal Savings Bank, FSB, Fort Lee, NJ ($75 million), which received about $1.3 million of TARP capital in May 2009.
We anticipate for the OCC to release its actions from mid-August through mid-September next Friday.
Friday, October 08, 2010
Late night Foreclosure-Gate
by Calculated Risk on 10/08/2010 11:36:00 PM
From Dina ElBoghdady at the WaPo: Buyers anxiously await foreclosure deals to go through
From David Streitfeld and Nelson Schwartz at the NY Times: Largest U.S. Bank Halts Foreclosures in All States
Note: the media is in a frenzy about this, but I've hardly mentioned it other than linking to a few articles and posting Tom Lawler's piece about Who will, and who should "pay"?.
Best to all.
Employment posts today (with many graphs):
Daily Show on Foreclosure-Gate
by Calculated Risk on 10/08/2010 07:26:00 PM
While we wait for the FDIC ...
From the Daily Show (link if embed doesn't work) Foreclosure Crisis
| The Daily Show With Jon Stewart | Mon - Thurs 11p / 10c | |||
| Foreclosure Crisis | ||||
| ||||
Impact of estimated Benchmark Revision on Job Losses
by Calculated Risk on 10/08/2010 03:05:00 PM
This morning I mentioned the annual benchmark revision for the employment report - here are some more details, and a graph showing the impact on job losses.
As part of the employment report, the BLS released the preliminary annual benchmark revision of minus 366,000 payroll jobs. This will be finalized next February when the January 2011 employment report is released. Usually the preliminary estimate is pretty close to the final benchmark estimate.
 Click on graph for larger image.
This graph shows the impact of the preliminary benchmark revision on job losses in percentage terms from the start of the employment recession.
The red line on the graph is the current estimate, and the dotted line shows the impact of estimated coming benchmark revision. This puts the current payroll employment about 8.1 million jobs below the pre-recession peak in December 2007.
Using the preliminary benchmark estimate, this means that payroll employment in March 2010 was 366,000 lower than originally estimated. This is slightly larger than a normal adjustment (see table below). So in February 2011, the payroll numbers will be revised down to reflect this estimate. The number is then "wedged back" to the previous revision (March 2009).
For details on the benchmark revision process, see from the BLS: Methodology
"The benchmark adjustment, a standard part of the payroll survey estimation process, is a once-a-year re-anchoring of the sample-based employment estimates to full population counts available principally through unemployment insurance (UI) tax records filed by employers with State Employment Security Agencies."The following table shows the benchmark revisions since 1979.
| Year | Percent difference | Difference in thousands |
|---|---|---|
| 1979 | 0.5 | 447 |
| 1980 | -0.1 | -63 |
| 1981 | -0.4 | -349 |
| 1982 | -0.1 | -113 |
| 1983 | * | 36 |
| 1984 | 0.4 | 353 |
| 1985 | * | -3 |
| 1986 | -0.5 | -467 |
| 1987 | * | -35 |
| 1988 | -0.3 | -326 |
| 1989 | * | 47 |
| 1990 | -0.2 | -229 |
| 1991 | -0.6 | -640 |
| 1992 | -0.1 | -59 |
| 1993 | 0.2 | 263 |
| 1994 | 0.7 | 747 |
| 1995 | 0.5 | 542 |
| 1996 | * | 57 |
| 1997 | 0.4 | 431 |
| 1998 | * | 44 |
| 1999 | 0.2 | 258 |
| 2000 | 0.4 | 468 |
| 2001 | -0.1 | -123 |
| 2002 | -0.2 | -313 |
| 2003 | -0.2 | -122 |
| 2004 | 0.2 | 203 |
| 2005 | -0.1 | -158 |
| 2006 | 0.6 | 752 |
| 2007 | -0.2 | -293 |
| 2008 | -0.1 | -89 |
| 2009 | -0.7 | -902 |
| 2010 | -0.3 | -366 estimate |
Earlier employment posts today (with many graphs):
Unemployment by Level of Education and Employment Diffusion Indexes
by Calculated Risk on 10/08/2010 12:34:00 PM
By request ...
 Click on graph for larger image in new window.
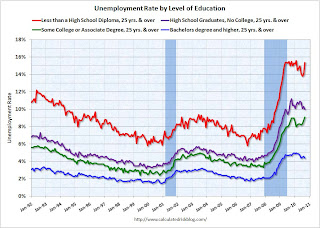
This graph shows the unemployment rate by four levels of education (all groups are 25 years and older).
Note that the unemployment rate increased sharply for all four categories in 2008 and into 2009.
Unfortunately this data only goes back to 1992 and only includes one previous recession (the stock / tech bust in 2001). Clearly education matters with regards to the unemployment rate - but education didn't seem to matter as far as the recovery rate in unemployment following the 2001 recession. All four groups recovered slowly.
Earlier this year, the group with "less than a high school diploma" recovered a little better than the more educated groups - possibly because of the tax credit related increase in construction - but that changed in September as the unemployment rate increased sharply.
For the group with some college or an associate degree, the unemployment rate is at a new high for this employment recession.
Diffusion Indexes
This is a little more technical ...
 The BLS diffusion index for total private employment declined to 49.8 from 54.1 in August. For manufacturing, the diffusion index declined to 46.3 from 48.2 in August.
Both indexes are down sharply from earlier this year.
Think of this as a measure of how widespread job gains are across industries. The further from 50 (above or below), the more widespread the job losses or gains reported by the BLS. From the BLS:
Figures are the percent of industries with employment increasing plus one-half of the industries with unchanged employment, where 50 percent indicates an equal balance between industries with increasing and decreasing employment.The increases in the diffusion indexes in 2009 and earlier this year, was a clear positive in the monthly employment reports. However the decrease in the diffusion indexes over the last few months (falling below 50% for both in September), is disappointing.
Earlier employment posts today (with many graphs):
Employment-Population Ratio, Part Time Workers, Unemployed over 26 Weeks
by Calculated Risk on 10/08/2010 09:50:00 AM
Here are a few more graphs based on the employment report ...
Percent Job Losses During Recessions, aligned at Bottom
 Click on graph for larger image.
This graph shows the job losses from the start of the employment recession, in percentage terms - this time aligned at the bottom of the recession (Both the 1991 and 2001 recessions were flat at the bottom, so the choice was a little arbitrary).
The dotted line shows the impact of Census hiring. As of the end of September, there were only 6,000 temporary 2010 Census workers still on the payroll. So the gap between the solid and dashed red lines is almost completely gone.
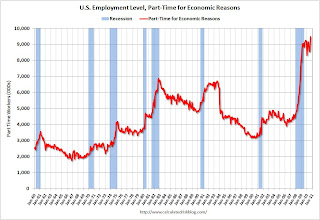
Part Time for Economic Reasons
 From the BLS report:
The number of persons employed part time for economic reasons (sometimes referred to as involuntary part-time workers) rose by 612,000 over the month to 9.5 million. Over the past 2 months, the number of such workers has increased by 943,000. These individuals were working part time because their hours had been cut back or because they were unable to find a full-time job.The number of workers only able to find part time jobs (or have had their hours cut for economic reasons) was at 9.472 million in September, up sharply from August.
This is a new record high, and is obviously bad news.
These workers are included in the alternate measure of labor underutilization (U-6) that increased to 17.1% in September from 16.7% in August. The high for U-6 was 17.4% in October 2009. Grim.
Employment-Population Ratio
The Employment-Population ratio was steady at 58.5% in September (the same as in August).
 This graph shows the employment-population ratio; this is the ratio of employed Americans to the adult population.
Note: the graph doesn't start at zero to better show the change.
The Labor Force Participation Rate was also steady at 64.7% in September. This is the percentage of the working age population in the labor force. The participation rate is well below the 66% to 67% rate that was normal over the last 20 years.
When the employment picture eventually improves, people will return to the labor force and the participation rate will increase from these very low levels. And that will put upward pressure on the unemployment rate.
Unemployed over 26 Weeks
 The blue line is the number of workers unemployed for 27 weeks or more. The red line is the same data as a percent of the civilian workforce.
According to the BLS, there are 6.123 million workers who have been unemployed for more than 26 weeks and still want a job. This is 4.0% of the civilian workforce. It appears the number of long term unemployed has peaked ... Although this may be because people are giving up.
The number of long term unemployed is staggering - still over 6 million people who are looking for a job.
Summary
The underlying details of the employment report were grim. The number of private sector jobs increased modestly by 64,000, otherwise ...
The negatives include the loss of 18,000 jobs ex-Census, the sharp increase in part time workers for economic reasons (and jump in U-6 unemployment rate), hours worked were flat (down for manufacturing workers), the employment-population ratio and labor force participation were flat at very low levels, and the unemployment rate was flat at a very high level.
Overall this was a weak report.
September Employment Report: 18K Jobs Lost ex-Census, 9.6% Unemployment Rate
by Calculated Risk on 10/08/2010 08:30:00 AM
Note: This will be the last "ex-Census" report this decade.
From the BLS:
Nonfarm payroll employment edged down (-95,000) in September, and the unemployment rate was unchanged at 9.6 percent, the U.S. Bureau of Labor Statistics reported today. Government employment declined (-159,000), reflecting both a drop in the number of temporary jobs for Census 2010 and job losses in local government. Private-sector payroll employment continued to trend up modestly (+64,000).Census 2010 hiring decreased 77,000 in September. Non-farm payroll employment decreased 18,000 in September ex-Census.
Both July and August payroll employment were revised down. The change in total nonfarm payroll employment for July was revised from -54,000 to -66,000, and the change for August was revised from -54,000 to -57,000.
 Click on graph for larger image.
This graph shows the unemployment rate vs. recessions.
Nonfarm payrolls decreased by 95 thousand in August. The economy has gained 334 thousand jobs over the last year, and lost 7.75 million jobs since the recession started in December 2007.
The second graph shows the job losses from the start of the employment recession, in percentage terms (as opposed to the number of jobs lost).The dotted line is ex-Census hiring. The two lines have joined since the decennial Census is almost over.
For the current employment recession, employment peaked in December 2007, and this recession is by far the worst recession since WWII in percentage terms, and 2nd worst in terms of the unemployment rate (only early '80s recession with a peak of 10.8 percent was worse).
Note: The preliminary benchmark payroll revision is minus 366,000 jobs. This is a little larger than the normal adjustment (last year was especially large). The actual adjustment will be made in February 2011. This is the preliminary estimate of the annual revision, from the BLS: "The benchmark adjustment, a standard part of the payroll survey estimation process, is a once-a-year re-anchoring of the sample-based employment estimates to full population counts available principally through unemployment insurance (UI) tax records filed by employers with State Employment Security Agencies."
This is another weak employment report. I'll have much more soon ...
For more, see next post: Employment-Population Ratio, Part Time Workers, Unemployed over 26 Weeks
Thursday, October 07, 2010
NY Times: Foreclosure-Gate starting to impact home sales
by Calculated Risk on 10/07/2010 10:23:00 PM
From Andrew Martin and David Streitfeld at the NY Times: Flawed Foreclosure Documents Thwart Home Sales
[A]s a scandal unfolds over mortgage lenders’ shoddy preparation of foreclosure documents, the fallout is beginning to hammer the housing market, especially in states like Florida where distressed properties are abundant. ... the agents are being told the freeze will last 30 to 90 days ...This will probably just be a delay. And the delays will mostly be in the judicial foreclosure states, although the story has one example of a house withdrawn from the market in California.
[One Florida] agency had 35 deals that were supposed to close this month. As of Thursday, Fannie had postponed 11 of them.
Video of Krugman, Feldstein and Hatzius from Oct 5th
by Calculated Risk on 10/07/2010 08:00:00 PM
Here is the video of Professors Paul Krugman and Martin Feldstein (former Reagan advisor and NBER president), and Jan Hatzius, chief economist of Goldman Sachs:
The Economic Policy Institute conference on October 5, 2010
I'm not sure who is the most pessimistic.
Lawler: “Foreclosure-Gate”: Who Will, and Who Should “Pay”?
by Calculated Risk on 10/07/2010 05:09:00 PM
CR Note: This is from economist Tom Lawler, who joked today: Maybe large servicers should be forced to put up billions in "claims fund," like BP? (the latter "caused" slime, while the former are just "slimy"!)
The mortgage-foreclosure debacle, which started with a story about a GMAC “technicality” (and included a “GMAC denies foreclosure moratorium” story) but which quickly “ballooned” as more mortgage servicers were “implicated,” has now exploded into a full-blown “issue” of unknown proportions. One thing is pretty clear – many larger mortgage servicers simply “screwed up” by trying to deal with the surge in foreclosures by taking shortcuts to keep costs down, and this mistake has blown up in their faces.
But … is it just “their” faces?
It seems pretty clear that one of the outcomes of the recent “revelations” is that many foreclosures will be postponed; there will be more “refilings” of foreclosure petitions that will cost money; more borrowers facing foreclosures will hire lawyers, and servicers will have to reimburse more borrowers for legal fees; and some foreclosures could be delayed for quite a while. It is unclear at this point whether there will be any significant number of completed foreclosures that might be reversed, but if so that’s gonna cost! Net, there are going to be significant costs that someone is going to have to bear.
But who will bear those costs? Will it be mortgage servicers? Well, if they also own the mortgage, sure. But what about for loans they service for others (including private-label securities, Fannie, Freddie, FHA, VA, …)? Who’s a’ gonna’ pay?
From a “who should” perspective, any increase in losses associated with mistakes made by mortgage servicers, especially if those mistakes involved not following state foreclosure laws, which is a “violation” of most servicing contracts, the answer is crystal clear – the mortgage servicers. But how easy is it going to be to determine losses associated with mistakes by mortgage servicers? What are the “rules” on what a servicer can “recoup” in terms of costs associated with foreclosure when a servicer makes a mistake in private-label deals? With loans serviced for Fannie and Freddie, or FHA? What about delays in foreclosures clearly associated with servicer mistakes, which generally result in increased loss severities? Mortgage investors shouldn’t bear those costs, but how can they be sure they won’t?
What if there is a national “foreclosure moratorium” triggered by mortgage servicer mistakes that ultimately increase the severity of losses? Who “pays the price” in reality, as opposed to who “should?” Will there be lawsuits from mortgage investors whose loans and/or loans backing securities they own find that their incidence and/or severity of loss was adversely impacted by servicers mistakes, and will they be able to ensure that servicers who “screwed up” bear those losses instead of them?
I don’t know the “technically right” answers to any of the above questions, but it is crystal clear that the “right” answer should be that mortgage servicers who messed up should bear all of the costs associated with their mess up.
CR Note: This is from economist Tom Lawler
Consumer Credit declines in August
by Calculated Risk on 10/07/2010 03:19:00 PM
The Federal Reserve reports:
In August, total consumer credit decreased at an annual rate of 1-3/4 percent. Revolving credit decreased at an annual rate of 7-1/4 percent, and [Non] revolving credit increased at an annual rate of 1-1/4 percent.
 Click on graph for larger image in new window.
This graph shows the increase in consumer credit since 1978. The amounts are nominal (not inflation adjusted).
Revolving credit (credit card debt) is off 15.2% from the peak. Non-revolving debt (auto, furniture, and other loans) is off 1.1% from the peak. Note: Consumer credit does not include real estate debt. This has been very different from previous recessions with the decline in non-revolving debt.
Fed's Fisher: QE2 "debate still to take place"
by Calculated Risk on 10/07/2010 01:33:00 PM
From Dallas Fed President Richard Fisher: To Ease or Not to Ease? What Next for the Fed?
I am afraid that despite recent speculation in the press and among market pundits, we did little at that meeting to settle the debate as to whether the Committee might actually engage in further monetary accommodation, or what has become known in the parlance of Wall Street as “QE2,” a second round of quantitative easing. It would be marked by an expansion of our balance sheet beyond its current footings of $2.3 trillion through the purchase of additional Treasuries or other securities. To be sure, some in the marketplace―including those with the most to gain financially―read the tea leaves of the statement as indicating a bias toward further asset purchases, executed either in small increments or in a “shock-and-awe” format entailing large buy-ins, leaving open only the question of when.Fisher suggests the debate on QE2 isn't over (he opposes QE2). However he is not a voting member of the FOMC this year (an alternate). He is always fun to read - but barring some upside surprise, I think QE2 will be announced on November 3rd.
Since the FOMC meeting, a handful of my colleagues have fanned further speculation about QE2 by signaling their personal positions on the matter quite openly in recent speeches and interviews in the major newspapers. Hence the headline in yesterday’s Wall Street Journal, “Central Banks Open Spigot,” a declaration that surely gave the ghosts of central bankers past the shivers and sent a tingle down the spine of gold bugs from Bemidji to Beijing.
...
There is a great deal of legitimate debate still to take place within the FOMC on the subject of quantitative easing and the pros and cons and costs and benefits of further monetary accommodation. Whatever we might do, if anything, must be consistent with long-term price stability and not add to the nightmare of confusing signals already being sent to job creators.
What will we likely decide at the next FOMC meeting? ... “You’ll find out soon enough.”
Weekly Initial Unemployment Claims decrease
by Calculated Risk on 10/07/2010 08:41:00 AM
The DOL reports on weekly unemployment insurance claims:
In the week ending Oct. 2, the advance figure for seasonally adjusted initial claims was 445,000, a decrease of 11,000 from the previous week's revised figure of 456,000. The 4-week moving average was 455,750, a decrease of 3,000 from the previous week's revised average of 458,750.
 Click on graph for larger image in new window.
This graph shows the 4-week moving average of weekly claims since January 2000.
The dashed line on the graph is the current 4-week average. The four-week average of weekly unemployment claims decreased this week by 3,000 to 455,750.
The 4-week moving average has been moving sideways at an elevated level since last December - and that suggests a weak job market.
Reis: Mall vacancy rate declines slightly in Q3
by Calculated Risk on 10/07/2010 02:13:00 AM
 Click on graph for larger image in new window.
From Reuters: U.S. mall vacancy rate dips for first time in 3 years
The national vacancy rate for large regional malls fell to 8.8 percent in the third quarter from 9.0 percent in the second ... Asking rents were unchanged at $38.72 per square foot after declining for seven straight quarters ... At the strip malls ... vacancy was 10.9 percent.At regional malls, the record vacancy rate was 9.0% in Q2 2010 (Reis started tracking regional malls in 2000). The record vacancy rate for strip malls was in 1990 at 11.1%.
"While retail properties were offered a reprieve from massive deterioration, it is too early to say that the market has bottomed," said Victor Calanog, Reis director of research.
Many retailers have long-term leases that expire soon. The weak U.S. economy may prompt retail tenants not to renew, pushing up vacancy again, he said.
Wednesday, October 06, 2010
Roubini: 40% Chance of Double-dip Recession
by Calculated Risk on 10/06/2010 06:59:00 PM
From MarketWatch: Roubini: 40% chance of double-dip recession
There is a 40% probability of a double-dip recession, but you don't need one for the global economy to feel like it is in a deep, continuing recession, said Nouriel Roubini ... "You don't need another Lehman story, you don't need a major loss," said Roubini at an American Enterprise Institute event. "You can have death by a thousand cuts."I'm not sure how you assign precise odds (yesterday Goldman Sachs put the odds at about 25% to 30%), but I think the most likely outcome is sluggish growth. And that means the economy will remain susceptible to shocks.
And, as Roubini noted, it doesn't matter if the economy is technically in a recession - it will feel like a recession to millions of Americans as long as jobs are scarce and incomes are under pressure.
Seasonal Retail Hiring Outlook: "Dim"
by Calculated Risk on 10/06/2010 03:30:00 PM
Typically retail companies start hiring for the holiday season in October, and really increase hiring in November. Here is a graph that shows the historical net retail jobs added for October, November and December by year and a forecast for 2010.
 Click on graph for larger image in new window.
This really shows the collapse in retail hiring in 2008 and the weak recovery in 2009. This also shows how the season has changed over time - back in the '80s, retailers hired mostly in December. Now the peak month is November, and many retailers start hiring seasonal workers in October.
From Stephanie Clifford and Catherine Rampell at the NY Times: Dim Outlook for Holiday Jobs
As the economy sputters, prospects are dimming for unemployed workers who were banking on a seasonal retail job to carry them through the holidays. ...Last year - looking at the graph - retailers held back on hiring in October and waited until November (as Challenger Gray expects to happen again this year). The increase to 600,000 is significant, but still below the levels of 1992 through 2007 - except for the recession year of 2001.
The recruiting firm Challenger, Gray & Christmas, forecasts that retailers will add up to 600,000 jobs in October, November and December, compared with a net gain of 501,400 holiday jobs over the same three months in 2009.
...
Challenger Gray expects that companies may wait to hire until November or December — once they have a feel for how much consumers are willing to spend.
This hiring will be watched closely, and I suspect seasonal hiring will be stronger than in 2009, but well below the 700+ thousand jobs in 2004 through 2007.
Note: Clifford and Rampell also note that the supply chain for retailers is long - and many retailers placed orders earlier this year when the outlook seemed brighter to some (not to those paying attention!).
While retailers are just now making plans for Christmas hiring, they had to make plans for Christmas merchandise months ago, and that lag might create some inventory problems.Last year the retailers ran lean on inventory, but if this year is slow, there will be plenty of discounting.
Geithner calls for "more flexible, more market-oriented exchange rate systems"
by Calculated Risk on 10/06/2010 01:49:00 PM
From Treasury Secretary Geithner: Remarks at the Brookings Institution
[F]or the recovery to be sustainable, there must ... be a change in the pattern of global growth. For too long, many countries oriented their economies toward producing for export rather than consuming at home, counting on the United States to import many more of their goods and services than they bought of ours.This was aimed primarily at China, but also at other countries with export driven economies. Everyone can't devalue at once ...
The United States will do its part to achieve this adjustment. Private savings have increased significantly, and, as the recovery strengthens, we will bring down our fiscal deficits to a sustainable level.
But as America saves more, countries overly reliant on exports to us for their own growth will need to change their policies, or else global growth will slow and all of us will be worse off. Countries that chronically run large surpluses need to undertake policies that will boost their domestic demand.
...
That brings me to the second policy challenge: we believe it is very important to see more progress by the major emerging economies to more flexible, more market-oriented exchange rate systems. This is particularly important for those countries whose currencies are significantly undervalued.
This is a problem because when large economies with undervalued exchange rates act to keep the currency from appreciating, that encourages other countries to do the same.
This sets off a damaging dynamic, described first by my former colleague Ted Truman, as "competitive non appreciation." Over time, more and more countries face stronger pressure to lean against the market forces pushing up the value of their currencies. The collective impact of this behavior risks either causing inflation and asset bubbles in emerging economies, or else depressing consumption growth and intensifying short-term distortions in favor of exports.
This is a multilateral problem. It is unfair to countries that were already running more flexible regimes and let their currencies appreciate. And it requires a cooperative approach to solve, because emerging economies individually will be less likely to move, unless they are confident other countries would move with them.
This problem exposes once again the need for an effective multilateral mechanism to encourage economies running current account surpluses to abandon export-oriented policies, let their currencies appreciate, and strengthen domestic demand.


