 RSS Feed
 by Calculated Risk on 4/23/2010 10:00:00 AM
Showing posts with label New Home Sales. Show all posts
Showing posts with label New Home Sales. Show all posts
Friday, April 23, 2010
New Home Sales at 411K in March
The Census Bureau reports New Home Sales in March were at a seasonally adjusted annual rate (SAAR) of 411 thousand. This is an increase from the revised rate of 324 thousand in February (revised from 308 thousand). Click on graph for larger image in new window.
The first graph shows monthly new home sales (NSA - Not Seasonally Adjusted).
Note the Red columns for 2010. In March 2010, 38 thousand new homes were sold (NSA).
The record low for March was 31 thousand in 2009.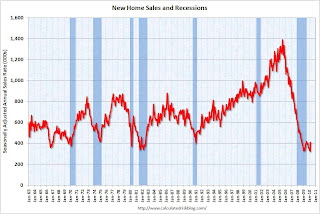 The second graph shows New Home Sales vs. recessions for the last 45 years.
Sales of new single-family houses in March 2010 were at a seasonally adjusted annual rate of 411,000 ... This is 26.9 percent (±21.1%) above the revised February rate of 324,000 and is 23.8 percent (±18.7%) above the March 2009 estimate of 332,000.And another long term graph - this one for New Home Months of Supply.
 Months of supply declined to 6.7 in March from 8.6 in February. This is significantly below the all time record of 12.4 months of supply set in January 2009, but still higher than normal.
The seasonally adjusted estimate of new houses for sale at the end of March was 228,000. This represents a supply of 6.7 months at the current sales rate.
 The final graph shows new home inventory.
 New home sales are counted when the contract is signed, so this pickup in activity is probably related to the tax credit. Note that that a few thousand extra sales NSA in March can make a huge difference in the SAAR.
Any further pickup in sales because of the tax credit will happen in April and then sales will probably decline again.
Wednesday, March 24, 2010
New Home Sales at Record Low in February
by Calculated Risk on 3/24/2010 10:00:00 AM
The Census Bureau reports New Home Sales in February were at a seasonally adjusted annual rate (SAAR) of 308 thousand. This is a new record low and a decrease from the revised rate of 315 thousand in January (revised from 309 thousand). Click on graph for larger image in new window.
The first graph shows monthly new home sales (NSA - Not Seasonally Adjusted).
Note the Red columns for 2010. In February 2010, 24 thousand new homes were sold (NSA).
This is below the previous record low of 29 thousand hit three times; in February 2009, 1982 and 1970. The second graph shows New Home Sales vs. recessions for the last 45 years. New Home sales fell off a cliff, but after increasing slightly, are now 6% below the previous record low in January 2009.
Sales of new single-family houses in February 2010 were at a seasonally adjusted annual rate of 308,000, according to estimates released jointly today ... This is 2.2 percent (±15.3%)* below the revised January rate of 315,000 and is 13.0 percent (±12.2%) below the February 2009 estimate of 354,000.And another long term graph - this one for New Home Months of Supply.
 There were 9.2 months of supply in February. Rising, but still significantly below the all time record of 12.4 months of supply set in January 2009.
The seasonally adjusted estimate of new houses for sale at the end of February was 236,000. This represents a supply of 9.2 months at the current sales rate.
 The final graph shows new home inventory.
 Note that new home inventory does not include many condos (especially high rise condos), and areas with significant condo construction will have much higher inventory levels.
New home sales are far more important for the economy than existing home sales, and new home sales will remain under pressure until the overhang of excess housing inventory declines much further. Obviously this is another extremely weak report.
Wednesday, March 17, 2010
Comparing New Home Sales and Housing Starts
by Calculated Risk on 3/17/2010 09:29:00 PM
 Click on graph for larger image in new window.
A frequently asked question is how do new home sales compare to single family housing starts (both series from the Census Bureau). This graph shows the two series - although they track each other, the two series cannot be directly compared.
For starts of single family structures, the Census Bureau includes owner built units and units built for rent that are not included in the new home sales report. From the Census Bureau: Comparing New Home Sales and New Residential Construction
We are often asked why the numbers of new single-family housing units started and completed each month are larger than the number of new homes sold. This is because all new single-family houses are measured as part of the New Residential Construction series (starts and completions), but only those that are built for sale are included in the New Residential Sales series. We categorize new residential construction into four intents, or purposes:However it is possible to compare "Single Family Starts, Built for Sale" to New Home sales on a quarterly basis. The Q4 quarterly report showed that there were 71,000 single family starts, built for sale, in Q4 2009, and that is less than the 82,000 new homes sold for the same period. This data is Not Seasonally Adjusted (NSA).
Built for sale (or speculatively built): the builder is offering the house and the developed lot for sale as one transaction this includes houses where ownership of the entire property including the land is acquired ("fee simple") as well as houses sold for cooperative or condominium ownership. These are the units measured in the New Residential Sales series.
Contractor-built (or custom-built): the house is built for the landowner by a general contractor, or the land and the house are purchased in separate transactions.
Owner-built: the house is built entirely by the landowner or by the landowner acting as his/her own general contractor.
Built for rent: the house is built with the intent that it be placed on the rental market when it is completed.
Q4 was the 9th consecutive quarter with homebuilders selling more homes than they start.
Note: new home sales are reported when contracts are signed, so it is appropriate to compare sales to starts (as opposed to completions). This is not perfect because homebuilders do build spec homes and many builders were stuck with some “unintentional spec homes” because of cancellations during the bust.
 This graph provides a quarterly comparison of housing starts and new home sales. In 2005, and most of 2006, starts (blue) were higher than sales (red), and inventories of new homes increased. For the last 9 quarters, starts have been below sales – and new home inventories have been falling.
It is possible that the streak will be broken in Q1, and that the builders started more single family homes, built for sale, than they sold. This is because a number of builders started some extra spec homes in anticipation of a "buying rush" in April before the tax credit expires. To qualify for the tax credit, the homes have to be finished before June 30th - and it takes close to 6 months to build a home - so some builders started a few extra homes in January that they hope will sold in Q2.
Wednesday, February 24, 2010
New Home Sales fall to Record Low in January
by Calculated Risk on 2/24/2010 10:15:00 AM
Note: See previous post for video and discussion of Bernanke's testimony.
The Census Bureau reports New Home Sales in January were at a seasonally adjusted annual rate (SAAR) of 309 thousand. This is a record low and a sharp decrease from the revised rate of 348 thousand in December. Click on graph for larger image in new window.
The first graph shows monthly new home sales (NSA - Not Seasonally Adjusted).
Note the Red column for 2010. In January 2010, 21 thousand new homes were sold (NSA).
This is below the previous record low of 24 thousand in January 2009. The second graph shows New Home Sales vs. recessions for the last 45 years. New Home sales fell off a cliff, but after increasing slightly, are now 6% below the previous record low in January 2009.
Sales of new single-family houses in January 2010 were at a seasonally adjusted annual rate of 309,000 ... This is 11.2 percent (±14.0%)* below the revised December rate of 348,000 and is 6.1 percent (±15.1%)* below the January 2009 estimate of 329,000.And another long term graph - this one for New Home Months of Supply.
 There were 9.1 months of supply in January. Rising, but still significantly below the all time record of 12.4 months of supply set in January 2009.
The seasonally adjusted estimate of new houses for sale at the end of January was 234,000. This represents a supply of 9.1 months at the current sales rate.
 The final graph shows new home inventory.
 Note that new home inventory does not include many condos (especially high rise condos), and areas with significant condo construction will have much higher inventory levels.
Months-of-supply and inventory have both peaked for this cycle, but sales have set a new record low. New home sales are far more important for the economy than existing home sales, and new home sales will remain under pressure until the overhang of excess housing inventory declines much further.
Obviously this is another extremely weak report.
Wednesday, January 27, 2010
New Home Sales Decline Sharply in December
by Calculated Risk on 1/27/2010 10:00:00 AM
The Census Bureau reports New Home Sales in December were at a seasonally adjusted annual rate (SAAR) of 342 thousand. This is a sharp decrease from the revised rate of 370 thousand in November (revised from 355 thousand). Click on graph for larger image in new window.
The first graph shows monthly new home sales (NSA - Not Seasonally Adjusted).
Note the Red columns for 2009. In December 2009, a record low 23 thousand new homes were sold (NSA); this ties the previous record low set in December 1966.
Sales in December 2008 were at 26 thousand.  The second graph shows New Home Sales vs. recessions for the last 45 years. New Home sales fell off a cliff, but after increasing slightly, are now only 4% above the low in January.
Sales of new one-family houses in December 2009 were at a seasonally adjusted annual rate of 342,000 ... This is 7.6 percent (±14.6%)* below the revised November rate of 370,000 and is 8.6 percent (±15.2%)* below the December 2008 estimate of 374,000.And another long term graph - this one for New Home Months of Supply.
 There were 8.1 months of supply in December. Rising, but still significantly below the all time record of 12.4 months of supply set in January.
The seasonally adjusted estimate of new houses for sale at the end of December was 231,000. This represents a supply of 8.1 months at the current sales rate.
 The final graph shows new home inventory.
 Note that new home inventory does not include many condos (especially high rise condos), and areas with significant condo construction will have much higher inventory levels.
Months-of-supply and inventory have both peaked for this cycle, and sales might have bottomed too. New home sales are far more important for the economy than existing home sales, and new home sales will remain under pressure until the overhang of excess housing inventory declines much further.
Obviously this is another very weak report. I expect the Fed will change their statement on housing today. I'll have more later ...
Wednesday, December 23, 2009
New Home Sales Decrease Sharply in November
by Calculated Risk on 12/23/2009 10:00:00 AM
The Census Bureau reports New Home Sales in November were at a seasonally adjusted annual rate (SAAR) of 355 thousand. This is a sharp decrease from the revised rate of 400 thousand in October (revised down from 430 thousand). Click on graph for larger image in new window.
The first graph shows monthly new home sales (NSA - Not Seasonally Adjusted).
Note the Red columns for 2009. In November 2009, a record low 25 thousand new homes were sold (NSA); the previous record low was 26 thousand in November 1966.
Sales in November 2009 were below November 2008 (27 thousand).  The second graph shows New Home Sales vs. recessions for the last 45 years. New Home sales fell off a cliff, but after increasing slightly, are now only 8% above the low in January.
Sales of new one-family houses in November 2009 were at a seasonally adjusted annual rate of 355,000 ... This is 11.3 percent (±11.0%) below the revised October rate of 400,000 and is 9.0 percent (±15.3%)* below the November 2008 estimate of 390,000.And another long term graph - this one for New Home Months of Supply.
 There were 7.9 months of supply in November - significantly below the all time record of 12.4 months of supply set in January.
The seasonally adjusted estimate of new houses for sale at the end of November was 235,000. This represents a supply of 7.9 months at the current sales rate.
 The final graph shows new home inventory.
 Note that new home inventory does not include many condos (especially high rise condos), and areas with significant condo construction will have much higher inventory levels.
Months-of-supply and inventory have both peaked for this cycle, and sales have probably bottomed too. New home sales are far more important for the economy than existing home sales, and new home sales will remain under pressure until the overhang of existing housing inventory declines much further.
Obviously this is a very weak report. I'll have more later ...
Wednesday, November 25, 2009
New Home Sales in October
by Calculated Risk on 11/25/2009 10:00:00 AM
The Census Bureau reports New Home Sales in October were at a seasonally adjusted annual rate (SAAR) of 430 thousand. This is an increase from the revised rate of 405 thousand in September (revised from 402 thousand). Click on graph for larger image in new window.
The first graph shows monthly new home sales (NSA - Not Seasonally Adjusted).
Note the Red columns for 2009. In October 2009, 35 thousand new homes were sold (NSA); the record low was 29 thousand in October 1981; the record high for October was 105 thousand in 2005. This is the 6th lowest sales for October since the Census Bureau started tracking sales in 1963.
Sales in October 2009 were above October 2008 (32 thousand). This is the first year over same month increase since October 2005. The second graph shows New Home Sales vs. recessions for the last 45 years. New Home sales fell off a cliff, but are now 31% above the low in January.
Sales of new one-family houses in October 2009 were at a seasonally adjusted annual rate of 430,000 ... This is 6.2 percent (±17.6%) above the revised September rate of 405,000 and is 5.1 percent (±14.9%) above the October 2008 estimate of 409,000.And another long term graph - this one for New Home Months of Supply.
 There were 6.7 months of supply in October - significantly below the all time record of 12.4 months of supply set in January.
The seasonally adjusted estimate of new houses for sale at the end of October was 239,000. This represents a supply of 6.7 months at the current sales rate.
 The final graph shows new home inventory.
 Note that new home inventory does not include many condos (especially high rise condos), and areas with significant condo construction will have much higher inventory levels.
Months-of-supply and inventory have both peaked for this cycle, and sales have probably bottomed too. New home sales are far more important for the economy than existing home sales, and new home sales will remain under pressure until the overhang of existing housing inventory declines much further.
I'll have more later ...
Wednesday, October 28, 2009
New Home Sales Decrease in September
by Calculated Risk on 10/28/2009 10:00:00 AM
The Census Bureau reports New Home Sales in September were at a seasonally adjusted annual rate (SAAR) of 402 thousand. This is a decrease from the revised rate of 417 thousand in August (revised from 429 thousand). Click on graph for larger image in new window.
The first graph shows monthly new home sales (NSA - Not Seasonally Adjusted).
Note the Red columns for 2009. Sales in September 2009 (31 thousand) were below September 2008 (35 thousand). This is the 3rd lowest sales for September since the Census Bureau started tracking sales in 1963.
In September 2009, 31 thousand new homes were sold (NSA); the record low was 28 thousand in September 1981; the record high for September was 99 thousand in 2005. The second graph shows New Home Sales vs. recessions for the last 45 years. New Home sales fell off a cliff, but are now 22% above the low in January.
Sales of new one-family houses in September 2009 were at a seasonally adjusted annual rate of 402,000 ...And another long term graph - this one for New Home Months of Supply.
This is 3.6 percent (±10.2%)* below the revised August rate of 417,000 and is 7.8 percent (±12.0%)* below the September 2008 estimate of 436,000.
 There were 7.5 months of supply in September - significantly below the all time record of 12.4 months of supply set in January.
The seasonally adjusted estimate of new houses for sale at the end of September was 251,000. This represents a supply of 7.5 months at the current sales rate.
 The final graph shows new home inventory.
 Note that new home inventory does not include many condos (especially high rise condos), and areas with significant condo construction will have much higher inventory levels.
Months-of-supply and inventory have both peaked for this cycle, and new homes sales has probably also bottomed for this cycle. Sales were probably impacted by the end of the first-time home buyer tax credit (because of timing, new home sales are impacted before existing home sales).
New home sales are far more important for the economy than existing home sales, and new home sales will remain under pressure until the overhang of existing homes declines much further.
I'll have more later ...
Saturday, October 03, 2009
The Impact of the Declining Homeownership Rate
by Calculated Risk on 10/03/2009 05:00:00 PM
This is an update to a 2007 post: Home Builders and Homeownership Rates1
From 1995 to 2005, the U.S. homeownership rate climbed from 64% to 69%, or about 0.5% per year. Click on graph for larger image in new window.
The first graph shows the homeownership rate since 1965. Note the scale starts at 60% to better show the recent change.
The reasons for the change in homeownership rate are discussed in the 2007 post ( a combination of demographics and changes in mortgage "innovation"), but here are two key points: 1) During the boom, the change in the homeownership rate added about half a million new homeowners per year, as compared to a steady homeownership rate, 2) the homeownership rate (red arrow is trend) is now declining.
The U.S. population has been growing at close to 3 million people per year on average, and there are about 2.4 people per household. Assuming no change in these rates, there would be close to 1.25 million new households formed per year in the U.S. (The are just estimates, and fewer households are formed during a recession - a key problem right now).
Since about 2/3s of all households are owner occupied, an increase of 1.25 million households per year would imply an increase in homes owned of about 800K+ per year. If an additional 500K per year moved to homeownership - as indicated by the increase in the homeownership rate from 1995 to 2005 - then the U.S. would have needed 1.3 million additional owner occupied homes per year.
Important note: these number can't be compared directly to the Census Bureau housing starts and new home sales. There are many other factors that must be accounted for to compare the numbers.
During that same period, since about 1/3 of all households rent, the U.S. would have needed about 400K+ new rental units per year, minus the 500K per year of renters moving to homeownership. So the U.S. needed fewer rental units per year from 1995 to 2005. The second graph shows the number of occupied (blue) and vacant (red) rental units in the U.S. (all data from the Census Bureau).
Sure enough, the number of rental units in the U.S. peaked in early 1995 and declined slowly until 2005. The builders didn't stop building apartment units in 1995, instead the decline in the total units came from condo conversions and units being demolished (a fairly large number of rental and owner owned units are demolished every year).
Even though the total number of rental units was declining, this didn't completely offset the number of renters moving to homeownership, so the rental vacancy rate started moving up - from about 8% in 1995 to over 10% in 2004.
Since 2004 there has been a surge in rental units. Most of this increase is not new apartment buildings, rather a combination of investors buying REOs for cash flow, condo "reconversions", builders changing the intent of new construction (started as condos but became rentals), flippers becoming landlords, or homeowners renting their previous homes or 2nd homes instead of selling. This increase in rental units is more than offsetting the decline in the homeowership rate, and the rental vacancy rate was at a record 10.6% in Q2. (and will probably be over 11% soon because of the "first-time" homebuyer tax credit).
This increase in the homeownership rate, from 1995 through 2005, meant the homebuilders had the wind to their backs. Instead of 800K of new owner demand per year (plus replacement of demolished units, and second home buying), the homebuilders saw an additional 500K of new owner demand during the period 1995 to 2005. This doesn't include the extra demand from speculative buying. Some of this demand was satisfied by condo conversions and owner built units, but the builders definitely benefited from the increase in homeownership rate.
Looking ahead, if the homeownership rate stays steady, the demand for net additional homeowner occupied units would fall back to 800K or so per year (assuming steady population growth and persons per household). However the homeownership rate is declining, and this is now a headwind for the builders.
It appears the rate is declining at about 0.5% per year. This means the net demand for owner occupied units would be 833K minus about 500K per year or about 333K per year - about 25% of the net demand for owner occupied units for the period 1995 to 2005. (Not including replacing demolished units and 2nd home buying).
Although we can't compare this number directly to new home sales (because of 2nd home buying, replacement of demolished units, and other factors) this does suggest new home sales will probably remain at a low level until the homeownership rate stops declining. The third graph shows New Home Sales for the last 45 years. the Census Bureau reported: "Sales of new one-family houses in August 2009 were at a seasonally adjusted annual rate of 429,000."
Once the homeownership rate stops declining - probably at about the same time the excess existing home units are mostly absorbed - new home sales will probably increase to a steady state rate based on population growth. However this level will be substantially below the average for the period from 1995 to 2005 when the homebuilders benefited from the increasing homeownership rate.
The "first-time" homebuyer tax credit (and new homebuyer tax credit in California) probably boosted new home sales a little this year, so the homeownership rate might increase in the 2nd half of 2009. However that increase will probably be temporary, and the homeownership rate will probably start declining again.
Key points:
1 A special thanks to Jan Hatzius. Several of the ideas for this post are from his piece: "Housing (Still) Holds the Key to Fed Policy", Nov 27, 2007
Friday, September 25, 2009
New Home Sales Flat in August
by Calculated Risk on 9/25/2009 10:00:00 AM
The Census Bureau reports New Home Sales in August were at a seasonally adjusted annual rate (SAAR) of 429 thousand. This is a slight increase from the revised rate of 426 thousand in July (revised from 433 thousand). Click on graph for larger image in new window.
The first graph shows monthly new home sales (NSA - Not Seasonally Adjusted).
Note the Red columns for 2009. Sales in August 2009 were the same as August 2008. This is the 4th lowest sales for August since the Census Bureau started tracking sales in 1963.
In August 2009, 38 thousand new homes were sold (NSA); the record low was 34 thousand in August 1981; the record high for August was 110 thousand in 2005. The second graph shows New Home Sales vs. recessions for the last 45 years. New Home sales fell off a cliff, but are now 30% above the low in January.
Sales of new one-family houses in August 2009 were at a seasonally adjusted annual rate of 429,000 ...And another long term graph - this one for New Home Months of Supply.
This is 0.7 percent (±16.2%)* above the revised July rate of 426,000, but is 3.4 percent (±13.3%) below the August 2008 estimate of 444,000.
 There were 7.3 months of supply in August - significantly below the all time record of 12.4 months of supply set in January.
The seasonally adjusted estimate of new houses for sale at the end of August was 262,000. This represents a supply of 7.3 months at the current sales rate.
 The final graph shows new home inventory.
 Note that new home inventory does not include many condos (especially high rise condos), and areas with significant condo construction will have much higher inventory levels.
Months-of-supply and inventory have both peaked for this cycle, and new homes sales has probably also bottomed for this cycle. However any further recovery in sales will likely be modest because of the huge overhang of existing homes for sale.
I'll have more later ...
Wednesday, August 26, 2009
Distressing Gap: Ratio of Existing to New Home Sales
by Calculated Risk on 8/26/2009 11:18:00 AM
For graphs based on the new home sales report this morning, please see: New Home Sales Increase in July
According to the Q2 Campbell national survey of real estate agents, over 63% of sales in Q2 were distressed. The number of distressed sales has probably declined in Q3, but it is still very high. The July NAR survey shows "distressed homes accounted for 31 percent of transactions", but their survey is very limited. And even using the NAR numbers, distressed sales are running around 1.5 million this year.
All this distressed sales activity has created a gap between new and existing sales as shown in the following graph that I've jokingly labeled the "Distressing" gap.
This is an update including July new and existing home sales data. Click on graph for larger image in new window.
This graph shows existing home sales (left axis) and new home sales (right axis) through July.
As I've noted before, I believe this gap was caused by distressed sales. Even with the recent rebound in new and existing home sales, the gap is still very wide. The second graph shows the same information, but as a ratio for existing home sales divided by new home sales.
Although distressed sales will stay elevated for some time, eventually I expect this ratio to decline back to the previous ratio.
The ratio could decline because of a further increase in new home sales, or a decrease in existing home sales - or a combination of both. I expect the ratio will decline mostly from a decline in existing home sales as the first-time home buyer frenzy subsides, and as the foreclosure crisis moves into mid-to-high priced areas (with fewer cash flow investors).
From a longer term graph of the ratio, see my post last month.
New Home Sales Increase in July
by Calculated Risk on 8/26/2009 10:00:00 AM
The Census Bureau reports New Home Sales in July were at a seasonally adjusted annual rate (SAAR) of 433 thousand. This is an increase from the revised rate of 395 thousand in June. Click on graph for larger image in new window.
The first graph shows monthly new home sales (NSA - Not Seasonally Adjusted).
Note the Red columns for 2009. This is the 3rd lowest sales for July since the Census Bureau started tracking sales in 1963.
In July 2009, 39 thousand new homes were sold (NSA); the record low was 31 thousand in July 1982; the record high for July was 117 thousand in 2005. The second graph shows New Home Sales vs. recessions for the last 45 years. New Home sales fell off a cliff, but are now 32% above the low in January.
Sales of new one-family houses in July 2009 were at a seasonally adjusted annual rate of 433,000 ...And another long term graph - this one for New Home Months of Supply.
This is 9.6 percent (±13.4%) above the revised June rate of 395,000, but is 13.4 percent (±12.9%) below the July 2008 estimate of 500,000.
 There were 7.5 months of supply in July - significantly below the all time record of 12.4 months of supply set in January.
The seasonally adjusted estimate of new houses for sale at the end of July was 271,000. This represents a supply of 7.5months at the current sales rate..
 The final graph shows new home inventory.
 Note that new home inventory does not include many condos (especially high rise condos), and areas with significant condo construction will have much higher inventory levels.
Months-of-supply and inventory have both peaked for this cycle, and there is a good chance that sales of new homes has also bottomed for this cycle. However any further recovery in sales will likely be modest because of the huge overhang of existing homes for sale.
I'll have more later ...
Monday, July 27, 2009
Distressing Gap: Ratio of Existing to New Home Sales
by Calculated Risk on 7/27/2009 11:38:00 AM
For graphs based on the new home sales report this morning, please see: New Home Sales increase in June, Highest since November 2008
Last week the National Association of Realtors (NAR) reported that distressed properties accounted 31 percent of sales in June. Distressed sales include REO sales (foreclosure resales) and short sales, and based on the 4.89 million existing home sales (SAAR) that puts distressed sales at about a 1.5 million annual rate in June.
All this distressed sales activity has created a gap between new and existing sales as shown in the following graph that I've jokingly labeled the "Distressing" gap.
This is an update including June new and existing home sales data. Click on graph for larger image in new window.
This graph shows existing home sales (left axis) and new home sales (right axis) through June.
As I've noted before, I believe this gap was caused by distressed sales - in many areas home builders cannot compete with REO sales, and this has pushed down new home sales while keeping existing home sales activity elevated.  The second graph shows the same information, but as a ratio for existing home sales divided by new home sales.
Although distressed sales will stay elevated for some time, eventually I expect this ratio to decline back to the previous ratio. The small decline in June ratio was because of the increase in new home sales.
The ratio could decline because of increase in new home sales, or a decrease in existing home sales - or a combination of both.  The third graph shows the ratio back to 1969 (annual data before 1994).
Note: the NAR has changed their data collection over time and the older data does not include condos: Single-family data collection began monthly in 1968, while condo data collection began quarterly in 1981; the series were combined in 1999 when monthly collection of condo data began.
New Home Sales increase in June, Highest since November 2008
by Calculated Risk on 7/27/2009 10:00:00 AM
The Census Bureau reports New Home Sales in June were at a seasonally adjusted annual rate (SAAR) of 384 thousand. This is an increase from the revised rate of 345 thousand in May. Click on graph for larger image in new window.
The first graph shows monthly new home sales (NSA - Not Seasonally Adjusted).
Note the Red columns for 2009. This is the 2nd lowest sales for June since the Census Bureau started tracking sales in 1963.
In June 2009, 36 thousand new homes were sold (NSA); the record low was 34 thousand in June 1982; the record high for June was 115 thousand in 2005. The second graph shows New Home Sales vs. recessions for the last 45 years. New Home sales have fallen off a cliff.
Sales of new one-family houses in June 2009 were at a seasonally adjusted annual rate of 384,000 ...And another long term graph - this one for New Home Months of Supply.
This is 11.0 percent (±13.2%)* above the revised May rate of 346,000, but is 21.3 percent (±11.4%) below the June 2008 estimate of 488,000.
 There were 8.8 months of supply in June - significantly below the all time record of 12.4 months of supply set in January.
The seasonally adjusted estimate of new houses for sale at the end of June was 281,000. This represents a supply of 8.8 months at the current sales rate.
 The final graph shows new home inventory.
 Note that new home inventory does not include many condos (especially high rise condos), and areas with significant condo construction will have much higher inventory levels.
Months-of-supply for inventory has peaked, and there is some chance that sales of new homes has bottomed for this cycle - but we won't know for many months. However any recovery in sales will likely be modest because of the huge overhang of existing homes for sale.
I'll have more later ...


