by Calculated Risk on 3/17/2010 09:29:00 PM
Wednesday, March 17, 2010
Comparing New Home Sales and Housing Starts
 Click on graph for larger image in new window.
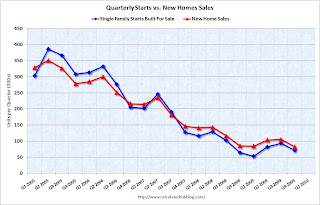
A frequently asked question is how do new home sales compare to single family housing starts (both series from the Census Bureau). This graph shows the two series - although they track each other, the two series cannot be directly compared.
For starts of single family structures, the Census Bureau includes owner built units and units built for rent that are not included in the new home sales report. From the Census Bureau: Comparing New Home Sales and New Residential Construction
We are often asked why the numbers of new single-family housing units started and completed each month are larger than the number of new homes sold. This is because all new single-family houses are measured as part of the New Residential Construction series (starts and completions), but only those that are built for sale are included in the New Residential Sales series. We categorize new residential construction into four intents, or purposes:However it is possible to compare "Single Family Starts, Built for Sale" to New Home sales on a quarterly basis. The Q4 quarterly report showed that there were 71,000 single family starts, built for sale, in Q4 2009, and that is less than the 82,000 new homes sold for the same period. This data is Not Seasonally Adjusted (NSA).
Built for sale (or speculatively built): the builder is offering the house and the developed lot for sale as one transaction this includes houses where ownership of the entire property including the land is acquired ("fee simple") as well as houses sold for cooperative or condominium ownership. These are the units measured in the New Residential Sales series.
Contractor-built (or custom-built): the house is built for the landowner by a general contractor, or the land and the house are purchased in separate transactions.
Owner-built: the house is built entirely by the landowner or by the landowner acting as his/her own general contractor.
Built for rent: the house is built with the intent that it be placed on the rental market when it is completed.
Q4 was the 9th consecutive quarter with homebuilders selling more homes than they start.
Note: new home sales are reported when contracts are signed, so it is appropriate to compare sales to starts (as opposed to completions). This is not perfect because homebuilders do build spec homes and many builders were stuck with some “unintentional spec homes” because of cancellations during the bust.
 This graph provides a quarterly comparison of housing starts and new home sales. In 2005, and most of 2006, starts (blue) were higher than sales (red), and inventories of new homes increased. For the last 9 quarters, starts have been below sales – and new home inventories have been falling.
It is possible that the streak will be broken in Q1, and that the builders started more single family homes, built for sale, than they sold. This is because a number of builders started some extra spec homes in anticipation of a "buying rush" in April before the tax credit expires. To qualify for the tax credit, the homes have to be finished before June 30th - and it takes close to 6 months to build a home - so some builders started a few extra homes in January that they hope will sold in Q2.


