 RSS Feed
 by Calculated Risk on 12/31/2011 08:30:00 PM
Saturday, December 31, 2011
Happy New Year!

A cartoon from Eric G. Lewis
My New Year's resolution: Get lost in the mountains for a few weekends this year.
Happy New Year to all!
Earlier:
• Summary for Week Ending December 30th
• Schedule for Week of Jan 1, 2012
Schedule for Week of Jan 1, 2012
by Calculated Risk on 12/31/2011 01:06:00 PM
Earlier:
• Summary for Week Ending December 30th
Happy New Year! The key report for this week will be the December employment report to be released on Friday, Jan 6th. Other key reports include the ISM manufacturing index on Tuesday, vehicle sales on Wednesday, and the ISM non-manufacturing (service) index on Thursday.
Note: Reis is expected to release their Q4 Office, Mall and Apartment vacancy rate reports this week. Last quarter Reis reported falling vacancy rates for apartments, rising vacancy rates for regional malls, and a slight decline in the office vacancy rate.
All US markets will be closed in observance of the New Year's holiday.
10:00 AM: Construction Spending for November. The consensus is for a 0.5% increase in construction spending.
 10:00 AM ET: ISM Manufacturing Index for December.
 Here is a long term graph of the ISM manufacturing index. The consensus is for a slight increase to 53.2 from 52.7 in November.
2:00 PM: FOMC Minutes, Meeting of December 13, 2010.
7:00 AM: The Mortgage Bankers Association (MBA) will release the mortgage purchase applications index. This index has been especially weak all year, although this doesn't include cash buyers.
10:00 AM: Manufacturers' Shipments, Inventories and Orders (Factory Orders) for November. The consensus is for a 1.9% decline in orders.
All day: Light vehicle sales for December. Light vehicle sales are expected to be unchanged at 13.6 million (Seasonally Adjusted Annual Rate).
 This graph shows light vehicle sales since the BEA started keeping data in 1967. The dashed line is the November sales rate.
 Growth in auto sales should make a strong positive contribution to Q4 GDP. Sales in Q3 averaged 12.45 million SAAR, and so far (October and November) sales have averaged 13.42 million SAAR in Q4, an increase of 7.6% over Q3.
Edmunds is forecasting:
[A] projected Seasonally Adjusted Annual Rate (SAAR) of 13.4 million units, forecasts Edmunds.com ... The sales pace is a slight dip from the 13.6 million SAAR recorded last month.And TrueCar is forecasting:
The December 2011 forecast translates into a Seasonally Adjusted Annualized Rate (SAAR) of 13.5 million new car sales
8:15 AM: The ADP Employment Report for December. This report is for private payrolls only (no government). The consensus is for 160,000 payroll jobs added in November, down from the 206,000 reported in November.
8:30 AM: The initial weekly unemployment claims report will be released. The consensus is for a decline to 375,000 from 381,000 last week. Last week was the lowest level for the 4-week average of weekly claims since mid-2008.
 10:00 AM: ISM non-Manufacturing Index for December. The consensus is for an increase to 53.4 from 52.0 in November. Note: Above 50 indicates expansion, below 50 contraction.
This graph shows the ISM non-manufacturing index (started in January 2008) and the ISM non-manufacturing employment diffusion index.
 8:30 AM: Employment Report for December. The consensus is for an increase of 150,000 non-farm payroll jobs in December, up from the 120,000 jobs added in November.
 The consensus is for the unemployment rate to increase slightly to 8.7% in December from 8.6% in November.
This second employment graph shows the percentage of payroll jobs lost during post WWII recessions through November.
 Through the first eleven months of 2011, the economy has added 1.448 million total non-farm jobs or just 131 thousand per month. This is a better pace of payroll job creation than last year, but the economy still has 6.2 million fewer payroll jobs than at the beginning of the 2007 recession. The economy has added 1.711 million private sector jobs this year, or about 156 thousand per month.
Summary for Week Ending December 30th
by Calculated Risk on 12/31/2011 09:00:00 AM
This was a light holiday week in the US. The data was mixed, although generally better than expected. Beating low expectations has been a recent theme.
The Conference Board reported an increase in consumer confidence, the Chicago purchasing managers' index was essentially unchanged (better than expected), and pending home sales increased.
Initial weekly unemployment claims increased somewhat, but the 4-week average is at the lowest level since mid-2008. And Case-Shiller reported house prices are at new post-bubble lows (seasonally adjusted).
Here is a summary of last week in graphs:
• Case Shiller: House Prices fall to new post-bubble low in October
From S&P: The Fourth Quarter Starts with Broad-based Declines in Home Prices According to the S&P/Case-Shiller Home Price Indices
Data through October 2011, released today by S&P Indices for its S&P/Case-Shiller1 Home Price Indices ... showed decreases of 1.1% and 1.2% for the 10- and 20-City Composites in October vs. September. Nineteen of the 20 cities covered by the indices also saw home prices decrease over the month. The 10- and 20-City Composites posted annual returns of -3.0% and -3.4% versus October 2010, respectively.
 Click on graph for larger image.
 This graph shows the nominal seasonally adjusted Composite 10 and Composite 20 indices (the Composite 20 was started in January 2000).
The Composite 10 index is off 32.9% from the peak, and down 0.5% in October (SA). The Composite 10 is at a new post bubble low (Seasonally adjusted), but still above the low NSA.
The Composite 20 index is off 33.0% from the peak, and down 0.6% in October (SA). The Composite 20 is also at a new post-bubble low.
 This graph shows the price declines from the peak for each city included in S&P/Case-Shiller indices.
Prices increased (SA) in 4 of the 20 Case-Shiller cities in October seasonally adjusted (only one city increased NSA). Prices in Las Vegas are off 61.3% from the peak, and prices in Dallas only off 8.8% from the peak.
The NSA indexes are only about 2% above the March 2011 lows - and these indexes will hit new lows in the next few months since prices are falling again. Using the SA data, the Case-Shiller indexes are now at new post-bubble lows!
• Real House Prices and House Price-to-Rent
 This graph shows the quarterly Case-Shiller National Index SA (through Q3 2011), and the monthly Case-Shiller Composite 20 SA and CoreLogic House Price Indexes (through October) in nominal terms (as reported).
In nominal terms, the Case-Shiller National index (SA) is back to Q4 2002 levels, the Case-Shiller Composite 20 Index (SA) is back to March 2003 levels, and the CoreLogic index is back to May 2003.
 Here are the same three indexes in real terms (adjusted for inflation using CPI less Shelter). Note: some people use other inflation measures to adjust for real prices.
In real terms, the National index is back to Q1 1999 levels, the Composite 20 index is back to April 2000, and the CoreLogic index back to March 2000.
In real terms, all appreciation in the '00s is gone.
In October 2004, Fed economist John Krainer and researcher Chishen Wei wrote a Fed letter on price to rent ratios: House Prices and Fundamental Value. Kainer and Wei presented a price-to-rent ratio using the OFHEO house price index and the Owners' Equivalent Rent (OER) from the BLS.
 Here is a similar graph using the Case-Shiller Composite 20 and CoreLogic House Price Index.
This graph shows the price to rent ratio (January 1998 = 1.0).
On a price-to-rent basis, the Composite 20 index is back to March 2000 levels, and the CoreLogic index is back to May 2000.
In real terms - and as a price-to-rent ratio - prices are mostly back to 2000 levels and will probably be back to 1999 levels in the next few months.
• Regional Fed Surveys and ISM Manufacturing Index
The regional surveys provide a hint about the ISM manufacturing index - and the regional surveys were mixed in December although they showed some improvement in the aggregate.
From the Kansas City Fed: Tenth District Manufacturing Activity Eased Slightly
From the Dallas Fed: Texas Manufacturing Activity Edges Down
 Here is a graph comparing the regional Fed surveys and the ISM manufacturing index.
The New York and Philly Fed surveys are averaged together (dashed green, through December), and five Fed surveys are averaged (blue, through December) including New York, Philly, Richmond, Dallas and Kansas City. The Institute for Supply Management (ISM) PMI (red) is through November (right axis).
The ISM index for December will be released Tuesday, Jan 3rd and the regional surveys suggest another reading in the low to mid 50s for December.
• Weekly Initial Unemployment Claims increase to 381,000
 This graph shows the 4-week moving average of weekly claims since January 2000.
The dashed line on the graph is the current 4-week average. The four-week average of weekly unemployment claims decreased this week to 375,000.
This is the lowest level for the 4-week average since June 2008.
• Other Economic Stories ...
• Chicago PMI: The overall index declined slightly to 62.5 in December from 62.6 in November. "EMPLOYMENT erased November's deceleration; ORDER BACKLOGS expanded to its highest level since April 2011"
• From the NAR: Pending Home Sales Highest in a Year-and-a-Half
• Fannie Mae and Freddie Mac Serious Delinquency Rates: Slight increase for Freddie in November
• Restaurant Performance Index increased in November
• Hotels: Occupancy Rate back to pre-recession levels
Friday, December 30, 2011
Merkel: "Will do everything to strengthen the euro"
by Calculated Risk on 12/30/2011 07:30:00 PM
And another reminder that Europe will remain on the front pages in 2012:
From Bloomberg: Merkel Says She’ll ’Do Everything’ to Save Euro
German Chancellor Angela Merkel said she expects turbulence in 2012 as she does “everything” to save the euro amid the Europe’s sovereign debt crisis.Meanwhile, more the Telegraph: 'Euro will be stable' claim is ridiculed
“The path to overcoming this won’t be without setbacks but at the end of this path Europe will emerge stronger from the crisis than before” ... “Today, you can trust that I will do everything to strengthen the euro,” Merkel said. “This will only succeed if Europe learns from the mistakes of the past. One of these is that a common currency can only be successful if we cooperate more than in the past in Europe.”
[German finance minister] Wolfgang Schauble said he was confident that the currency union will survive and the political measures will underpin the shattered eurozone economies. "We will be far enough along in the next 12 months that we will have banished the dangers of contagion and stabilised the eurozone," he told newspaper Handelsblatt.Unfortunately Schauble has consistently been wrong, and believes the answer is always more austerity.
Question #9 for 2012: Inflation
by Calculated Risk on 12/30/2011 02:56:00 PM
Last weekend I posted some questions for next year: Ten Economic Questions for 2012. I'll try to add some thoughts, and maybe some predictions for each question over the next week.
Many of the questions are interrelated. The question on monetary policy depends on inflation (question #9), the unemployment rate (question #6) and what happens in Europe (question #8). And the unemployment rate is related to GDP growth (question #4), and on and on ...
9) Inflation: Will the inflation rate rise or fall in 2012?
Over the last 12 months, several key measures of inflation have shown increases: CPI (Consumer Price Index) rose 3.4%, the median CPI increased 2.2%, the trimmed-mean CPI increased 2.5%, core CPI (less food and energy) increased 2.2%, and core PCE prices increased 1.6% (Q3 2010 to Q3 2011).
 Click on graph for larger image.
This graph shows core CPI, median CPI and trimmed-mean CPI on a year-over-year basis.
Early in the year there was a spike in energy prices, and it appears there was some spillover into these core measures. However, over the last few months, the rate of inflation has slowed. As an example, core PCE has increased at a 1.5% annual rate over the last 3 months.
In November, on a monthly basis, the median Consumer Price Index increased 1.1% at an annualized rate, the 16% trimmed-mean Consumer Price Index increased 1.0% annualized, and core CPI increased 2.1% annualized.
 Also inflation expectations are not indicating a significant increase in inflation. In fact expectations are for further declines in inflation.
This makes sense because of the slack in the system, and also because deflation is the usual concern following a credit bubble and financial crisis, not inflation.
There are some people who have been predicting an imminent rapid increase in inflation for almost 3 years - in their view, a sharp increase in inflation is always just around the corner. That view has consistently been wrong, although some people also claim the government measures are not correct and that inflation is much higher than reported.
 However private measures show similar results as BEA and BLS measures (see The Billion Prices Project).
The MIT prices are mostly for goods, because as they note: "The price of services, in particular, are not easy to find online and therefore are not included in our statistics." This is important because, according to the BEA, prices of good have increased significantly faster than the price of services over the last year (Prices for goods have increased 3.9%, and prices for service 1.6% from Q3 2010 to Q3 2011). So, if anything, the MIT prices overstate inflation by excluding most services.
The bottom line is the inflation rate will probably stay low in 2012 with high unemployment and low resource utilization. I expect QE3 to be announced before mid-year, and that will probably keep the inflation rate near the Fed's target (as opposed to falling further). But I don't see inflation as a significant threat in 2012.
Earlier:
• Question #10 for 2012: Monetary Policy
Hotels: Occupancy Rate back to pre-recession levels
by Calculated Risk on 12/30/2011 01:38:00 PM
From HotelNewsNow.com: STR: US results for week ending 24 December
The U.S. hotel industry experienced increases in all three key performance metrics during the week of 18-24 December 2011, according to data from STR.This is the weak season for hotel occupancy, but this is a fairly strong improvement over 2010. However ADR is still about 4% below the rate for the same week in 2008. Note: ADR: Average Daily Rate, RevPAR: Revenue per Available Room.
In year-over-year comparisons for the week, occupancy rose 8.1 percent to 37.3 percent, average daily rate increased 2.7 percent to US$89.48 and revenue per available room finished the week with an increase of 11.0 percent to US$33.39.
The following graph shows the seasonal pattern for the hotel occupancy rate using a four week average.
 Click on graph for larger image.
Hotels have seen a solid finish to 2011. The 4-week average of the occupancy rate is back to normal.
Looking forward, the 4-week average will decline until mid-January and then start to increase again (the normal seasonal pattern). February and March are the next key period - that is when business travel usually picks up.
Data Source: Smith Travel Research, Courtesy of HotelNewsNow.com
Restaurant Performance Index increased in November
by Calculated Risk on 12/30/2011 11:39:00 AM
From the National Restaurant Association: Restaurant Industry Outlook Improved in November as Restaurant Performance Index Rose to Five-Month High
The RPI – a monthly composite index that tracks the health of and outlook for the U.S. restaurant industry – stood at 100.6 in November, up 0.6 percent from October. In addition, November represented the second time in the last three months that the RPI stood above 100, which signifies expansion in the index of key industry indicators.
“The November increase in the Restaurant Performance Index was fueled by broad-based gains in both the current situation and forward-looking indicators,” said Hudson Riehle, senior vice president of the Research and Knowledge Group for the Association. “Restaurant operators reported their strongest net positive same-store sales results in more than four years, while customer traffic levels also grew in November.”
...
Restaurant operators reported positive same-store sales for the sixth consecutive month inNovember. ... Restaurant operators also reported stronger customer traffic levels in November. ... Capital spending activity among restaurant operators trended upward in recent months. Forty-six percent of operators said they made a capital expenditure for equipment, expansion or remodeling during the last three months, the highest level in five months.
 Click on graph for larger image.
The index increased to 100.6 in November (above 100 indicates expansion).
Unfortunately the data for this index only goes back to 2002.
Restaurant spending is discretionary and is impacted by the overall economy. This index showed contraction in July and August, but is now positive again.
Fannie Mae and Freddie Mac Serious Delinquency Rates: Slight increase for Freddie in November
by Calculated Risk on 12/30/2011 08:54:00 AM
Fannie Mae reported that the Single-Family Serious Delinquency rate was unchanged at 4.00% in November. This is down from 4.50% in November of 2010. The Fannie Mae serious delinquency rate peaked in February 2010 at 5.59%.
Freddie Mac reported that the Single-Family serious delinquency rate increased to 3.57% in November, up from 3.54% in October. This is down from 3.85% in November 2010. Freddie's serious delinquency rate peaked in February 2010 at 4.20%.
These are loans that are "three monthly payments or more past due or in foreclosure".
 Click on graph for larger image
The increase in November (unchanged for Fannie) is probably seasonal. The serious delinquency rates have been declining, but declining very slowly. The reason for the slow decline is most likely the backlog of homes in the foreclosure process.
The "normal" serious delinquency rate is under 1%, and at this pace of decline, the delinquency rate will not be back to "normal" for a long time.
Early in 2012, a mortgage settlement agreement with the servicers might be reached, and that might lead to more modifications and foreclosures - so the delinquency rate might decline faster. Also Fannie and Freddie are expected to announce a bulk sale of REO to investors (and possible rental program) early next year - and that might also lead to more foreclosures.
Thursday, December 29, 2011
Gasoline Prices and Brent WTI Spread
by Calculated Risk on 12/29/2011 07:53:00 PM
The year is almost over and once again a key downside risk for the economy is high gasoline prices. According to Bloomberg, Brent Crude is up to $108.10 per barrel, while WTI is up to $99.76. These prices have kept gasoline prices high, and pushed down vehicle miles driven in the US.
Although prices were higher in the first half of 2008, it is possible that the average annual price for oil and gasoline in 2012 will see a new record high.
If the global economy really slows, oil and gasoline prices will probably fall - and probably offset some of the impact from lower exports. Unfortunately turmoil in the Middle East (this time with Iran) might be pushing up oil prices.
This following graph shows the prices for Brent and WTI over the last few years. Usually the prices track pretty closely, but the "glut" of oil at Cushing pushed down WTI prices relative to Brent.
 Click on graph for larger image.
The spread has narrowed over the last couple of months following the announcement of a partial reversal of the Seaway pipeline to transport crude oil from Cushing, Oklahoma, to the Gulf Coast (the pipeline is scheduled to be reversed in Q2 2012).
And below is a graph of gasoline prices. Gasoline prices have been slowly moving down since peaking in early May. Note: The graph below shows oil prices for WTI; gasoline prices in most of the U.S. are impacted more by Brent prices.
| Orange County Historical Gas Price Charts Provided by GasBuddy.com |
Labor Force Participation: The Kids are Alright Part 2
by Calculated Risk on 12/29/2011 04:13:00 PM
A few weeks ago, I posted: Labor Force Participation Rate: The Kids are Alright
Catherine Rampell at the NY Times adds some more data: Instead of Work, Younger Women Head to School
Workers are dropping out of the labor force in droves, and they are mostly women. In fact, many are young women. But they are not dropping out forever; instead, these young women seem to be postponing their working lives to get more education.

[M]any of the workers on the sidelines are young people upgrading their skills, which could portend something like the postwar economic boom, when millions of World War II veterans went to college through the G.I. Bill instead of immediately entering, and overwhelming, the job market.The flip side is that many older workers are also going back to school and getting student loans, see: Middle-aged borrowers piling on student debt (ht Ann)
Both men and women are going back to school, but the growth in enrollment is significantly larger for women (who dominated college campuses even before the financial crisis). In the last two years, the number of women ages 18 to 24 in school rose by 130,000, compared with a gain of 53,000 for young men.
...
The main risk in going back to school is the accompanying student loan debt.
Middle-aged borrowers are piling up student debt faster than any other age group, according to a new analysis obtained by Reuters.That is deeply concerning.
But in the long run, more education is a positive for the economy - and Rampell's article suggests the kids (well, young adults) are alright!
Kansas City Fed manufacturing index "eased slightly" in December
by Calculated Risk on 12/29/2011 11:45:00 AM
This is the last of the regional Fed surveys for December. The regional surveys provide a hint about the ISM manufacturing index - and the regional surveys were mixed in December although they showed some improvement in the aggregate.
From the Kansas City Fed: Tenth District Manufacturing Activity Eased Slightly
According to Chad Wilkerson, vice president and economist at the Federal Reserve Bank of Kansas City, the survey revealed that Tenth District manufacturing activity eased slightly, but expectations for future months improved somewhat.Here is a graph comparing the regional Fed surveys and the ISM manufacturing index:
“We saw a slight moderation in factory activity in our region in December,” said Wilkerson. “But plant managers continue to expect solid growth in the months ahead and are planning to increase employment and capital spending accordingly.”
...
The month-over-month composite index was -4 in December, down from 4 in November and 8 in October, and the first negative reading since December 2009 ... Most other month-over-month indexes also fell somewhat in December. The production and shipments indexes moved into negative territory, and the new orders and order backlog indexes fell further. The employment index dropped to its lowest level since mid-2009, and the new orders for exports index edged down.
Click on graph for larger image.The New York and Philly Fed surveys are averaged together (dashed green, through December), and five Fed surveys are averaged (blue, through December) including New York, Philly, Richmond, Dallas and Kansas City. The Institute for Supply Management (ISM) PMI (red) is through November (right axis).
The ISM index for December will be released Tuesday, Jan 3rd and the regional surveys suggest another reading in the low to mid 50s. for December.
Misc: Chicago PMI at 62.5, Pending Home Sales increase
by Calculated Risk on 12/29/2011 10:10:00 AM
• Chicago PMI: The overall index declined slightly to 62.5 in December from 62.6 in November. This was above consensus expectations of 60.1. Note: any number above 50 shows expansion.
• From the NAR: Pending Home Sales Highest in a Year-and-a-Half
The Pending Home Sales Index, a forward-looking indicator based on contract signings, increased 7.3 percent to 100.1 in November from an upwardly revised 93.3 in October and is 5.9 percent above November 2010 when it stood at 94.5. The October upward revision resulted in a 10.4 percent monthly gain.
The last time the index was higher was in April 2010 when it reached 111.5 as buyers rushed to beat the deadline for the home buyer tax credit.
...
The PHSI in the Northeast rose 8.1 percent to 77.1 in November but is 0.3 percent below November 2010. In the Midwest the index increased 3.3 percent to 91.6 in November and is 9.5 percent above a year ago. Pending home sales in the South rose 4.3 percent in November to an index of 103.8 and remain 8.7 percent above November 2010. In the West the index surged 14.9 percent to 121.2 in November and is 2.9 percent higher than a year ago.
Weekly Initial Unemployment Claims increase to 381,000
by Calculated Risk on 12/29/2011 08:39:00 AM
The DOL reports:
In the week ending December 24, the advance figure for seasonally adjusted initial claims was 381,000, an increase of 15,000 from the previous week's revised figure of 366,000. The 4-week moving average was 375,000, a decrease of 5,750 from the previous week's revised average of 380,750.The following graph shows the 4-week moving average of weekly claims since January 2000.
Click on graph for larger image.The dashed line on the graph is the current 4-week average. The four-week average of weekly unemployment claims decreased this week to 375,000.
This is the lowest level for the 4-week average since June 2008.
And here is a long term graph of weekly claims:
 Although initial claims increased this week, the 4-week moving average is still falling and is now well below 400,000.
Wednesday, December 28, 2011
A Pickup for Housing in 2012?
by Calculated Risk on 12/28/2011 06:16:00 PM
Residential investment made a small positive contribution to GDP in 2011, for the first time since 2005. And construction employment turned slightly positive in 2011.
Now the question is what will happen in 2012? I think some pickup is likely, but I'm not as optimistic as some other people ...
From the WSJ: Hedge Funds See Rebirth for U.S. Housing
Hedge funds run by Caxton Associates LP, SAC Capital Advisors LP, Avenue Capital and Blackstone Group LP have been buying housing-related investments, betting on a rebound. And formerly bearish research firm Zelman & Associates now predicts a housing pickup, as does Goldman Sachs Group Inc.Of course there are still housing bears:
...
Even some housing skeptics acknowledge that real estate may no longer be the drag it has been on the economy. ... "I'm sold that it's a bottom," says James Bianco, who runs Bianco Research, in Chicago. "It's gone from a negative to a nothing for the economy," ...
Ivy Zelman [predicts] that rising rents will push would-be buyers to purchase homes. A housing recovery isn't "happening as fast as everyone would like," she says. But there are "a lot of pillars in place to give us some optimism."
"The smartest money in the world has been carried out on stretchers betting on a true recovery for housing," says Mark HansonI think we will probably see some increase in new home sales in 2012, but it will be from a very low level (around 300 thousand new homes will be sold in 2011, a record low since the Census Bureau started tracking new home sales in 1963). I'll have more on housing and residential investment soon.
Existing Home Inventory declines 18% year-over-year in December
by Calculated Risk on 12/28/2011 01:45:00 PM
Another update: I've been using inventory numbers from HousingTracker / DeptofNumbers to track changes in inventory. Tom Lawler mentioned this back in June.
According to the deptofnumbers.com for monthly inventory (54 metro areas), listed inventory is probably back to early 2005 levels. Unfortunately the deptofnumbers only started tracking inventory in April 2006.
This graph shows the NAR estimate of existing home inventory through November (left axis) and the HousingTracker data for the 54 metro areas through December.
 Click on graph for larger image.
This is the first update since the NAR released their revisions for sales and inventory. Now the NAR and HousingTracker are pretty close.
There is a seasonal pattern for inventory, bottoming in December and January and peaking during the summer months. So inventory will probably decline again next month and then start increasing in February.
The second graph shows the year-over-year change in inventory for both the NAR and HousingTracker.
 HousingTracker reported that the December listings - for the 54 metro areas - declined 17.6% from the same month last year. For the final week in December, inventory is down 18.4% from a year ago.
This is just inventory listed for sale, sometimes referred to as "visible inventory". There is also a large "shadow inventory" that is currently not on the market, but is expected to be listed in the next few years. Shadow inventory could include bank owned properties (REO: Real Estate Owned), properties in the foreclosure process, other properties with delinquent mortgages (both serious delinquencies of over 90+ days, and less serious), condos that were converted to apartments (and will be converted back), investor owned rental properties, and homeowners "waiting for a better market", and a few other categories - as long as the properties are not currently listed for sale. Some of this "shadow inventory" will be forced on the market, such as completed foreclosures, but most of these sellers will probably wait for a "better market".
However listed inventory has clearly declined in many areas. And it is the listed months-of-supply combined with the number of distressed sales that mostly impacts prices. (note: there are still 7 months of supply because both sales and inventory have declined).
Question #10 for 2012: Monetary Policy
by Calculated Risk on 12/28/2011 11:46:00 AM
Over the weekend I posted some questions for next year: Ten Economic Questions for 2012. I'll try to add some thoughts, and maybe some predictions for each question over the next week.
Many of the questions are interrelated. The question on monetary policy depends on inflation (question #9), the unemployment rate (question #6) and what happens in Europe (question #8). And the unemployment rate is related to GDP growth (question #4), and on and on ...
10) Monetary Policy: Will the Fed introduce QE3? Will the Fed change their communication strategy and include the likely future path of the Fed Funds rate?
Last year many analysts were arguing that the Fed would end QE2 early and raise rates before the end of 2011. That seemed very unlikely. Not only didn't the Fed raise rates, but they went a step further at the August meeting and dropped the somewhat ambiguous "extended period" language and replaced it with a time frame: "economic conditions ... are likely to warrant exceptionally low levels for the federal funds rate at least through mid-2013."
Now it appears the FOMC will drop the time frame from the FOMC statement and replace it with a forecast of the likely future path of the Fed Funds rate. There have been several recent articles suggesting this change (see the WSJ: Federal Reserve Prepares to Make Itself Perfectly Clear and Fed Could Keep Rates Near Zero Into 2014)
When the Fed revises its communications approach, there is a good chance it will cease offering a fixed date for the timing of rate increases. Instead, officials could signal their intentions by publishing a range of their forecasts for rates along with their quarterly economic projections.This change in communication strategy will probably happen at the two day January FOMC meeting on the 24th and 25th.
There is also a good chance the Fed will embark on another round of Large Scale Asset Purchases (LSAP or QE3) in 2012. The Fed will probably take a wait and see approach early in the year, and QE3 would be dependent on the unemployment rate and inflation (the Fed's dual mandate).
If the economy tracks the most recent projections, QE3 would seem likely at either the April or June meetings. Others are arguing that QE3 could happen at the March meeting. If the economy performs better than expected, then the Fed will probably wait longer. QE3 will probably be focused on purchases of agency Mortgage Backed Securities (MBS).
Of course, if the economy performs worse than projected early in the year - or Europe implodes - the Fed would probably move quickly on QE3.
To summarize my views:
• I expect the Fed will change their communication strategy and add a likely future path of the Fed Funds rate to the quarterly economic forecasts.
• I think QE3 is likely, but more towards mid-year - and is data dependent.
Italian bond yields decline
by Calculated Risk on 12/28/2011 08:53:00 AM
From the NY Times: Italy's Borrowing Costs Drop Sharply at Auction
The sale of €9 billion, or $11.8 billion, of six-month Treasury bills was seen as the first post-holiday pointer to condition of the beleaguered euro zone.The Italian 2 year yield is down to 4.95% - the lowest level since October, but the 10 year yield is still at 6.86%.
The bills were sold at a yield of 3.251 percent, sharply down from 6.504 percent at a previous auction in late November. ... In an auction of two-year bonds, which raised €1.7 billion, the yield fell to 4.853 percent from 7.814 percent last month.
The Spanish 2 year yield is down sharply to 3.26%, and the 10 year yield is down to 5.09%.
But the Italian economy is weak:
Italy suffered its biggest decline in Christmas retail sales in 10 years, according to data released this week by the consumer group Codacons, reflecting the impact of the souring economy.
It was a similar picture in Greece, headed for a fourth year of recession in 2012. The country’s near-record unemployment was reflected in a 30 percent drop in pre-Christmas sales, the ESEE retail federation said Tuesday.
Tuesday, December 27, 2011
Lawler: Completed Foreclosure Sales in 2011 to Fall Well Below 2010 Levels
by Calculated Risk on 12/27/2011 09:36:00 PM
From economist Tom Lawler:
While data on the number of loans either seriously delinquent or in the foreclosure process suggested that an increase in the number of residential properties lost to foreclosure this year was a “slam dunk,” incoming data suggest that in fact the numbers will be down significantly from 2010, and will in fact probably come in at the lowest level since 2007!
Of course, there are no “official” data on completed foreclosure sales. However, estimates both from RealtyTrac through November and Hope Now through October suggest that this will in fact be the case.
Moreover, estimates from Hope Now on the number of completed foreclose sales on owner-occupied properties suggest that such foreclosures will be down very sharply this year. Unfortunately, Hope Now only started reporting the breakout by occupancy status in December 2009.
Short sales and DILs, in contrast are likely to be up in 2011 compared to 2010, at least according to estimates derived from Hope Now data. Unfortunately, Hope Now data doesn't allow for an estimate of SS/DILs by occupancy type, and HN didn’t start releasing data that allowed one to derive estimated short sales/DILs until early 2010.
Here is a table of what completed foreclosure sales and short sales/DILs for residential first-lien mortgages might end up looking like for 2011, compared to the last 3 years.
Completed foreclosure sales are estimates from Hope Now, and the 2010 and 2011 short sales/DILs estimates are derived from Hope Now data. 2008 and 2009 short sales/DILs are my own estimates derived from Fannie, Freddie, FHA, and OCC mortgage metrics data. The data on the number of seriously delinquent loans and loans in the process of foreclosure are from LPS analytics (whose estimate might differ from Hope Now’s, if HN produced such estimates).
| Completed Foreclosure Sales And Short Sales/DILs (thousands, estimates) | ||||
|---|---|---|---|---|
| 2008 | 2009 | 2010 | 2011(E) | |
| Completed Foreclosure Sales | 914 | 949 | 1,070 | 815 |
| Owner-occupied | N.A. | N.A. | 785 | 608 |
| Non-owner-occupied | N.A. | N.A. | 285 | 207 |
| Short Sales/DILs | 105 | 270 | 354 | 380 |
| Foreclosures plus Short Sales/DILs | 1,019 | 1,219 | 1,424 | 1,195 |
| Outstanding first liens: | Jan-08 | Jan-09 | Jan-10 | Jan-11 |
| Seriously Delinquent (90+) | 1,016 | 1,983 | 3,061 | 2,168 |
| In Process of Foreclosure | 860 | 1,386 | 2,110 | 2,203 |
Given the number of loans either seriously delinquent or in the process of foreclosure at the beginning of the year, the number of completed foreclosure sales in 2011 is almost absurdly low, reflecting the complete screw-up of the mortgage servicing industry, and the resulting dramatic slowdown in foreclosure resolutions. As of the end of October, 2011 LPS estimated that there were 1.759 million seriously delinquent loans with the average number of days delinquent at 388 (compared to 192 days in January 2008), and there were 2.210 million loans in the foreclosure process that had been on average delinquent for 631 days.
While there are no data that I know of that break out the number of seriously delinquent loans or loans in the foreclosure process backed by properties that are vacant (or rented out by owners not paying on the mortgage), at least one industry consultant who has looked at some (unfortunately confidential) data told me that the % of loans in the foreclosure process that are not occupied by the owner of the property is “shockingly” large.
CR Note: It would really be helpful to have an official count of foreclosures and short sales.
Earlier:
• Case Shiller: House Prices fall to new post-bubble lows in October (seasonally adjusted)
• Real House Prices and House Price-to-Rent
Treasury: China not a currency manipulator, however "movement of the RMB is insufficient"
by Calculated Risk on 12/27/2011 06:00:00 PM
From Reuters: U.S. says China is not a currency manipulator
[T]he Treasury, in a semi-annual report, said that statutes covering a designation of currency manipulator "have not been met with respect to China."Here is the report from Treasury: Report to Congress on International Economic and Exchange Rate Policies (includes a discussion of the global economy).
Even so, Treasury said appreciation in the yuan has been too slow. The value of the yuan, which Beijing manages closely, has risen by 4 percent against the dollar this year and 7.7 percent since China dropped a firm peg against the greenback in June 2010.
And from Treasury:
The Report highlights the need for greater exchange rate flexibility, most notably by China, but also in other major economies. Based on the ongoing appreciation of the RMB against the dollar since June 2010, the decline in China's current account surplus, and China's official commitments at the G-20, APEC, and the U.S.-China Strategic and Economic Dialogue (S&ED) that it will move more rapidly toward exchange rate flexibility, Treasury has concluded that the standards identified in Section 3004 of the Act during the period covered in this Report have not been met with respect to China. Nonetheless, the movement of the RMB to date is insufficient. Treasury will closely monitor the pace of RMB appreciation and press for policy changes that yield greater exchange rate flexibility, a level playing field, and a sustained shift to domestic demand-led growth.
DOT: Vehicle Miles Driven declined 2.3% in October
by Calculated Risk on 12/27/2011 02:55:00 PM
The Department of Transportation (DOT) reported:
• Travel on all roads and streets changed by -2.3% (-6.0 billion vehicle miles) for October 2011 as compared with October 2010.The following graph shows the rolling 12 month total vehicle miles driven.
• Travel for the month is estimated to be 254.0 billion vehicle miles.
• Cumulative Travel for 2011 changed by -1.4% (-36.0 billion vehicle miles).
 Click on graph for larger image.
In the early '80s, miles driven (rolling 12 months) stayed below the previous peak for 39 months.
Currently miles driven has been below the previous peak for 47 months - so this is a new record for longest period below the previous peak - and still counting! And not just moving sideways ... the rolling 12 months is declining.
The second graph shows the year-over-year change from the same month in the previous year.
 This is the eight straight month with a year-over-year decline in miles driven.
 This decline is probably due to high gasoline prices and the sluggish economy. Maybe habits are changing ...
Real House Prices and House Price-to-Rent
by Calculated Risk on 12/27/2011 11:38:00 AM
A monthly update: Case-Shiller, CoreLogic and others report nominal house prices. However it is also useful to look at house prices in real terms (adjusted for inflation) and as a price-to-rent ratio.
Below are three graphs showing nominal prices (as reported), real prices and a price-to-rent ratio. Real prices are back to 1999/2000 levels, and the price-to-rent ratio is also back to 2000 levels.
Nominal House Prices
Click on graph for larger image.
The first graph shows the quarterly Case-Shiller National Index SA (through Q3 2011), and the monthly Case-Shiller Composite 20 SA and CoreLogic House Price Indexes (through October) in nominal terms (as reported).
In nominal terms, the Case-Shiller National index (SA) is back to Q4 2002 levels, the Case-Shiller Composite 20 Index (SA) is back to March 2003 levels, and the CoreLogic index is back to May 2003.
Real House Prices
The second graph shows the same three indexes in real terms (adjusted for inflation using CPI less Shelter). Note: some people use other inflation measures to adjust for real prices.
In real terms, the National index is back to Q1 1999 levels, the Composite 20 index is back to April 2000, and the CoreLogic index back to March 2000.
In real terms, all appreciation in the '00s is gone.
Price-to-Rent
In October 2004, Fed economist John Krainer and researcher Chishen Wei wrote a Fed letter on price to rent ratios: House Prices and Fundamental Value. Kainer and Wei presented a price-to-rent ratio using the OFHEO house price index and the Owners' Equivalent Rent (OER) from the BLS.
Here is a similar graph using the Case-Shiller Composite 20 and CoreLogic House Price Index.
This graph shows the price to rent ratio (January 1998 = 1.0).
On a price-to-rent basis, the Composite 20 index is back to March 2000 levels, and the CoreLogic index is back to May 2000.
In real terms - and as a price-to-rent ratio - prices are mostly back to 2000 levels and will probably be back to 1999 levels in the next few months.
Note: Last year I guessed that prices would decline another 5% to 10% on these national indexes (from October 2010 prices). So far prices have fallen another 3% to 4% on these indexes - with more to come - but most of the price declines are over.
Earlier:
• Case Shiller: House Prices fall to new post-bubble lows in October (seasonally adjusted)
Case Shiller: House Prices fall to new post-bubble lows in October (seasonally adjusted)
by Calculated Risk on 12/27/2011 09:40:00 AM
S&P/Case-Shiller released the monthly Home Price Indices for October (a 3 month average of August, September and October). This release includes prices for 20 individual cities and and two composite indices (for 10 cities and 20 cities).
Note: Case-Shiller reports NSA, I use the SA data. Here is a table of the year-over-year and monthly changes for both SA and NSA.
| Case Shiller October 2011 | Seasonally Adjusted | Not Seasonally Adjusted | ||
|---|---|---|---|---|
| YoY Change | One Month Change | YoY Change | One Month Change | |
| Composite 10 | -3.0% | -0.5% | -3.0% | -1.1% |
| Composite 20 | -3.4% | -0.6% | -3.4% | -1.2% |
From S&P: The Fourth Quarter Starts with Broad-based Declines in Home Prices According to the S&P/Case-Shiller Home Price Indices
Data through October 2011, released today by S&P Indices for its S&P/Case-Shiller1 Home Price Indices ... showed decreases of 1.1% and 1.2% for the 10- and 20-City Composites in October vs. September. Nineteen of the 20 cities covered by the indices also saw home prices decrease over the month. The 10- and 20-City Composites posted annual returns of -3.0% and -3.4% versus October 2010, respectively.
“There was weakness in the monthly statistics, as 19 of the cities posted price declines in October over September,” says David M. Blitzer, Chairman of the Index Committee at S&P Indices. “Eleven of the cities and both composites fell by 1.0% or more during the month.
Click on graph for larger image. The first graph shows the nominal seasonally adjusted Composite 10 and Composite 20 indices (the Composite 20 was started in January 2000).
The Composite 10 index is off 32.9% from the peak, and down 0.5% in October (SA). The Composite 10 is at a new post bubble low (Seasonally adjusted), but still above the low NSA.
The Composite 20 index is off 33.0% from the peak, and down 0.6% in October (SA). The Composite 20 is also at a new post-bubble low.
 The second graph shows the Year over year change in both indices.
The Composite 10 SA is down 3.0% compared to October 2010.
The Composite 20 SA is down 3.4% compared to October 2010. This was a slightly smaller year-over-year decline for both indexes than in September.
The third graph shows the price declines from the peak for each city included in S&P/Case-Shiller indices.
Prices increased (SA) in 4 of the 20 Case-Shiller cities in October seasonally adjusted (only one city increased NSA). Prices in Las Vegas are off 61.3% from the peak, and prices in Dallas only off 8.8% from the peak.The NSA indexes are only about 2% above the March 2011 lows - and these indexes will hit new lows in the next few months since prices are falling again. Using the SA data, the Case-Shiller indexes are now at new post-bubble lows!
Case-Shiller: House Prices decline in October
by Calculated Risk on 12/27/2011 09:14:00 AM
From MarketWatch: Oct. U.S. home prices fall 1.2%: Case-Shiller
U.S. home prices fell 1.2% in October to take the 12-month drop to 3.4%, according to the S&P/Case-Shiller 20-city composite home price index released Tuesday. Nineteen of 20 cities saw price drops, and the index is now down 32.1% from its peak in 2006.S&P hasn't released the data online yet. The 1.2% decline is Not Seasonally Adjusted (NSA), and the seasonally adjusted decline will be smaller (prices decline seasonally in October). I'll post graphs after the data is released.
Monday, December 26, 2011
WSJ: "Slowing Inflation Cheers Fed"
by Calculated Risk on 12/26/2011 09:05:00 PM
I always pay close attention to Fed stories from Jon Hilsenrath at the WSJ: Slowing Inflation Cheers Fed
U.S. inflation is slowing after a surge early in the year. ... The Fed has been considering new steps to spur growth. Two ideas are on the table: commit to keep short-term interest rates near zero for even longer than through mid-2013, and restart a bond-buying program aimed at driving already-low long-term interest rates lower. Before taking either step, though, Fed officials would want to have some comfort that they wouldn't be creating undesired inflation.As Hilsenrath notes, inflation is slowing by most key measures, and this will give the Fed more leeway. It always seems the Fed telegraphs their intentions, and it now seems very likely the Fed will add a range of Fed funds rate forecasts to their quarterly economic projections at the next FOMC meeting on January 24th and 25th.
If the Fed funds rate forecasts are added, this would replace the sentence in the FOMC statement - "The Committee ... currently anticipates that economic conditions ... are likely to warrant exceptionally low levels for the federal funds rate at least through mid-2013". The bond buying program (aka QE3) would be data dependent and probably start a little later in the year if economic growth disappoints.
Weekend:
• Schedule for Week of Dec 25th
• Summary for Week ending Dec 23rd
Private Investment and the Business Cycle
by Calculated Risk on 12/26/2011 03:41:00 PM
Discussions of the business cycle frequently focus on consumer spending (PCE: Personal consumption expenditures), but one key is to watch private domestic investment. Even though private investment usually only accounts for about 15% of GDP, private investment experiences significantly larger swings than PCE during the business cycle and has an outsized impact on GDP. Note: currently private investment is just over 12% of GDP - much lower than normal.
The first graph shows the real annualized change in GDP and private investment since 1960 (this is a 3 quarter centered average to smooth the graph).
 Click on graph for larger image.
GDP has fairly small annualized changes compared to the huge swings in investment, especially during and just following a recession. This is why investment is one of the keys to the business cycle.
The second graph shows the contribution to GDP from the four categories of private investment: residential investment, equipment and software, nonresidential structures, and "Change in private inventories". Note: this is a 3 quarter centered average of the contribution to GDP.
This is important to follow because residential investment tends to lead the economy, equipment and software is generally coincident, and nonresidential structure investment lags the business cycle. Red is residential, green is equipment and software, and blue is investment in non-residential structures. The usual pattern - both into and out of recessions is - red, green, and blue.
 The dashed purple line is the "Change in private inventories". This category has significant ups and downs, but is always negative during a recession, and provides a boost to GDP just after a recession. Change in private inventories has made a large negative contribution to GDP over the last four quarters, and will probably make a positive contribution in Q4.
The key leading sector - residential investment - has lagged this recovery because of the huge overhang of existing inventory. Usually residential investment is a strong contributor to GDP growth and employment in the early stages of a recovery, but not this time - and that weakness is a key reason why the recovery has been sluggish so far.
Equipment and software investment has made a significant positive contribution to GDP for nine straight quarters (it is coincident).
The contribution from nonresidential investment in structures was positive in Q3. Nonresidential investment in structures typically lags the recovery; however investment in energy and power is masking weakness in office, mall and hotel investment.
And residential investment has finally turned slightly positive and will make a positive contribution to GDP in 2011 for the first time since 2005.
 What does this mean for the business cycle? Usually residential investment would turn down before a recession, and that isn't happening right now. Instead residential investment is mostly moving sideways.
The third graph shows residential investment as a percent of GDP. Residential investment as a percent of GDP is at a record low, and it seems unlikely that residential investment will decline significantly lower as a percent of GDP - especially with a pickup in multifamily investment and some increase in home improvement (Note: Residential investment is mostly investment in new single family and multifamily structures, home improvement and brokers' commissions). It seems likely that residential investment will make a positive contribution to GDP in 2012.
 The last graph shows non-residential investment in structures and equipment and software.
Equipment and software investment has increased sharply, but is still at a fairly normal level of GDP. And non-residential investment in structures increased in Q3, but this is still very low.
A key fear is that the financial crisis in Europe could drag the US economy into another recession. That is possible, especially combined with ongoing household deleveraging and fiscal tightening in the US (with current policy, Federal, state and local governments will all subtract from GDP growth in 2012).
However it seems unlikely there will be a sharp decline in private investment. Residential investment is already at record lows as a percent of GDP and will probably increase in 2012. Changes in private inventories will probably rebound a little, and investment in non-residential structures is also near record lows. It is possible that investment in equipment and software could decline in 2012, but it doesn't seem likely there will be a sharp decline in overall private investment.
If the euro zone comes apart rapidly - or there is further non-private tightening - a new recession is possible in the US, but without a sharp decline in private investment, it is unlikely a US recession would be severe. Right now it appears overall US private investment will increase in 2012, and that the US will avoid a new recession.
WaPo: "Falling home values mean budget crunches for cities"
by Calculated Risk on 12/26/2011 09:48:00 AM
From Brady Dennis at the WaPo: Falling home values mean budget crunches for cities
Because of the time it often takes for property assessments to reflect falling home values, the bust that began in 2007 has just begun to ravage tax revenues in communities from coast to coast. The problem is unlikely to subside soon.As the article notes, some states cap the annual increase in property taxes (there is a 2% annual cap in California). For long term owners, this means their property taxes will continue to increase since their assessed value is probably still below the current market value. This will keep overall taxes from falling quickly in certain states.
For instance, Baltimore collected $815 million in property taxes during the most recent fiscal year, according to Bill Voorhees, Baltimore’s director of revenue and tax analysis. Next year, the figure is predicted to shrink to $803.5 million. The following year, $773 million. The year after that, $735.7 million. The year after that, $729.4 million.
In California, property values are assessed annually - and most cities have already reduced assessments and taxes on many homeowners. Also in California, properties are assessed whenever ownership changes, and all the foreclosures and short sales have already pushed down property taxes. So these communities will probably not see a further dramatic decline in property tax revenue.
But there is still more pain to come in other areas.
Weekend:
• Schedule for Week of Dec 25th
• Summary for Week ending Dec 23rd
Sunday, December 25, 2011
Germany's Schaeuble pushes for Financial Transaction Tax
by Calculated Risk on 12/25/2011 07:36:00 PM
Update: The UK has a stamp tax on stock shares (but not other financial transactions), see:
http://www.hmrc.gov.uk/stats/stamp_duty/table15-1.pdf
and
http://www.cepr.net/documents/publications/financial-transactions-tax-2008-12.pdf
This could be a key story in 2012 ...
From Bloomberg: Schaeuble vows to push for financial transaction tax
"In the EU we've agreed to explore the chances of a financial transaction tax in the first months of the new year," [Schaeuble] said. "If the hurdles are too high then Germany and France will push for introducing the tax only in the euro zone."This might sound good, but if this was just introduced in the euro zone, many financial transactions would move to the UK or the US. I think a transaction tax would have to enacted everywhere to be effective.
...
"I don't want to wait until such a tax is introduced worldwide. Otherwise we would risk not only the stability of our financial markets... but we would also be endangering the legitimacy in the public eye for the entire system.
"That's why I'm fighting with such determination for a financial transaction tax. It might not be able to stop the ludicrous developments in financial markets but it would at least brake them a bit."
Schaeuble said he wanted the tax to slow down the pace of financial transactions and possibly make some speculative business unprofitable.
"The markets are a bit too preoccupied with themselves these days rather than supporting the real economy," he said. "We've got to decelerate the pace of transactions."
...
"I'm very much in favour of Europe leading the way," he said. "That can possibly mean that certain speculative business models are no longer profitable. But that is what we want."
Schaeuble also said the European financial situation is "controllable". That is pretty scary since Schaeuble has misdiagnosed the problems in Europe - calling for more and more austerity - and it looks like Europe will get "Schaeubled" again in 2012!
Yesterday:
• Schedule for Week of Dec 25th
• Summary for Week ending Dec 23rd
Happy Holidays!
Happy Holidays!
by Calculated Risk on 12/25/2011 09:31:00 AM
Happy Holidays and Merry Christmas to all!
• A better job market would be a great present for 2012. Although hiring will probably remain sluggish, there is a little good news ... from Greg Robb at MarketWatch: Jobless Claims becoming tought to ignore
While it is a bit of a stretch to say that economists are snug in their beds with visions of jobless claims dancing in their heads, there is no denying that they are growing more excited about the improvement in claims over the past month and will be focusing on that release in the holiday-shortened week.• And a little gift ... a common question, using excel, is how do you get from this:
“People are going to be focusing pretty heavily on claims,” said Josh Shapiro, chief U.S. economist at MFR Inc.
Claims have fallen by 40,000 over the past four weeks to a post-recession low of 364,000. After initial doubts when the decline started, many analysts are putting more weight on the down trend.
Yesterday:
• Schedule for Week of Dec 25th
• Summary for Week ending Dec 23rd
Thanks to all. Happy Holidays!
Saturday, December 24, 2011
Interview with Stand Up economist Yoram Bauman
by Calculated Risk on 12/24/2011 07:08:00 PM
Earlier:
• Schedule for Week of Dec 25th
• Summary for Week ending Dec 23rd
Bauman discusses a number of topics. He has spent the last 5 months in China - see his earlier video here on the Chinese housing bubble - and he doesn't think the Chinese economy is "not slowing down".
Some humor (the knock knock joke at the end is pretty funny - especially the goof by the interviewer).
Schedule for Week of Dec 25th
by Calculated Risk on 12/24/2011 02:07:00 PM
Earlier:
• Summary for Week ending Dec 23rd
Happy Holidays! This will be a light week for U.S. economic data. The Case-Shiller house price index will be released on Tuesday. Also the December Chicago PMI and three more regional Fed manufacturing surveys will released this week.
All US markets will be closed in observance of the Christmas Day holiday.
 9:00 AM: S&P/Case-Shiller House Price Index for October. Although this is the October report, it is really a 3 month average of August, September and October.
 This graph shows the nominal seasonally adjusted Composite 10 and Composite 20 indexes (the Composite 20 was started in January 2000).
The consensus is for a 0.2% decrease in prices in October. The CoreLogic index showed a 1.3% decrease in October (NSA). I expect new post-bubble lows for the Case-Shiller indexes (seasonally adjusted).
10:00 AM: Conference Board's consumer confidence index for December. The consensus is for an increase to 58.1 from 56.0 last month.
10:00 AM: Richmond Fed Survey of Manufacturing Activity for December. The consensus is for the index to be at 5, up from 0 in November (above zero is expansion).
10:30 AM: Dallas Fed Manufacturing Survey for December. The index showed contraction in November with a reading of -5.1 (the only regional survey showing contraction).
7:00 AM: The Mortgage Bankers Association (MBA) will release the mortgage purchase applications index. This index has been especially weak all year, although this doesn't include cash buyers.
8:30 AM: The initial weekly unemployment claims report will be released. Last week was the lowest level for the 4-week average of weekly claims since early 2008.
9:45 AM: Chicago Purchasing Managers Index for December. The consensus is for a decrease to 60.1 from 62.6 in November.
10:00 AM: Pending Home Sales Index for November. The consensus is for a 1.5% increase in the index.
11:00 AM: Kansas City Fed regional Manufacturing Survey for December. The consensus is for the index to be at 6, up from 4 in November (above zero is expansion).
No releases scheduled.
Summary for Week Ending December 23rd
by Calculated Risk on 12/24/2011 08:51:00 AM
This was another week with mostly improving U.S. economic data. Housing starts increased - mostly due to multi-family starts, and new home sales ticked up slightly (still mostly moving sideways).
Existing home sales were revised down sharply, but the good news is listed inventory has fallen to 2005 levels. Of course there is still a large "shadow inventory", and there are many more homeowners waiting for a better market - but the decline in listed inventory is a positive.
Also builder confidence increased slightly (still depressed), the Architecture Billings Index increased (and is indicating expansion again), consumer sentiment has rebounded from the recent lows, and initial weekly unemployment claims are at the lowest level since early 2008.
Personal income and spending was sluggish in November, but most of the data showed a little improvement.
Here is a summary of last week in graphs:
• Housing Starts increased in November
 Click on graph for larger image.
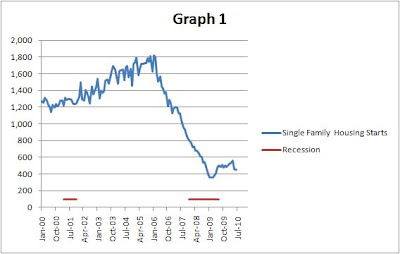
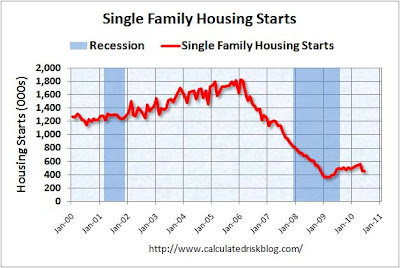
Total housing starts were at 685 thousand (SAAR) in November, up 9.3% from the revised October rate of 627 thousand (SAAR). Most of the increase this year has been for multi-family starts, but single family starts are increasing a little recently too.
Single-family starts increased 2.3% to 447 thousand in November.
Multi-family starts are increasing in 2011 - although from a very low level. This was well above expectations of 630 thousand starts in November.
Single family starts are still mostly "moving sideways".
• New Home Sales increased in November to 315,000 SAAR
 The Census Bureau reports New Home Sales in November were at a seasonally adjusted annual rate (SAAR) of 315 thousand. This was up from a revised 310 thousand in October (revised up from 307 thousand).
This graph shows New Home Sales vs. recessions since 1963. The dashed line is the current sales rate.
The next graph shows New Home Months of Supply.
 Months of supply decreased to 6.0 in November.
 The all time record was 12.1 months of supply in January 2009
This is now close to normal (less than 6 months supply is normal).
The seasonally adjusted estimate of new houses for sale at the end of November was 158,000. This represents a supply of 6.0 months at the current sales rate.
 Starting in 1973 the Census Bureau broke inventory down into three categories: Not Started, Under Construction, and Completed.
This graph shows the three categories of inventory starting in 1973.
The inventory of completed homes for sale was at 59,000 units in November. The combined total of completed and under construction is at the lowest level since this series started.
New home sales have averaged only 300 thousand SAAR over the 19 months since the expiration of the tax credit ... mostly moving sideways at a very low level ... although sales have been increasing a little lately.
• Existing Home Sales in November: 4.42 million SAAR, 7.0 months of supply
Note: this includes the downward revisions for years 2007 through 2011.
The NAR reports: Existing-Home Sales Continue to Climb in November
Total existing-home sales, which are completed transactions that include single-family, townhomes, condominiums and co-ops, increased 4.0 percent to a seasonally adjusted annual rate of 4.42 million in November from 4.25 million in October, and are 12.2 percent above the 3.94 million-unit pace in November 2010.
 This graph shows existing home sales, on a Seasonally Adjusted Annual Rate (SAAR) basis since 1993.
 Sales in November 2011 (4.42 million SAAR) were 4.0% higher than last month, and were 12.2% above the November 2010 rate.
The next graph shows the year-over-year (YoY) change in reported existing home inventory and months-of-supply. Since inventory is not seasonally adjusted, it really helps to look at the YoY change. Note: Months-of-supply is based on the seasonally adjusted sales and not seasonally adjusted inventory.
 Inventory decreased 18.1% year-over-year in November from November 2010. This is the ninth consecutive month with a YoY decrease in inventory.
Months of supply decreased to 7.0 months in November, down from 7.7 months in October. This is still a little higher than normal.
• Personal Income increased 0.1% in November, Spending increased 0.1%
 This graph shows real Personal Consumption Expenditures (PCE) through November (2005 dollars).
PCE increased 0.1% in November, and real PCE increased 0.2%.
Note: The PCE price index, excluding food and energy, increased 0.1 percent.
The personal saving rate was at 3.5% in November.
Both personal income and spending were lower than expectations. Using the "two month" method to forecast real Q4 PCE growth suggests an increase of about 2.9% in Q4. However September was especially strong (the two month method uses the first two months of a quarter), so Q4 PCE growth will probably be closer to 2.5%.
• AIA: Architecture Billings Index increased in November
 This graph shows the Architecture Billings Index since 1996. The index increased to 52.0 in November from 49.4 in October. Anything above 50 indicates expansion in demand for architects' services.
Note: This includes commercial and industrial facilities like hotels and office buildings, multi-family residential, as well as schools, hospitals and other institutions.
According to the AIA, there is an "approximate nine to twelve month lag time between architecture billings and construction spending" on non-residential construction. So this suggests further declines in CRE investment in 2012, but perhaps stabilizing later in 2012 - if this doesn't take another dip.
• Weekly Initial Unemployment Claims decline to 364,000

This graph shows the 4-week moving average of weekly claims since January 1971.
The dashed line on the graph is the current 4-week average. The four-week average of weekly unemployment claims decreased this week to 380,250.
This is the lowest level for weekly claims - and the lowest level for the 4-week average - since early 2008.
This survey was for the BLS reference week for the employment report, so this suggests an increase in payroll jobs in December (compared to November).
• Final December Consumer Sentiment at 69.9
 The final December Reuters / University of Michigan consumer sentiment index increased to 69.9, up from the preliminary reading of 67.7, and up from the November reading of 64.1.
Most of the recent sharp decline was event driven due to the debt ceiling debate, and sentiment has rebounded as expected. Now it is all about jobs - and gasoline prices.
Sentiment is still very weak, although above the consensus forecast of 68.0.
• Other Economic Stories ...
• NAHB Builder Confidence index increases in December
• ATA Trucking Index increased 0.3% in November
• Chicago Fed: Economic activity index declined in November
• Philly Fed State Coincident Indexes increased in November
• Residential Remodeling Index at new high in October
• Q3 2011: Mortgage Equity Withdrawal strongly negative


