by Calculated Risk on 10/06/2018 08:11:00 AM
Saturday, October 06, 2018
Schedule for Week of October 7, 2018
The key economic report this week is the September Consumer Price Index (CPI).
Columbus Day Holiday: Banks will be closed in observance of Columbus Day. The stock market will be open. No economic releases are scheduled.
6:00 AM: NFIB Small Business Optimism Index for September.
7:00 AM ET: The Mortgage Bankers Association (MBA) will release the results for the mortgage purchase applications index.
8:30 AM: The Producer Price Index for September from the BLS. The consensus is a 0.2% increase in PPI, and a 0.2% increase in core PPI.
8:30 AM: The initial weekly unemployment claims report will be released. The consensus is for 210 thousand initial claims, up from 207 thousand the previous week.
8:30 AM: The Consumer Price Index for September from the BLS. The consensus is for a 0.2% increase in CPI, and a 0.2% increase in core CPI.
10:00 AM: University of Michigan's Consumer sentiment index (Preliminary for October).
Friday, October 05, 2018
AAR: September Rail Carloads Up 2.6% YoY, Intermodal Up 6.2% YoY
by Calculated Risk on 10/05/2018 05:33:00 PM
From the Association of American Railroads (AAR) Rail Time Indicators. Graphs and excerpts reprinted with permission.
Weakness in a few commodity categories notwithstanding, rail traffic in September 2018 was consistent with the economy we have today in which fundamentals like industrial output and consumer spending are solid. Total U.S. carloads were up 2.6%, or 26,826 carloads, in September 2018 over September 2017, their seventh straight year-over-year increase.
…
Intermodal volume in September was up 6.2%, their 20th straight monthly increase. The last two weeks of September 2018 were the two highest-volume U.S. intermodal weeks in history.
 Click on graph for larger image.
This graph from the Rail Time Indicators report shows U.S. average weekly rail carloads (NSA). Light blue is 2018.
Rail carloads have been weak over the last decade due to the decline in coal shipments.
U.S. railroads originated 1,066,826 carloads in September 2018, up 2.6%, or 26,826 carloads, over September 2017 and the seventh straight year-over-year monthly increase for total carloads. Carloads averaged 266,707 per week in September 2018, the most for September since 2015.
 The second graph is for intermodal traffic (using intermodal or shipping containers):
September 2018 was another good month for intermodal, with total container and trailer originations totaling 1,127,385 — up 6.2%, or 65,801 units, over September 2017. Average weekly intermodal volume in September 2018 was 281,846 units, easily an all-time record for September.2018 will be another record year for intermodal traffic.
Q3 GDP Forecasts
by Calculated Risk on 10/05/2018 03:51:00 PM
From Merrill Lynch:
We continue to track 3Q GDP at 3.7% qoq saar as stronger than expected vehicle sales were offset by weaker core capital goods shipments [Oct 5 estimate].From Goldman Sachs:
emphasis added
We boosted our Q3 GDP tracking estimate by two tenths to +3.3% (qoq ar) [Oct 5 estimate].And from the Altanta Fed: GDPNow
The GDPNow model estimate for real GDP growth (seasonally adjusted annual rate) in the third quarter of 2018 is 4.1 percent on October 5, unchanged from October 1. [Oct 5 estimate]From the NY Fed Nowcasting Report
The New York Fed Staff Nowcast stands at 2.3% for 2018:Q3 and 2.8% for 2018:Q4. [Oct 5 estimate]CR Note: It looks like GDP will be in the 3s in Q3.
Annual Vehicle Sales: On Pace to decline in 2018
by Calculated Risk on 10/05/2018 02:37:00 PM
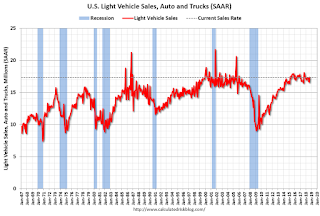
The BEA released their estimate of September vehicle sales. The BEA estimated sales of 17.36 million SAAR in September 2018 (Seasonally Adjusted Annual Rate), up 4.5% from the August sales rate, and down 4.0% from September 2017 (Sales in September 2017 were strong following the hurricanes).
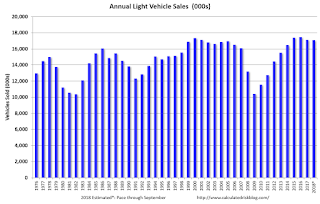
Through September, light vehicle sales are on pace to be down slightly in 2018 compared to 2017.
This would make 2018 the sixth best year on record after 2016, 2015, 2000, 2017 and 2001.
Click on graph for larger image.
This graph shows annual light vehicle sales since 1976. Source: BEA.
Sales for 2018 are estimated based on the pace of sales during the first nine months.
The second graph shows light vehicle sales since the BEA started keeping data in 1967.

My guess is vehicle sales will finish the year with sales lower than in 2017 (sales in late 2017 were boosted by buying following the hurricanes), and will probably be at or below 17 million for the year (the lowest since 2014).
A small decline in sales this year isn't a concern - I think sales will move mostly sideways at near record levels.
As I noted last year, this means the economic boost from increasing auto sales is over (from the bottom in 2009, auto sales boosted growth every year through 2016).
Comments on September Employment Report
by Calculated Risk on 10/05/2018 11:50:00 AM
The headline jobs number at 134,000 for September was below consensus expectations of 180 thousand, however the previously two months were revised up by a combined 87 thousand. The unemployment rate fell to the lowest since December 1969. Overall this was a solid report.
Earlier: September Employment Report: 134,000 Jobs Added, 3.7% Unemployment Rate
In September, the year-over-year employment change was 2.537 million jobs. This is solid year-over-year growth.
Average Hourly Earnings
Wage growth was above expectations in September. From the BLS:
"In September, average hourly earnings for all employees on private nonfarm payrolls rose by 8 cents to $27.24. Over the year, average hourly earnings have increased by 73 cents, or 2.8 percent."
 Click on graph for larger image.
This graph is based on “Average Hourly Earnings” from the Current Employment Statistics (CES) (aka "Establishment") monthly employment report. Note: There are also two quarterly sources for earnings data: 1) “Hourly Compensation,” from the BLS’s Productivity and Costs; and 2) the Employment Cost Index which includes wage/salary and benefit compensation.
The graph shows the nominal year-over-year change in "Average Hourly Earnings" for all private employees. Nominal wage growth was at 2.8% YoY in September.
Wage growth has generally been trending up.
Prime (25 to 54 Years Old) Participation
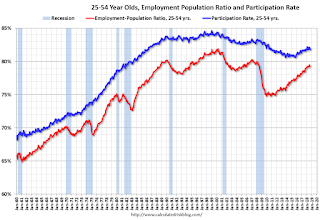
 Since the overall participation rate has declined due to cyclical (recession) and demographic (aging population, younger people staying in school) reasons, here is the employment-population ratio for the key working age group: 25 to 54 years old.
In the earlier period the participation rate for this group was trending up as women joined the labor force. Since the early '90s, the participation rate moved more sideways, with a downward drift starting around '00 - and with ups and downs related to the business cycle.
The 25 to 54 participation rate decreased in September to 81.8%, and the 25 to 54 employment population ratio was unchanged at 79.3%. .
Part Time for Economic Reasons
 From the BLS report:
"The number of persons employed part time for economic reasons (sometimes referred to as involuntary part- time workers) increased by 263,000 to 4.6 million in September. These individuals, who would have preferred full-time employment, were working part time because their hours had been reduced or they were unable to find full-time jobs."The number of persons working part time for economic reasons has been generally trending down, however the number increased in September. The number working part time for economic reasons suggests there is still a little slack in the labor market.
These workers are included in the alternate measure of labor underutilization (U-6) that increased to 7.5% in September.
Unemployed over 26 Weeks
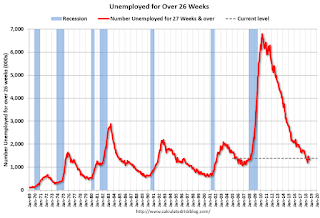
 This graph shows the number of workers unemployed for 27 weeks or more.
 According to the BLS, there are 1.384 million workers who have been unemployed for more than 26 weeks and still want a job. This was up from 1.332 million in August.
Summary:
The headline jobs number was below expectations, however the previous two months were revised up.
The headline unemployment rate declined to 3.7%, the lowest rate since 1969. And wage growth was slightly above expectations.
Overall, this was a solid report. For the first nine months of 2018, job growth has been solid, averaging 208 thousand per month.
Trade Deficit increased to $53.2 Billion in August
by Calculated Risk on 10/05/2018 11:23:00 AM
Earlier from the Department of Commerce reported:
The U.S. Census Bureau and the U.S. Bureau of Economic Analysis announced today that the goods and services deficit was $53.2 billion in August, up $3.2 billion from $50.0 billion in July, revised.
August exports were $209.4 billion, $1.7 billion less than July exports. August imports were $262.7 billion, $1.5 billion more than July imports.
 Click on graph for larger image.
Exports decreased and imports increased in August.
Exports are 27% above the pre-recession peak and up 7% compared to August 2017; imports are 13% above the pre-recession peak, and up 10% compared to August 2017.
In general, trade has been picking up.
The second graph shows the U.S. trade deficit, with and without petroleum.
 The blue line is the total deficit, and the black line is the petroleum deficit, and the red line is the trade deficit ex-petroleum products.
Oil imports averaged $62.63 in August, down from $64.63 in July, and up from $44.13 in August 2017.
The trade deficit with China increased to $38.6 billion in August, from $35.0 billion in August 2017.
September Employment Report: 134,000 Jobs Added, 3.7% Unemployment Rate
by Calculated Risk on 10/05/2018 08:43:00 AM
From the BLS:
The unemployment rate declined to 3.7 percent in September, and total nonfarm payroll employment increased by 134,000, the U.S. Bureau of Labor Statistics reported today. Job gains occurred in professional and business services, in health care, and in transportation and warehousing.
Hurricane Florence affected parts of the East Coast during the September reference periods for the establishment and household surveys. Response rates for the two surveys were within normal ranges.
...
The change in total nonfarm payroll employment for July was revised up from +147,000 to +165,000, and the change for August was revised up from +201,000 to +270,000. With these revisions, employment gains in July and August combined were 87,000 more than previously reported.
...
In September, average hourly earnings for all employees on private nonfarm payrolls rose by 8 cents to $27.24. Over the year, average hourly earnings have increased by 73 cents, or 2.8 percent.
emphasis added
 Click on graph for larger image.
The first graph shows the monthly change in payroll jobs, ex-Census (meaning the impact of the decennial Census temporary hires and layoffs is removed - mostly in 2010 - to show the underlying payroll changes).
Total payrolls increased by 134 thousand in September (private payrolls increased 121 thousand).
Payrolls for July and August were revised up by a combined 87 thousand.
 This graph shows the year-over-year change in total non-farm employment since 1968.
In September the year-over-year change was 2.537 million jobs.
The third graph shows the employment population ratio and the participation rate.
 The Labor Force Participation Rate was unchanged in September at 62.7%. This is the percentage of the working age population in the labor force. A large portion of the recent decline in the participation rate is due to demographics and long term trends.
The Employment-Population ratio increased to 60.4% (black line).
I'll post the 25 to 54 age group employment-population ratio graph later.
 The fourth graph shows the unemployment rate.
 The unemployment rate declined in September to 3.7%.
This was below consensus expectations of 180,000 jobs, however the previous two months combined were revised up by 87,000. A solid report.
I'll have much more later ...
Thursday, October 04, 2018
Friday: Employment Report, Trade Deficit and some Hiking Pictures
by Calculated Risk on 10/04/2018 07:06:00 PM
My September Employment Preview
Goldman: September Payrolls Preview
Friday:
• At 8:30 AM, Employment Report for September. The consensus is for an increase of 180,000 non-farm payroll jobs in September, down from the 201,000 non-farm payroll jobs added in August. The consensus is for the unemployment rate to decline to 3.8%.
• At 8:30 AM, Trade Balance report for August from the Census Bureau. The consensus is for a deficit of $53.7 billion, from $50.1 billion deficit in July.
• At 3:00 PM, Consumer Credit from the Federal Reserve. The consensus is for consumer credit to increase $15.0 billion in August.
 I've returned from my hiking trip in Peru. As part of the trip, my friends and I hiked the Old Inka Trail to Machu Picchu (with an amazing group of people from around the world).
It was an incredible journey, and the engineering effort to build the trail was stunning (over 500 years ago).
Here are a few pictures from my Trip. The first picture is from an overlook of Machu Picchu.
The views in every direction were amazing. Machu Picchu is at an elevation of 7,792', and is surrounded by lush vegetation and soaring peaks. We climbed the peak in the back shrouded in clouds (Waynapicchu, elevation 8,752')
For those who want to hike the trail, I recommend Alpaca Expeditions (our lead guide, Yoel, was very knowledgeable and funny)!
 For those who aren't excited by hiking, you can take the train to Agua Caliente, and the bus up the hill to Machu Picchu (we took the bus down and train back). There are many other things to see in Peru (like the colonial city of Cusco, Rainbow mountain and much more)
The second photo is at the top of Dead Woman's Pass. This is the high point of the trail at 4,215 meters above sea level (about 13,800').
There are two high passes on the trail (both on Day 2), and on night 2 we slept at close to 13,000'.
This pass is named after a mountain formation that looks like a woman lying on her back, not because of some tragedy.
 The third photo is of some ruins we passed along the way.
There are frequent Inka ruins along the trail; each amazing.
We had a great trip, and I'm looking forward to returning to Peru and South America.
Now back to blogging, Best to all.
Goldman: September Payrolls Preview
by Calculated Risk on 10/04/2018 03:03:00 PM
A few brief excerpts from a note by Goldman Sachs economist Spencer Hill:
We estimate that nonfarm payrolls increased 175k in September, compared to consensus of +184k. While we believe the underlying pace of job growth likely accelerated from the +185k average pace this summer, our forecast reflects a temporary drag of around 33k from Hurricane Florence, which struck the Carolinas during the payroll reference week. ...CR: Note that Goldman is expecting Hurricane Florence to reduce employment by 33,000 in September.
We estimate the unemployment rate edged down one tenth to 3.8% … we expect average hourly earnings to increase 0.3% month over month in tomorrow’s report ... We estimate the year-on-year rate fell by two tenths to 2.7% ...
emphasis added
September Employment Preview
by Calculated Risk on 10/04/2018 01:01:00 PM
On Friday at 8:30 AM ET, the BLS will release the employment report for September. The consensus is for an increase of 180,000 non-farm payroll jobs in September (with a range of estimates between 150,000 to 195,000), and for the unemployment rate to decline to 3.8%.
The BLS reported 201,000 jobs added in August.
Here is a summary of recent data:
• The ADP employment report showed an increase of 230,000 private sector payroll jobs in August. This was well above consensus expectations of 179,000 private sector payroll jobs added. The ADP report hasn't been very useful in predicting the BLS report for any one month, but in general, this suggests employment growth above expectations.
• The ISM manufacturing employment index increased in September to 58.8%. A historical correlation between the ISM manufacturing employment index and the BLS employment report for manufacturing, suggests that private sector BLS manufacturing payroll increased about 30,000 in September. The ADP report indicated manufacturing jobs increased 7,000 in September.
The ISM non-manufacturing employment index increased in September to 62.4%. A historical correlation between the ISM non-manufacturing employment index and the BLS employment report for non-manufacturing, suggests that private sector BLS non-manufacturing payroll jobs increased significantly in September (this is a very high reading, and with the only other reading recently in this range, the BLS report only 139 thousand non-manufacturing jobs added).
Combined, the ISM indexes suggests employment gains of over 300,000. This suggests employment growth well above expectations.
• Initial weekly unemployment claims averaged 207,000 in September, down from 209,500 in July. For the BLS reference week (includes the 12th of the month), initial claims were at 202,000, down from 210,000 during the reference week in August.
The decrease during the reference week suggests a solid employment report in September. Note: Based on unemployment claims, it appears there will be little or no impact from Hurricane Florence on the employment report.
• The final September University of Michigan consumer sentiment index increased to 100.1 from the August reading of 96.2. Sentiment is frequently coincident with changes in the labor market, but there are other factors too like gasoline prices and politics.
• Merrill Lynch has introduced a new payrolls tracker based on private internal BAC data. The tracker suggests private payrolls increased by 234,000 in September, and this suggests employment growth above expectations.
• Looking back at the three previous years:
In September 2017, the consensus was for 100,000 jobs, and the BLS reported 33,000 jobs lost (Hurricane impacted and revised up later).
In September 2016, the consensus was for 168,000 jobs, and the BLS reported 156,000 jobs added.
In September 2015, the consensus was for 203,000 jobs, and the BLS reported 142,000 jobs added.
Even excluding September 2017 due to the hurricanes, it looks like the consensus is frequently too high for the month of September.
• Conclusion: These reports suggest a strong employment report in September. Only the previous history (last three years) would suggest a somewhat disappointing report. My guess is the report will be above expectations.


