 RSS Feed
 by Calculated Risk on 11/01/2010 05:45:00 PM
Monday, November 01, 2010
Real Estate Brokers' Commissions Lowest since 1982 as Percent of GDP
More from the Q3 2010 GDP underlying detail tables ...
Note: Residential investment (RI), according to the Bureau of Economic Analysis (BEA), includes new single family structures, multifamily structures, home improvement, broker's commissions, and a few minor categories.
 Click on graph for larger image in new window.
This graph shows the various components of RI as a percent of GDP for the last 50 years. Usually the most important components are investment in single family structures followed by home improvement.
Investment in home improvement was at a $146.6 billion Seasonally Adjusted Annual Rate (SAAR) in Q3 (1.0% of GDP), significantly above the level of investment in single family structures of $110.0 billion SAAR, or 0.75% of GDP.
Brokers' commissions also declined sharply in Q3 as the number of existing homes sold fell off a cliff in Q3. This has pushed brokers' commissions (0.33% of GDP), to the lowest level since 1982, as a percent of GDP.
Brokers' commissions peaked at 0.91% of GDP in Q3 2005. In nominal terms, commissions have declined from an annual peak rate of $116.5 billion in Q3 2005, to an annual rate of $48.2 billion in Q3 2010 - a decline of over 58%.
And investment in multifamily structures - already at a series low as a percent of GDP (since 1959) - declined further in Q3. This might be the low for multifamily structures since multifamily starts increased in recent months.
NMHC Quarterly Apartment Survey: Market Conditions Tighten
by Calculated Risk on 11/01/2010 03:29:00 PM
From the National Multi Housing Council (NMHC): Across-the-Board Improvement in the Apartment Industry, According to NMHC Quarterly Survey of Apartment Market Conditions
The Market Tightness Index, which measures changes in occupancy rates and/or rents, decreased from 83 to 77, but remained well above the “break-even” mark of 50. Sixty percent of respondents said markets were tighter, meaning lower vacancies and/or higher rents.
...
“While demand for apartment residences and apartment properties is still below the peak levels seen in the last decade, the further shift from owning to renting may well add to apartment demand in the near-term, while population growth and a rebound in household formation should strengthen demand over the longer term. But at some point, economic growth will have to shift into a higher gear for the apartment industry to see conditions continue to register improvements of this level.” [said NMHC Chief Economist Mark Obrinsky]

Click on graph for larger image in new window.
This graph shows the quarterly Apartment Tightness Index.
The index has indicated tighter market conditions for the last three quarters (from very weak conditions).
A reading above 50 suggests the vacancy rate is falling. Based on limited historical data, I think this index will lead reported apartment rents by about 6 months to 1 year.
This fits with the recent Reis data showing apartment vacancy rates fell in Q3 to 7.2% from 7.8% in Q2.
Also this data is a survey of large apartment owners only. The data released in late July from the Census Bureau showed the rental vacancy rate was steady in Q2 for all rental units in all areas. The Census Bureau will release the Q3 vacancy rates tomorrow, along with the homeownership rate.
A final note: The results of this survey suggest the rental market might have bottomed. I heard from a few sources that effective rents increased slightly over the first half of 2010 at some large apartment complexes. Just something to be aware of ... (I've posted about this before).
Q3: Office, Mall and Lodging Investment
by Calculated Risk on 11/01/2010 01:05:00 PM
First - the advance Q3 GDP report released last Friday showed an annualized real increase of 3.9% for investment in non-residential structures. This broke a streak of eight straight quarterly declines. However the construction spending report released this morning suggests that most (probably all) of this gain will be revised away.
Second - with the release of underlying detail data today - we can see that most of the reported small gains for non-residential structure investment in Q3 were for power and petroleum mining structures.
If we look at just office, mall and lodging investment, non-residential structure investment continued to decline in Q3.
 Click on graph for larger image in new window.
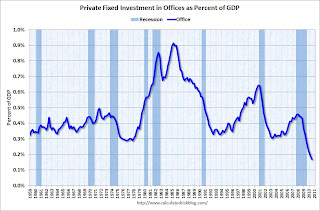
This graph shows investment in offices as a percent of GDP. Office investment as a percent of GDP peaked at 0.46% in Q1 2008 and has declined sharply to a new series low as a percent of GDP (data series starts in 1959).
Reis reported that the office vacancy rate is at a 17 year high at 17.5% in Q3, up from 17.4% in Q2, and 16.6% in Q3 2009. With the office vacancy rate still rising, office investment will probably decline further - although most of the decline in investment has already happened.
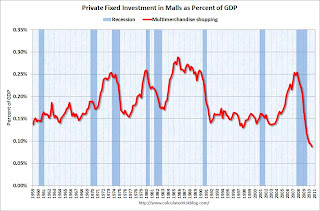 The second graph is for investment in malls.
Investment in multimerchandise shopping structures (malls) peaked in 2007 and has fallen by two-thirds (note that investment includes remodels, so this will not fall to zero). Mall investment is also at a series low (as a percent of GDP).
Reis reported that the mall vacancy rate declined slightly in Q3 2010 from the record high in Q2. However the vacancy rate will have to decline substantially before there is significant new investment.
 The third graph is for lodging (hotels).
The bubble boom in lodging investment was stunning. Lodging investment peaked at 0.32% of GDP in Q2 2008 and has fallen by over 70% already.
As projects are completed there will be little new investment in these categories for some time.
Also notice that investment for all three categories typically falls for a year or two after the end of a recession, and then usually recovers very slowly (flat as a percent of GDP for 2 or 3 years). Something similar will probably happen again, and there will not be a recovery in these categories until the vacancy rates fall significantly.
Private Construction Spending Flat in September: July and August Revised Down
by Calculated Risk on 11/01/2010 10:53:00 AM
The Census Bureau reported overall construction spending increased in September compared to August.
[C]onstruction spending during September 2010 was estimated at a seasonally adjusted annual rate of $801.7 billion, 0.5 percent (±1.9%)* above the revised August estimate of $797.5 billion.However private construction spending was about the same as the downwardly revised August rate:
Spending on private construction was at a seasonally adjusted annual rate of $482.0 billion, nearly the same as (±1.1%)* the revised August estimate of $481.9 billion. [revised down from $498.2 billion]
 Click on graph for larger image in new window.
This graph shows private residential and nonresidential construction spending since 1993. Note: nominal dollars, not inflation adjusted.
Residential spending is 65.7% below the peak early 2006, and non-residential spending is 39.5% from the peak in January 2008.
The downward revisions to construction spending in July and August were significant.
These downward revisions will negatively impact Q3 GDP for both residential investment, and non-residential investment in structures.
ISM Manufacturing Index increases to 56.9 in October
by Calculated Risk on 11/01/2010 10:00:00 AM
PMI at 56.9% in October, up from 54.4% in September. The consensus was for an increase to 54.5%.
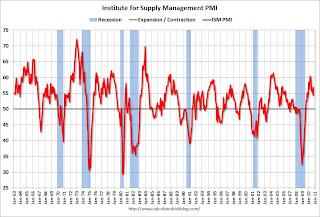
From the Institute for Supply Management: October 2010 Manufacturing ISM Report On Business®
The report was issued today by Norbert J. Ore, CPSM, C.P.M., chair of the Institute for Supply Management™ Manufacturing Business Survey Committee. "The manufacturing sector grew during October, with both new orders and production making significant gains. Since hitting a peak in April, the trend for manufacturing has been toward slower growth. However, this month's report signals a continuation of the recovery that began 15 months ago, and its strength raises expectations for growth in the balance of the quarter. Survey respondents note the recovery in autos, computers and exports as key drivers of this growth. Concerns about inventory growth are lessened by the improvement in new orders during October. With 14 of 18 industries reporting growth in October, manufacturing continues to outperform the other sectors of the economy."
 Click on graph for larger image in new window.
Here is a long term graph of the ISM manufacturing index.
In addition to the increase in the PMI, the ISM's new orders index was up sharply to 58.9 from 51.1 in September.
The employment index increased to 57.7 from 56.5 in September.
And the inventory index declined to 53.9 from 55.6, but this was the 4th month in a row of increasing inventories.
The internals were stronger this month. It was just last month that Ore cautioned that the new orders and inventory indexes were "sending strong negative signals of weakening performance in the [manufacturing] sector".
The increase in the ISM index was in line with the increases in the regional Fed manufacturing surveys.
Personal income declines 0.1%, Spending increases 0.2% in September
by Calculated Risk on 11/01/2010 08:30:00 AM
From the BEA: Personal Income and Outlays, June 2010
Personal income decreased $16.8 billion, or 0.1 percent, and disposable personal income (DPI) decreased $20.3 billion, or 0.2 percent, in September ... Personal consumption expenditures (PCE) increased $17.3 billion, or 0.2 percent.
...
Real PCE -- PCE adjusted to remove price changes -- increased 0.1 percent in September, compared with an increase of 0.3 percent in August.
...
Personal saving as a percentage of disposable personal income was 5.3 percent in September, compared with 5.6 percent in August.
 Click on graph for large image.
This graph shows real personal income less transfer payments since 1969.
This measure of economic activity is moving sideways - similar to what happened following the 2001 recession.
This month the saving rate decreased ...
 This graph shows the saving rate starting in 1959 (using a three month trailing average for smoothing) through the Setpember Personal Income report.
 In September, income declined 0.1%, and spending increased 0.2% - so the saving rate decreased to 5.3% in September (5.5% using a three month average).
I expect the saving rate to rise some more over the next year, perhaps to 8% or so - keeping the pace of PCE growth below income growth.


