 RSS Feed
 by Calculated Risk on 8/02/2010 12:06:00 PM
Monday, August 02, 2010
Private Construction Spending declines in June
Overall construction spending increased slightly in June, and private construction spending, both residential and non-residential, decreased in June. Click on graph for larger image in new window.
This graph shows private residential and nonresidential construction spending since 1993. Note: nominal dollars, not inflation adjusted.
Residential spending is now 62% below the peak of early 2006.
Private non-residential construction was revised down for both April and May, and spending is now 35% below the peak of late 2008.
From the Census Bureau: June 2010 Construction at $836.0 Billion Annual Rate
The U.S. Census Bureau of the Department of Commerce announced today that construction spending during June 2010 was estimated at a seasonally adjusted annual rate of $836.0 billion, 0.1 percent (±1.6%)* above the revised May estimate of $834.8 billion.I expect:
...
Spending on private construction was at a seasonally adjusted annual rate of $527.6 billion, 0.6 percent (±1.3%)* below the revised May estimate of $530.9 billion. Residential construction was at a seasonally adjusted annual rate of $258.3 billion in June, 0.8 percent (±1.3%)* below the revised May estimate of $260.3 billion. Nonresidential construction was at a seasonally adjusted annual rate of $269.3 billion in June, 0.5 percent (±1.3%)* below the revised May estimate of $270.6 billion.
Residential spending will probably exceed non-residential later this year (or early 2011), but that will be mostly because of weakness in non-residential construction, as opposed to any significant increases in residential spending.
Bernanke: Challenges for the Economy and State Governments
by Calculated Risk on 8/02/2010 10:18:00 AM
From Fed Chairman Ben Bernanke: Challenges for the Economy and State Governments
On the economy:
While the support to economic activity from stimulative fiscal policies and firms' restocking of their inventories will diminish over time, rising demand from households and businesses should help sustain growth. In particular, in the household sector, growth in real consumer spending seems likely to pick up in coming quarters from its recent modest pace, supported by gains in income and improving credit conditions. In the business sector, investment in equipment and software has been increasing rapidly, in part as a result of the deferral of capital outlays during the downturn and the need of many businesses to replace aging equipment. At the same time, rising U.S. exports, reflecting the expansion of the global economy and the recovery of world trade, have helped foster growth in the U.S. manufacturing sector.On state and local governments:
To be sure, notable restraints on the recovery persist. The housing market has remained weak, with the overhang of vacant or foreclosed houses weighing on home prices and new construction. Similarly, poor economic fundamentals and tight credit are holding back investment in nonresidential structures, such as office buildings, hotels, and shopping malls.
Importantly, the slow recovery in the labor market and the attendant uncertainty about job prospects are weighing on household confidence and spending. After two years of job losses, private payrolls expanded at an average of about 100,000 per month during the first half of this year, an improvement but still a pace insufficient to reduce the unemployment rate materially. In all likelihood, significant time will be required to restore the nearly 8-1/2 million jobs that were lost over 2008 and 2009. Moreover, nearly half of the unemployed have been out of work for longer than six months.
Cuts in state and local programs and employment are also weighing on economic activity. These cuts principally reflect the historically large decreases in state tax revenues during the recession. Sales tax revenues have declined with household and business spending, and income tax revenues have been hit by drops in wages and salaries, capital gains, and corporate profits. In contrast, property tax revenues collected by local governments generally held up well through the beginning of this year, although reappraisals of the values of homes and commercial properties may affect those collections in the future.This is a fairly positive outlook for the overall economy, but less so for local governments.
...
With revenues down and Medicaid spending up, other categories of spending by state governments have been tightly squeezed. Over the past year, numerous state governments have laid off or furloughed employees, decreased capital spending, and reduced aid to local governments. Indeed, state and local payrolls have fallen by more than 200,000 jobs from their peak near the end of 2008. Some states have also raised taxes, but the weak economy has made it difficult to find significant new revenues.
Assistance from the federal government, especially through the fiscal stimulus package, has eased, but certainly not eliminated, the budget difficulties faced by states. Although states and localities will continue to receive significant aid this year, that source of help will be winding down next year.
On a more positive note, state and local tax revenues seem set to increase as economic activity expands.
ISM Manufacturing Index declines in July
by Calculated Risk on 8/02/2010 10:00:00 AM
PMI at 55.5% in July down from 56.2% in June.
From the Institute for Supply Management: July 2010 Manufacturing ISM Report On Business®
Economic activity in the manufacturing sector expanded in July for the 12th consecutive month, and the overall economy grew for the 15th consecutive month, say the nation's supply executives in the latest Manufacturing ISM Report On Business®.
The report was issued today by Norbert J. Ore, CPSM, C.P.M., chair of the Institute for Supply Management™ Manufacturing Business Survey Committee. "Manufacturing continued to grow during July, but at a slightly slower rate than in June. Employment, supplier deliveries and inventories improved during the month and reduced the impact of a month-over-month deceleration in new orders and production. July marks 12 consecutive months of growth in manufacturing, and indications are that demand is still quite strong in 10 of 18 industries. The prices that manufacturers paid for their inputs were slightly higher but stable, with only a few items on the short supply list."
...
ISM's New Orders Index registered 53.5 percent in July, which is a decrease of 5 percentage points when compared to the 58.5 percent reported in June.
...
ISM's Employment Index registered 58.6 percent in July, which is 0.8 percentage point higher than the 57.8 percent reported in June. This is the eighth consecutive month of growth in manufacturing employment.
emphasis added
Sunday, August 01, 2010
NY Times: China State-owned companies move into real estate development
by Calculated Risk on 8/01/2010 08:52:00 PM
From David Barboza at the NY Times: State-Owned Groups Fuel China’s Real Estate Boom
All around the nation, giant state-owned oil, chemical, military, telecom and highway groups are bidding up prices on sprawling plots of land for big real estate projects unrelated to their core businesses.The story mentions a salt company building luxury high rises ... that seems very speculative!
...
By driving up property prices, the state-owned companies, which are ultimately controlled by the national government, are working at cross-purposes with the central government’s effort to keep China’s real estate boom from becoming a debt-driven speculative bubble ...
A repeat: Early this morning Part 5C of the Sovereign Default series: Some Policy Options, Good and Bad
Yesterday: Negative Equity Breakdown. The authors estimate there are 4.1 million homeowners with more than 50% negative equity, and another 5 million with 20% to 50% negative equity.
And How do you put recession bars on graphs using Excel?
China Slows, and a few posts of interest
by Calculated Risk on 8/01/2010 02:55:00 PM
The previous post was the weekly schedule (busy week ahead!) and summary of last week (scroll down for post).
Early this morning Part 5C of the Sovereign Default series: Some Policy Options, Good and Bad
From the WSJ: Chinese Manufacturing Growth Slows
China's manufacturing activity expanded at the slowest pace in 17 months in July ... China's official PMI ... fell to 51.2 in July from 52.1 in June, the third straight month in which it has declined. The reading was also closer to the expansionary threshold of 50 than it had been in 17 months. A reading below 50 signals contraction.Yesterday:
Weekly Summary and Schedule, August 1st
by Calculated Risk on 8/01/2010 11:55:00 AM
The key economic report this week will be the July Employment Report to be released on Friday. It will be a busy week ...
On Monday, the Census Bureau will release Construction Spending for June at 10 AM. The consensus is for a 0.5% decline in spending (although the tax credit related decline will show up in the July report). Also on Monday, the ISM manufacturing survey for July will be released at 10 AM ET. Most of the regional surveys suggest growth in the manufacturing sector slowed in July, and the consensus is for a decline in the ISM index to 54 from 56.2 in June.
Also on Monday, Fed Chairman Ben Bernanke will address the Southern Legislative Conference 64th Annual Meeting at 10:30 AM ET in Charleston, South Carolina. The title of his speech is: "Challenges for the Economy and State Governments"
On Tuesday, the BEA will release the June Personal Income and Outlays report. The consensus is for a 0.1% increase in income, and a 0.1% increase in spending. With the strong downwards revision in the GDP report for personal consumption expenditures, this report will be interesting (the savings rate increased too).
Also on Tuesday, the June Manufacturers' Shipments, Inventories and Order will be released at 10 AM, and the NAR will release Pending Home Sales for June. The collapse for pending home sales happened in May, and this report might show another slight decline.
Also on Tuesday, the automakers will report vehicle sales for July. Expectations are for about a 11.6 million SAAR for light vehicles in July – up from the 11.1 million sales rate in June. Some forecasts are even higher, from Edmunds:
Edmunds.com analysts predict that July's Seasonally Adjusted Annualized Rate (SAAR) will be 11.8 million, up from 11.1 in June 2010.Also on Tuesday, the American Bankruptcy Institute will probably report personal bankruptcy filings for July. This will probably show another "surge" in filings.
"July sales numbers should be the highest we've seen since last August's 'Cash for Clunkers' frenzy," reported Edmunds.com Senior Analyst Ray Zhou, PhD. "Retail demand for new cars this month has been the strongest of the year, even more than in March when Toyota launched an aggressive incentive campaign and other automakers followed suit."
On Wednesday, the ADP employment report will be released (consensus is for an increase of 35K private sector jobs, up from 13K in June). Also on Wednesday, the ISM non-manufacturing index for July will be released at 10 AM. The consensus is for a slight decline from the 53.8 June reading. Also on Wednesday, the MBA will release the mortgage Purchase Applications Index. This index collapsed following the tax credit, but has been bouncing around at a low level for the last couple of months.
Also on Wednesday, the quarterly NMHC Apartment Market Tightness index for July will probably be released. Last quarter this report showed a surprising tightening in the apartment market index, and some increases in effective rents.
On Thursday, the initial weekly unemployment claims report will be released. Consensus is for a slight decline to 455K from 457K last week.
And on Friday, the BLS will release the July Employment report at 8:30 AM. The consensus is for a loss of 70,000 payroll jobs in July, and for the unemployment rate to increase slightly to 9.6% (from 9.5%). Of course the minus 70,000 includes a substantial decline in the number of temporary hires for Census 2010 (May was the peak month). It will be important to remove the Census hiring to try to determine the underlying trend. Consensus is around a gain of 75,000 payroll jobs ex-Census. (see Estimate of July Decennial Census impact on payroll employment: minus 144,000 ).
As a reminder, the media stories on the employment report will be confusing because of the Census hiring. There are three numbers that will be reported:
All three numbers have meaning, but when trying to remove the impact of hiring for the decennial Census, the 2nd number is consistent with non-Census year reports.
Also on Friday the Fed will release Consumer Credit. The consensus is for another decline in credit of around $5 billion. And Friday afternoon will be another BFF (Bank Failure Friday) ...
And a summary of last week:
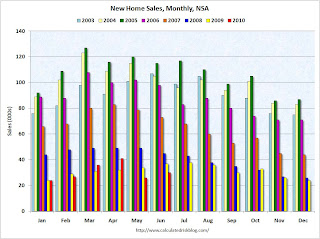
The Census Bureau reported New Home Sales in June were at a seasonally adjusted annual rate (SAAR) of 330 thousand. This is an increase from the record low of 267 thousand in May (revised from 300 thousand). Ignore all the month to previous month comparisons. May was revised down sharply and that makes the increase look significant. Here is the bottom line: this was the worst June for new home sales on record.
 Click on graph for larger image in new window.
This graph shows monthly new home sales (NSA - Not Seasonally Adjusted).
Note the Red columns for 2010. In June 2010, 30 thousand new homes were sold (NSA). This is a new record low for June.
The previous record low for the month of June was 34 thousand in 1982; the record high was 115 thousand in June 2005.
Here are more graphs based on the New Home sales report.
Special Note: I apologize for a couple of errors in my original GDP post. I make plenty of typos, but I usually get the math right. I corrected the error as soon as possible.
From the BEA:
Real gross domestic product ... increased at an annual rate of 2.4 percent in the second quarter of 2010 ... Real personal consumption expenditures increased 1.6 percent in the second quarter, compared with an increase of 1.9 percent in the first.Here is a summary of the revisions to prior years:
| Quarter | GDP before revisions | Current GDP estimate | Change |
|---|---|---|---|
| 2007-I | 1.2% | 0.9% | -0.3% |
| 2007-II | 3.2% | 3.2% | 0.0% |
| 2007-III | 3.6% | 2.3% | -1.3% |
| 2007-IV | 2.1% | 2.9% | 0.8% |
| 2008-I | -0.7% | -0.7% | 0.0% |
| 2008-II | 1.5% | 0.6% | -0.9% |
| 2008-III | -2.7% | -4.0% | -1.3% |
| 2008-IV | -5.4% | -6.8% | -1.4% |
| 2009-I | -6.4% | -4.9% | 1.5% |
| 2009-II | -0.7% | -0.7% | 0.0% |
| 2009-III | 2.2% | 1.6% | -0.6% |
| 2009-IV | 5.6% | 5.0% | -0.6% |
| 2010-I | 2.7% | 3.7% | 1.0% |
| 2010-II | 2.4% |
 The revisions indicate that the recession was worse than originally estimated, and the recovery slightly weaker.
Here is a graph of the real PCE revisions.
Annualized real PCE is now 0.85% below the pre-recession peak.
This was a substantial downward revision.
S&P/Case-Shiller released the monthly Home Price Indices for May (actually a 3 month average).
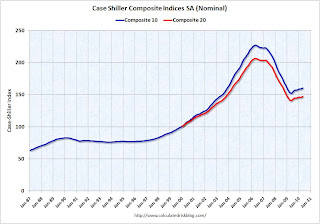 This graph shows the nominal seasonally adjusted Composite 10 and Composite 20 indices (the Composite 20 was started in January 2000).
The Composite 10 index is off 29.3% from the peak, and up 1.0% in May (SA).
The Composite 20 index is off 28.7% from the peak, and up 1.1% in May (SA).
The next graph shows the price declines from the peak for each city included in S&P/Case-Shiller indices.
 Prices increased (SA) in 15 of the 20 Case-Shiller cities in May seasonally adjusted.
Prices in Las Vegas are off 56.1% from the peak, and prices in Dallas only off 4.8% from the peak.
Note: Prices are probably starting to fall right now, but this will not show up in the Case-Shiller index for a few months.
The Census Bureau reported the homeownership and vacancy rates for Q2 2010 this week.
 The homeownership rate declined to 66.9%. This is the lowest level since 1999.
Note: graph starts at 60% to better show the change.
The homeownership rate increased in the '90s and early '00s because of changes in demographics and "innovations" in mortgage lending. The increase due to demographics (older population) will probably stick, so I've been expecting the rate to decline to the 66% to 67% range - and not all the way back to 64% to 65%.
For more on the homeownership rate, see: How far will the homeownership rate fall?
Here are graphs of the homeowner and rental vacancy rate.
Economic activity has continued to increase, on balance, since the previous survey, although the Cleveland and Kansas City Districts reported that the level of economic activity generally held steady.
Best wishes to all.
Sovereign Debt Part 5C. Some Policy Options, Good and Bad
by Calculated Risk on 8/01/2010 07:13:00 AM
CR Note: This series is from reader "some investor guy".
Financial institutions, governments, and central banks can be creative in a crisis. Policy options fall into three broad groups: options for deeply distressed or defaulted sovereigns; options for creditors; and regulatory policies. In this part, we discuss the first two. Regulatory options will come in a later part.
To some extent, we’ve seen something similar to the Really Bad sovereign default situation before in the 2008 crisis. There have also been several episodes of very bad sovereign default over the past 200 years.
In our Really Bad scenario, about half of the sovereign debt is in default, and more would be downgraded so that it isn’t useful as collateral in many circumstances. In 2008, central banks from many countries provided cash and guarantees to help with the crisis. What happens when many of those governments and central banks are themselves in trouble? That too has happened before, coincidentally often shortly after banking crises.
 Click on graph for larger image in new window.
Source: Banking Crises: An Equal Opportunity Menace, Reinhart and Rogoff.
The authors claim that
“Banking crises dramatically weaken fiscal positions in both groups, with government revenues invariably contracting, and fiscal expenditures often expanding sharply. Three years after a financial crisis central government debt increases, on average, by about 86 percent. Thus the fiscal burden of banking crisis extends far beyond the commonly cited cost of the bailouts.”Options for Distressed or Defaulted Sovereigns. What will sovereigns do? Some of the more common or reasonable options which are available to sovereigns who are in distress or at high risk of default include:
1. Dialing for Dollars (or Euros, Yen, or other currencies). Just like a college student who is out of money, many countries will call their friends, relatives, and business associates. They will be looking for gifts, subsidies, loans, guarantees, and cosigners. Sometimes, having a big letter of credit and some liquidity buys enough time to actually fix things.
Greece called the EU and the IMF for help. We will probably see more of that from other countries. Many people are surprised to find that usually most of the loan commitments made by the IMF are not drawn upon.
2. The most common option, for those in or near default is to negotiate with creditors. This could involve combinations of reducing principal, extending maturity, and reducing interest rates. For some sovereigns, there might be new debt in a different currency, like Drachma, or Lira instead of Euros. For an interesting and detailed overview of options for Greece, see How to Restructure Greek Debt, by Buchheit and Gulati.
3. Print money to pay debts. Not all countries can do this. Members of the euro can’t unilaterally print money. Greece can’t just print its own money. Japan can. A large number of countries can print their own money, but most of their debt is in dollars or euros. For example, many eastern European countries can print, but have debts in euros.
 If they print, they have to convert that money to another currency. Historically, inflation has not generally been a method of preventing defaults, but as often occurred at the same time or shortly afterward. (chart source: This Time is Different: A Panoramic View of Eight Centuries of Financial Crises, Reinhart & Rogoff).
 4. Print money, sell assets, or borrow from others to buy back your debts at a large discount. No need to default.
Usually governments try to calm bond market fears to keep their borrowing costs low. However, if many owners of your debt are very worried, are scrambling for cash, or are willing to part with bonds priced at 50 cents on the dollar, it is the author’s opinion that you should strongly consider taking the deal. Those are likely to be medium to long term bonds, and you could cut your debt service substantially for years, or even decades.
Ford did a version of this in 2009 and paid less than half of face value. Here is an overview. Fabulous idea in the right circumstances (even though one of the rating agencies completely missed the point and thought it was equivalent to selective default, they clued in later). The hard part of doing this is usually finding enough cash to buy back debt at a deep discount. Ford had plenty of cash, always a good thing to have in a crisis.
If you happen to be a government with some very marketable assets lying around (e.g., gold, oil, a pile of hard currency in a sovereign wealth fund) and you are not in default, this could work out quite well. Brazil is a country that has successfully done this, and gotten a rating upgrade.
Governments with no distress have also bought back bonds. In 2000, the US Treasury was running a surplus (remember that? Seems so long ago), and bought back billions in 30 year bonds.
5. Austerity. Austerity is often useful for countries in moderate distress, especially if they could balance their budget with debt restructuring. For countries who have already defaulted, austerity is commonly part of emerging from default. Austerity is not useful if lot of money is required quickly. That could easily happen when maturing debt needs to be rolled over, and no one wants to buy it.
It could also happen on interest rate or FX derivatives. In a crisis, swap payments and/or collateral could be rising quickly, and would be due on short time horizons. A few months at the most, and sometimes a few hours.
And there are some slightly edgier options. Some of these might be fully justified in certain circumstances. Others might just be ways of disguising default, seizure, or stupidity.
6. Default only on the foreign debt. It is common for a country to issue multiple types of debt, often with one class of debt mostly owned by residents, and another class mostly owned by foreigners.
Photo source.
7. Seize assets.
 Why would a debtor seize assets? Three common answers: because they can; because they feel they “have to”; or because they feel they have been wronged. One example is Argentina in 2001, which expropriated $3.1 billion of pension assets in exchange for Treasury notes in Dec 2001, and then defaulted anyway in Jan 2002. This chart shows a timeline of how things went wrong.
8. Claim fraud and try not to pay, especially for OTC derivatives. The possible rationales are endless. An example case from Italy is here. Prosecutor “Robledo alleges the London units of the four banks misled Milan on the economic advantage of a financing package that included the swaps and earned 101 million euros in hidden fees.
He also claims the banks violated U.K. securities rules by failing to inform Milan in writing that for the swap deal the city was a counterparty to the lenders rather than a customer. Banks abiding by the rules of the Financial Services Authority are required to shield customers from conflicts of interest and provide them with clear and fair information that isn’t misleading.” The prosecutor seized assets from the banks equal to their share of the alleged profit.
9. Claim that contracts were invalid in the first place. An example of this is Iceland, “Iceland’s lenders may lose as much as $4.3 billion, equivalent to a third of the economy, after a court last month found that some foreign loans were illegal”. There may also be sovereigns claiming that some official was not authorized to enter into particular loans or derivatives.
10. Claim the people who entered into certain contracts were trying to cause default or distress for the sovereign. Germany made this illegal earlier this year.
11. Depose, subpoena, or even arrest some of the counterparties. A number of countries have rather different legal traditions than the US, the EU, or Japan, and lots of their jails aren’t up to Western standards either. Your typical counterparty doesn’t have these kinds of powers. Once a regulator or prosecutor starts digging, they might find nothing. Or, they might find something extremely damaging. Even charges unrelated to cheating a sovereign could carry some serious jail time, like bid-rigging, money laundering, or tax evasion.
There are also some recent examples of central bankers or bank CEOs being arrested, which might affect whether the sovereigns would honor contracts they entered into (Kosovo Central Banker, Nigerian banks and customers, multibillion forged claims on UAE Central Bank on two separate occasions). Here, here and here.
12. Cut loose sovereign wealth funds, quasi national organizations, and other borrowers or CDS participants which are separate legal entities. Depending on “moral obligations” or “implied guarantees” is always risky. Investors in Fannie Mae and Freddie Mac bonds won their bets that the US government would step in. This will not necessarily be the case elsewhere.
13. And of course, do positive spin, even lie about financial condition. “If a government wants to cheat, it can cheat,” said Garry Schinasi, a veteran of the International Monetary Fund’s capital markets surveillance unit, which monitors vulnerability in global capital markets. Source.
Options for Creditors. For creditors, there are some interesting options. Common ones include:
1. Reduce trade credit, try to get trade sanctions. These are very common measures.
2. Press for higher taxes, business-friendly regulations, austerity. These are straight out of the traditional IMF playbook (now slightly modified).
3. Get your government to bail you out, perhaps by buying defaulted bonds above market price. Another possibility for partial recovery is getting changes to the tax code, such as allowing losses to be carried back, or offset against other forms of income.
4. Seize local assets. There is a long history of this, and sovereigns with extensive foreign assets could be at risk. Recently there was an unsuccessful suit by a creditor to seize assets of Argentina held in the US to compensate for defaulted Argentina bonds.
Somewhat rarer approaches include:
5. Convince your own government to sail gunboats into the harbor of the capital. Sell tickets to the news media. Venezuela in 1913 was a prominent example. Two discussions of how prevalent this method of collection once was or wasn’t are at here and here. This has been rare to nonexistent since World War I. However, looking at the earlier experience, it would be a bad idea to already have major military powers upset at you and default on your bonds. Killing or kidnapping foreign citizens was especially likely to get a response. Having large oil or mineral reserves might also make a country a target.
6. Turn the borrower into part of another country. Yes, there are sometimes sovereign consolidations due to finances. This happens more often at the municipal level, but in the early 1930s Newfoundland went from semi-independent status to being part of Canada. Much of the reason was Canada’s willingness to pay most of Newfoundland’s debt. More details here. While this might occur somewhere at the country level in the Really Bad scenario, it’s more likely to happen with municipalities, provinces, or states.
Disclosures: At a prior job Some Investor Guy had a number of automakers as clients. He owns some Ford bonds, some other corporate bonds, and some municipals. He owns no foreign sovereigns, because he is expecting prices to fall and yields to rise on many of them. He owns no gold, has very little in equities, some real estate, and a lot of cash. Make your own decisions on what your portfolio should be. This is disclosure, not investment advice. Some Investor Guy has no remote doomstead or bomb shelters, but thinks everyone should have a week’s worth of water and food. There are plenty of disasters where those could be useful. He does sometimes talk to regulators and lawmakers.
Next: Part 5D. What if Things Go Really Badly? Banks. This part was moved a bit later to allow more thorough analysis of the European Bank Stress Tests.
CR Note: This series is from "Some investor guy"
Series:
• Part 1: How Large is the Outstanding Value of Sovereign Bonds?
• Part 2. How Often Have Sovereign Countries Defaulted in the Past?
• Part 2B: More on Historic Sovereign Default Research
• Part 3. What are the Market Estimates of the Probabilities of Default?
• Part 4. What are Total Estimated Losses on Sovereign Bonds Due to Default?
• Part 5A. What Happens If Things Go Really Badly? $15 Trillion of Sovereign Debt in Default
• Part 5B. Part 5B. What Happens If Things Go Really Badly? More Things Can Go Badly: Credit Default Swaps, Interest Swaps and Options, Foreign Exchange
• Part 5C. Some Policy Options, Good and Bad
• Part 5D. European Banks, What if Things Go Really Badly?
Saturday, July 31, 2010
How do you put recession bars on graphs using Excel?
by Calculated Risk on 7/31/2010 10:18:00 PM
Something a little different for a Saturday evening. This is a common question, using excel, how do you get from this:
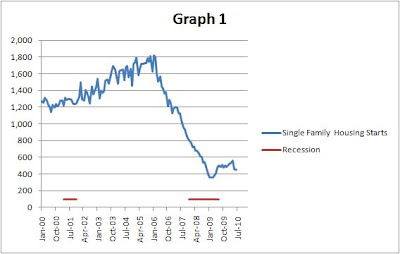
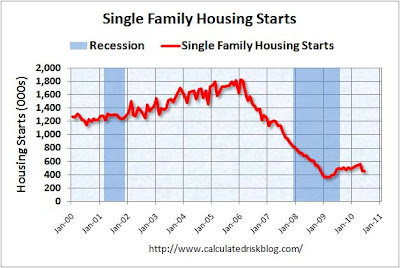
After the jump is a simple step-by-step example on one way to do it:
Growth of Problem Banks (Unofficial)
by Calculated Risk on 7/31/2010 05:19:00 PM
With the number of institutions on the unofficial problem bank list now over 800, here is a review of the growth of the unofficial list ...
We started posting the Unofficial Problem Bank list in early August 2009 (credit: surferdude808). The FDIC's official problem bank list is comprised of banks with a CAMELS rating of 4 or 5, and the list is not made public (just the number of banks and assets every quarter). Note: Bank CAMELS ratings are not made public.
CAMELS is the FDIC rating system, and stands for Capital adequacy, Asset quality, Management, Earnings, Liquidity and Sensitivity to market risk. The scale is from 1 to 5, with 1 being the strongest.
As a substitute for the CAMELS ratings, surferdude808 is using publicly announced formal enforcement actions, and also media reports and company announcements that suggest to us an enforcement action is likely, to compile a list of possible problem banks in the public interest. Some of this data is released with a lag, for example the FDIC announced the June enforcement actions yesterday. Click on graph for larger image in new window.
This graph shows the number of banks on the unofficial list. The number of institutions has more than doubled since early August 2009 - even with all the bank failures (failures are removed from the list). The number of assets is up 50 percent.
On August 7, 2009, we listed 389 institutions with $276 billion in assets, and now the list has 808 institutions and $415 billion in assets.
Note: For Q2 2009, the FDIC listed 416 institutions and $299.8 billion in assets (slightly more than the unofficial list a month later). The FDIC Q2 2010 Quarterly Banking Profile will be released in a few weeks.
The four red dots are the number of banks on the official problem bank list as announced in the FDIC quarterly banking profile for Q2 2009 through Q1 2010. The dots are lagged one month because of the delay in announcing formal actions.
The unofficial count is close, but is slightly lower than the official count - probably mostly due to timing issues.
Based on the current trend, there is still a reasonable chance that the unofficial problem bank list will be over 1,000 banks later this year ...
Negative Equity Breakdown
by Calculated Risk on 7/31/2010 11:40:00 AM
Here is some data from a recent congressional briefing by Mark Zandi, Chief Economist of Moody's Economy.com, and Yale Professor Robert Shiller. I believe all of this negative equity data was presented by Zandi.
A few key points, as of Q1 2010:
 Click on graph for larger image in new window.
This graph shows the percent of homeowners with negative equity (dashed line), percent of homeowners with mortgages with negative equity (blue), and the mortgage debt for homes with negative equity - all since Q1 2006.
The good news is the percent of homeowners with negative equity, and the mortgage debt for homes with negative equity, peaked in 2009.
The bad news is the declines have been relatively small even with all the distress sales, minor price increases, and some principal reduction modifications. As prices start to fall later this year (as I expect), the number of homeowners with negative equity will probably increase again (offset by foreclosures, short sales, and some modifications with principal reduction).
 The second graph shows the number of homeowners in negative equity, by the percent of negative equity.
There are 4.1 million homeowners with more than 50% negative equity, and another 5 million homeowners with 20% to 50% negative equity.
If prices fall 5%, the columns will essentially shift one to the left (ignoring remedies), and there will be 10.2 million homeowners with 20% or more negative equity.
 The third graph shows the percent of homeowners with mortgages in negative equity for 33 states and D.C.
This is shown in three categories: >50%, 20% to 50%, and 0 to 20%.
If you look at Nevada, 17.0% of homeowners (with mortgages) are more than 50% underwater, and another 35.2% are 20% to 50% underwater. These are the homeowners most at risk for foreclosure.
Note: the Q2 CoreLogic negative equity report will be released soon, but that report doesn't provide this level of detail.
Restaurant Index shows contraction in June
by Calculated Risk on 7/31/2010 08:56:00 AM
This is one of several industry specific indexes I track each month.  Click on graph for larger image in new window.
Same store sales and customer traffic both declined in June (on a year-over-year basis). This is the third consecutive month of declines.
Unfortunately the data for this index only goes back to 2002.
Note: Any reading above 100 shows expansion for this index.
From the National Restaurant Association (NRA): Industry Outlook Softened in June as the Restaurant Performance Index Declined for the Third Consecutive Month
As a result of a dampened outlook among restaurant operators, the National Restaurant Association's comprehensive index of restaurant activity declined for the third consecutive month in June. The Association's Restaurant Performance Index (RPI) - a monthly composite index that tracks the health of and outlook for the U.S. restaurant industry - stood at 99.5 in June, down 0.3 percent from May and the lowest index level since February.Restaurants are a discretionary expense, and this contraction could be because of the sluggish recovery or might suggest further weakness in consumer spending in the months ahead.
In addition, the RPI stood below 100 for the second consecutive month, which signifies contraction in the index of key industry indicators.
...
Restaurant operators reported a net decline in same-store sales for the third consecutive month in June, though the results were a modest improvement from the May performance.
...
Restaurant operators also reported a net decline in customer traffic levels in June.
...
Along with soft sales and traffic results, restaurant operators reported a dip in capital spending activity.
...
Restaurant operators are also not as optimistic about the direction of the overall economy. ... Restaurant operators’plans for capital expenditures fell to a six-month low this month.
emphasis added
Friday, July 30, 2010
Unofficial Problem Bank List over 800 Institutions
by Calculated Risk on 7/30/2010 11:59:00 PM
Note: this is an unofficial list of Problem Banks compiled only from public sources.
Here is the unofficial problem bank list for July 30, 2010.
Changes and comments from surferdude808:
FDIC actions this week led to many changes in the Unofficial Problem Bank List as they closed five institutions and finally released their enforcement actions for June 2010. The list total finally pushes through the much anticipated 800 level and finishes the week at 808 with aggregate assets of $414.8 billion.
Along with the five failures -- LibertyBank ($768 million), The Cowlitz Bank ($537 million Ticker: CWLZ), Coastal Community Bank ($378 million), Northwest Bank & Trust ($168 million), and Bayside Savings Bank ($66 million) -- there were four other removals because of action termination-- Domestic Bank ($234 million), Plaza Bank ($178 million Ticker: PLZB), Citizens State Bank ($114 million), and Libertad Bank SSB ($41 million); and three other removals because of unassisted mergers -- Pamrapo Savings Bank ($551 million), Sterling Bank ($369 million Ticker: STBK), and Colorado Mountain Bank ($82 million).
There are 28 additions this week with aggregate assets of nearly $9 billion. Most notable among the additions are Communityone Bank, National Association, Asheboro, NC ($2.0 billion Ticker: FNBN); The Palmetto Bank, Laurens, SC (1.3 billion Ticker: PLMT); Prosperity Bank, Saint Augustine, FL ($929 million); Jefferson Bank and Trust Company, Eureka, MO ($845 million); and Oxford Bank & Trust, Oak Brook, IL ($643 million). Geographically among the 28 additions are four based in Florida, three in Minnesota, and two in Illinois, Montana, and Wisconsin. The other change to report is a Prompt Corrective Action Order issued against Los Padres Bank ($902 million Ticker: HWFG) by the OTS.
Bank Failure #107 & 108: Washington and Oregon
by Calculated Risk on 7/30/2010 09:49:00 PM
Udderly Ridiculous!
Their milk shake was drank.
For whom the bell tolls?
Liberty pushed out to sea
Farewell to assets.
by Soylent Green is People
From the FDIC: Heritage Bank, Olympia, Washington, Assumes All of the Deposits of The Cowlitz Bank, Longview, Washington
As of March 31, 2010, The Cowlitz Bank had approximately $529.3 million in total assets and $513.9 million in total deposits. Heritage Bank paid the FDIC a premium of 1.0 percent for the deposits of The Cowlitz Bank. ...From the FDIC: Home Federal Bank, Nampa, Idaho, Assumes All of the Deposits of LibertyBank, Eugene, Oregon
The FDIC estimates that the cost to the Deposit Insurance Fund (DIF) will be $68.9 million. ... The Cowlitz Bank is the 107th FDIC-insured institution to fail in the nation this year, and the eighth in Washington. The last FDIC-insured institution closed in the state was Washington First International Bank, Seattle, on June 11, 2010.
As of March 31, 2010, LibertyBank had approximately $768.2 million in total assets and $718.5 million in total deposits. Home Federal Bank paid the FDIC a premium of 1.0 percent for the deposits of LibertyBank. ...That makes 5 today.
The FDIC estimates that the cost to the Deposit Insurance Fund (DIF) will be $115.3 million. .... LibertyBank is the 108th FDIC-insured institution to fail in the nation this year, and the third in Oregon. The last FDIC-insured institution closed in the state was Home Valley Bank, Cave Junction, on July 23, 2010.
Estimate of July Decennial Census impact on payroll employment: minus 144,000
by Calculated Risk on 7/30/2010 08:20:00 PM
The Census Bureau released the weekly payroll data for the week ending July 17th this week (ht Bob_in_MA). If we subtract the number of temporary 2010 Census workers in the week containing the 12th of the month, from the same week for the previous month - this provides a close estimate for the impact of the Census hiring on payroll employment.
The Census Bureau releases the actual number with the employment report.  Click on graph for larger image in new window.
This graph shows the number of Census workers paid each week. The red labels are the weeks of the BLS payroll survey.
The Census payroll decreased from 344,157 for the week ending June 12th to 200,346 for the week ending July 17th.
So my estimate for the impact of the Census on July payroll employment is minus 144 thousand (this will probably be close). The employment report will be released on August 6th, and the headline number for July - including Census numbers - will probably be negative again. But a key number will be the hiring ex-Census (so we will add back the Census workers again this month).
The following table compares the weekly payroll report estimate to the monthly BLS report on Census hiring (the weekly report is revised slightly, so the correlation looks better than in real time):
| Weekly Pay Period | Change (based on weekly report) | Monthly BLS | Change (monthly) | |
|---|---|---|---|---|
| Jan | 25 | 24 | ||
| Feb | 41 | 16 | 39 | 15 |
| Mar | 96 | 55 | 87 | 48 |
| Apr | 156 | 61 | 154 | 67 |
| May | 574 | 418 | 564 | 410 |
| Jun | 344 | -230 | 339 | -225 |
| Jul | 200 | -144 | ||
| All thousands | ||||
There will be one more large decline in temporary Census workers in August, and then most of the remaining workers will be let go over the next several months. I'll have more on July employment this Sunday in the weekly "Look ahead".
Bank Failures #105 & 106: Florida
by Calculated Risk on 7/30/2010 06:10:00 PM
Ghostly towers of failure
Like area banks
by Soylent Green is People
From the FDIC: Centennial Bank, Conway, Arkansas, Acquires All of the Deposits of Two Institutions in Florida
As of March 31, 2010, Bayside Savings Bank had total assets of $66.1 million and total deposits of $52.4 million. Coastal Community Bank had total assets of $372.9 million and total deposits of $363.2 million.Three down today.
...
The FDIC estimates that the cost to the Deposit Insurance Fund (DIF) will be $16.2 million for Bayside Savings Bank and $94.5 million for Coastal Community Bank. ... These two closings bring total closures for the year to 106 banks in the nation, and the 19th and 20th in Florida. Prior to these failures, the last bank closed in Florida was Sterling Bank, Lantana, on July 23, 2010.
Note: The FDIC released the June enforcement actions today, and the unofficial list will be over 800 tonight.
Bank Failure #104: NorthWest Bank and Trust, Acworth, Georgia
by Calculated Risk on 7/30/2010 05:30:00 PM
Bankers pray for sweet relief.
Survival in doubt
by Soylent Green is People
From the FDIC: State Bank and Trust Company, Macon, Georgia, Assumes All of the Deposits of NorthWest Bank and Trust, Acworth, Georgia
As of March 31, 2010, NorthWest Bank and Trust had approximately $167.7 million in total assets and $159.4 million in total deposits. ...It is Friday!
The FDIC estimates that the cost to the Deposit Insurance Fund (DIF) will be $39.8 million. ... NorthWest Bank and Trust is the 104th FDIC-insured institution to fail in the nation this year, and the 11th in Georgia. The last FDIC-insured institution closed in the state was Crescent Bank and Trust Company, Jasper, on July 23, 2010.
Existing Homes: Double Digit Months-of-Supply Watch
by Calculated Risk on 7/30/2010 03:44:00 PM
How the NAR calculates existing home inventory is a bit of a mystery. However housing economist Tom Lawler has been tracking inventory several different ways. For July, Lawler reports listings totaled 4,038,133, up about 1.6% from June (using Realtor.com). And this brings us to the double digit months-of-supply watch ...
For June, the NAR reported sales were at a 5.37 million seasonally adjusted annual rate (SAAR), and inventory was at 3.992 million.
To calculated the months of supply, divide 3.992 by 5.37 and multiply by 12 months.
This gives 8.92 months-of-supply (note: there is a seasonal pattern for inventory, but the NAR uses the NSA data). Click on graph for larger image in new window.
This graph shows the 'months-of-supply' metric.
The NAR reported that the months-of-supply increased to 8.9 months in June.
Since we know sales collapsed in July (based on pending home sales and other reports), and using Lawler's estimate for the level of inventory, we can calculate how far sales would have had to fall in July to hit double digits months-of-supply:
| For: Months of Supply | Then: July Sales (millions, SAAR) |
|---|---|
| 10 | 4.85 |
| 11 | 4.40 |
| 12 | 4.04 |
For 12 months of supply, the sales rate (SAAR) would equal inventory.
My initial guess is we will see double digit months-of-supply in July, and for a number of the months thereafter. We might even break the cycle high of 11.2 months set in 2008. If months-of-supply increases sharply as I expect, then there will be additional downward pressure on house prices.
Error Correction: Confused Annual and Quarterly Rates in previous post
by Calculated Risk on 7/30/2010 02:04:00 PM
In the previous post I confused annual rates and quarterly rates. Sorry.
Real PCE is 0.85% below the pre-recession peak, so PCE would have to grow at 3.4% in Q3 for the economy to be back to the pre-recession level.
Real GDP is 1.1% below the pre-recession peak, so GDP would have to grow at 4.3% in Q3 to be back to the pre-recession level.
With a 2nd half slowdown, I don't expect to reach those levels until the end of the year or in 2011.
Note: the graphs and quarterly data are all correct - just the annual comment that I added was in error (ht Tehan)
Revisions: Real GDP and PCE well below previous peak
by Calculated Risk on 7/30/2010 11:32:00 AM
Error Correction: Sorry - I confused annual rates and quarterly rates.
Real GDP is 1.1% below the pre-recession peak, so if GDP would have to grow at 4.4% in Q3 the economy to be back to the pre-recession level.
Real PCE is 0.85% below the pre-recession peak, so PCE would have to grow at 3.4% in Q3 to be back to the pre-recession level.
________________________________________________________
These two graphs show the revisions for real GDP and PCE. Click on graph for larger image in new window.
The recession was clearly worse than originally estimated (we suspected this already using Gross Domestic Income).
In fact real GDP in Q2 2010 was lower than originally reported for Q1 2010. And annualized real GDP is still 1.1% below the pre-recession peak. This means that real GDP would have to grow at a 4.3% rate over the next quarter to reach the recession peak.
This shows that St Louis Fed President Bullard was too optimistic in a speech last month. From Bullard in June: The Global Recovery and Monetary Policy
"As of the first quarter of 2010, real GDP stands just shy of the 2008 second quarter level, so that growth of about 1.25 percent would be sufficient to allow real GDP to surpass the previous peak. At that point, the U.S. economy would be fully "recovered" from the very sharp downturn of late 2008 and early 2009. To be clear, the 1.25 percent is a quarterly number, and would be 5.0 percent at an annual rate. Although I think that 5.0 percent at an annual rate is too much to expect for current quarter real GDP growth, it seems like a reasonable possibility over the next two quarters combined. Given these conditions, I expect the U.S. recovery in GDP to be complete in the third quarter of this year."I disagreed with him, and pointed out that GDI suggested downward revisions.
Real PCE was revised down even more.Annualized real PCE is now 0.85% below the pre-recession peak, and would have to grow 3.4% over the next quarter to reach the previous peak.
Cleveland Fed President Sandra Pianalto had it right in February: When the Small Stuff Is Anything But Small
[I]t may take years just to get back to the level of output we enjoyed in 2007, just before the economic crisis began.If things go well, the economy will be back to pre-recession levels later this year or in 2011. No wonder there is so little investment. And no wonder there is so little hiring!
Chicago PMI shows expansion in July
by Calculated Risk on 7/30/2010 09:45:00 AM
From the Institute for Supply Management – Chicago:
The Chicago Purchasing Managers reported the CHICAGO BUSINESS BAROMETER rebounded, marking a tenth month of growth.The overall index increased to 62.3 from 59.1. Note: any number above 50 shows expansion.
Employment improved to 56.6 from 54.2 in June.
The new orders index increased to 64.6 from 59.1.
Overall this was a positive report. The national ISM manufacturing index will be released on Monday.


