 RSS Feed
 by Calculated Risk on 7/14/2010 08:55:00 PM
Wednesday, July 14, 2010
Part 4. What are Total Estimated Losses on Sovereign Bonds Due to Default?
CR Note: This series is from reader "some investor guy".
In Part 3, we showed that credit default swaps imply that 7.4% of sovereign debt will default over the next 5 years. However, the defaulted bonds probably would not lose all of their value.
In some cases, losses given default are quite small, a few percent. In some restructurings, only the durations are changed, and a technical default might not result in an actual loss. At the opposite end of the spectrum, losses on a particular bond could be 100%, especially if a sovereign had junior or subordinate debt.
To estimate losses, in addition to the Probability of Default, we need to estimate Recovery Rates Given Default.
Moody’s has studied sovereign default recoveries in the past several decades (Source: Sovereign Default and Recovery Rates, 1983-2008). Recovery rates have ranged from 18% (Russia, 1998) to 95% (Dominican Republic, 2005), when measured on all debt from a particular sovereign at the time of default. The average recovery rate was 50% when each country was weighted equally, but only 31% when weighted by the face value of all outstanding bonds from all defaulting issuers.
Applying those recovery rates leads to expected losses of $1.3 to 1.8 trillion, or about 3.7 - 5.1% of outstanding sovereign debt at 12/31/09, and about $100 billion more at 6/30/10. We now have our baseline estimate of worldwide sovereign default losses.
This might not sound too bad, unless you happen to live in one of the defaulted countries, or own a lot of that country’s bonds.
Even at the baseline $1.3 to $1.8 trillion, those losses would be about the size of all outstanding debt of China, Germany, or France. And, default losses aren’t the only losses which could be occurring in your bond portfolio. For example, if Greek bonds default, Irish interest rates might go up substantially, and Ireland might merely be in pain rather than in default. In that case, if you purchased Irish bonds before the crisis, their market value might drop substantially below what you paid. Hopefully you didn’t buy them using leverage. If the bonds aren’t denominated in your native currency, you could be experiencing large FX losses.
Ubernerd warning. This part of the post contains pictures, but is also pretty technical.
Some posters have asked, “why not use the CDS prices themselves, which contain information on both the default probabilities and expected recoveries?” Well, if the two are separated, you are able to do certain things in modeling that are impossible to calculate with them jumbled together. It is easier to compare to historic data which often tracks the occurrence of default, but not the recovery. It allows you to do frequency-severity simulations.
For you ubernerds, it also means that you can model and correlate frequency and severity separately. Would you change your estimate of severity of loss on Greek bonds if you thought Spain and Italy would also default? Do you think that the probability of default goes up each time debt needs to be rolled over, but the recoveries given default won’t move much? Then the common assumption of 40% recovery rate doesn’t work with your model.
 Click on graph for larger image in new window.
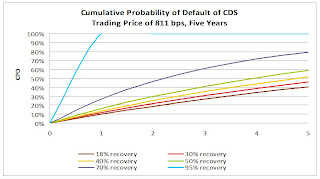
Here is a chart derived from a large bank’s presentation on sovereign CDS modeling which shows just how different your cumulative probability of default could be for a sovereign like Greece which closed at 811 basis points yesterday (July 13, 2010). The differences get pretty big, pretty fast. I’ve used the same historic range of 18% to 95% recovery rates to illustrate this. It’s pretty obvious that the CDS market doesn’t expect 95% recoveries from Greece. However, there are many combinations of probability of default and recovery rate which are consistent with current pricing.
For those of you who followed the subprime crisis closely, some common CDS modeling assumptions may sound familiar. My favorite misnomer is “discount cashflows at the risk-free rate”. There IS no truly riskfree rate. (CR note: by "riskfree", usually people mean essentially default risk free like U.S. treasuries. "Some investor guy" is pointing out there is still interest rate risk). There might be interest rates on a security incredibly unlikely to default. However, interest rates on that security will still move around, introducing plenty of risk which has nothing to do with default. Do you think that commonly used “riskfree” rates like 30 day LIBOR or 90 day US Treasuries might fluctuate and diverge in a crisis? Like they did in 2008 and 2009?
 There appears to be another market behavior which you might not expect unless you had seen it before: very strong correlations of securities which don’t appear to have the same underlying risks. Take a look at these charts on CDS prices for example. These may be artifacts of how people are funding, leveraging, or hedging their positions.
 The short term correlations are so strong that only events like Hungary’s “whoops, we didn’t really mean that” event stand out.
Source: CMA Sovereign Risk Report for Q2 2010
The strong correlations aren’t just in prices, those correlations also occur in trading volume. (see chart 4 below) It would not be surprising to find correlation desks at major traders generating lots of this volume. Who is trading, why, and how, are important in guessing what might happen if things go really badly.
Source: CMA CDS Liquidity Study
 Next in the series
The baseline losses from today’s article are certainly not the maximum possible number. For example, what would happen if Japan defaulted? That’s in Part 5, What if Things Go Really Badly?
In Part 6, we will talk about some of the indirect effects, which can cause distress through other mechanisms besides the original default(s).
CR Note: This is from "Some investor guy". Over the next week , some investor guy will address several questions: What are total estimated losses on sovereign bonds due to default? What happens if things go really badly and what are the indirect effects of default?
Coming this weekend: Part 5, What if Things Go Really Badly?
Series:
• Part 1: How Large is the Outstanding Value of Sovereign Bonds?
• Part 2. How Often Have Sovereign Countries Defaulted in the Past?
• Part 2B: More on Historic Sovereign Default Research
• Part 3. What are the Market Estimates of the Probabilities of Default?
• Part 4. What are Total Estimated Losses on Sovereign Bonds Due to Default?
• Part 5A. What Happens If Things Go Really Badly? $15 Trillion of Sovereign Debt in Default
• Part 5B. Part 5B. What Happens If Things Go Really Badly? More Things Can Go Badly: Credit Default Swaps, Interest Swaps and Options, Foreign Exchange
• Part 5C. Some Policy Options, Good and Bad
• Part 5D. European Banks, What if Things Go Really Badly?


