 RSS Feed
 by Calculated Risk on 1/02/2019 12:51:00 PM
Wednesday, January 02, 2019
Question #3 for 2019: Will job creation in 2019 be as strong as in 2018?
Earlier I posted some questions for this year: Ten Economic Questions for 2019. I'm adding some thoughts, and maybe some predictions for each question.
3) Employment: Through November 2018, the economy has added 2,268,000 thousand jobs, or 206 thousand per month. This was the best year since 2015. Job creation was up from 182 thousand per month in 2017, and up from 195 thousand per month in 2016. Will job creation in 2019 be as strong as in 2018? Will job creation pick up further? Or will job creation slow in 2019?
For review, here is a table of the annual change in total nonfarm, private and public sector payrolls jobs since 1997. For total and private employment gains, 2014 and 2015 were the best years since the '90s, and it appears job growth peaked for this cycle in 2014.
| Change in Payroll Jobs per Year (000s) | |||
|---|---|---|---|
| Total, Nonfarm | Private | Public | |
| 1997 | 3,411 | 3,216 | 195 |
| 1998 | 3,049 | 2,736 | 313 |
| 1999 | 3,181 | 2,720 | 461 |
| 2000 | 1,938 | 1,674 | 264 |
| 2001 | -1,726 | -2,277 | 551 |
| 2002 | -511 | -744 | 233 |
| 2003 | 120 | 162 | -42 |
| 2004 | 2,041 | 1,894 | 147 |
| 2005 | 2,517 | 2,331 | 186 |
| 2006 | 2,095 | 1,886 | 209 |
| 2007 | 1,148 | 860 | 288 |
| 2008 | -3,569 | -3,749 | 180 |
| 2009 | -5,061 | -4,987 | -74 |
| 2010 | 1,053 | 1,269 | -216 |
| 2011 | 2,090 | 2,402 | -312 |
| 2012 | 2,151 | 2,218 | -67 |
| 2013 | 2,301 | 2,368 | -67 |
| 2014 | 3,005 | 2,876 | 129 |
| 2015 | 2,712 | 2,561 | 151 |
| 2016 | 2,344 | 2,138 | 206 |
| 2017 | 2,188 | 2,163 | 25 |
| 20181 | 2,443 | 2,395 | 48 |
| 12018 is Year-over-year job gains through November | |||
The good news is job market still has solid momentum heading into 2019.
The bad news - for job growth - is that a combination of a slowing economy, demographics and a labor market nearing full employment suggests fewer jobs will be added in 2019.
In 2018, employment was boosted by some fiscal stimulus, higher energy prices (helped in some areas), and supply was boosted by Puerto Ricans moving to the mainland following hurricane Maria.
In 2019, the fiscal stimulus will fade, lower energy prices will hurt some areas, and the supply boost from Puerto Rico is probably over.
Note: Too many people compare to the '80s and '90s, without thinking about changing demographics. The prime working age population (25 to 54 years old) was growing 2.2% per year in the '80s, and 1.3% per year in the '90s. The prime working age population has actually declined slightly this decade. Note: The prime working age population is now growing slowly again, and growth will pick up the 2020s.
The second table shows the change in construction and manufacturing payrolls starting in 2006.
| Construction Jobs (000s) | Manufacturing (000s) | |
|---|---|---|
| 2006 | 152 | -178 |
| 2007 | -195 | -269 |
| 2008 | -789 | -896 |
| 2009 | -1047 | -1375 |
| 2010 | -187 | 120 |
| 2011 | 144 | 207 |
| 2012 | 113 | 158 |
| 2013 | 208 | 123 |
| 2014 | 363 | 208 |
| 2015 | 337 | 69 |
| 2016 | 190 | -9 |
| 2017 | 250 | 207 |
| 20181 | 282 | 288 |
| 12018 is Year-over-year job gains through November | ||
Energy related construction and manufacturing hiring was solid in 2017 and 2018 as oil prices increased. However, in 2019, energy related employment will probably decline since oil price have fallen sharply recently. Also, for manufacturing, there will probably be little or no growth in the auto sector in 2019.
So my forecast is for gains of around 133,000 to 167,000 payroll jobs per month in 2019 (about 1.6 million to 2.0 million year-over-year) . This would be the fewest job gains since 2010, but another solid year for employment gains given current demographics.
Here are the Ten Economic Questions for 2019 and a few predictions:
• Question #1 for 2019: Will Mr. Trump negatively impact the economy in 2019?
• Question #2 for 2019: How much will the economy grow in 2019?
• Question #3 for 2019: Will job creation in 2019 be as strong as in 2018?
• Question #3 for 2019: Will job creation in 2019 be as strong as in 2018?
• Question #4 for 2019: What will the unemployment rate be in December 2019?
• Question #5 for 2019: Will the core inflation rate rise in 2019? Will too much inflation be a concern in 2019?
• Question #6 for 2019: Will the Fed raise rates in 2019, and if so, by how much?
• Question #7 for 2019: How much will wages increase in 2019?
• Question #8 for 2019: How much will Residential Investment increase?
• Question #9 for 2019: What will happen with house prices in 2019?
• Question #10 for 2019: Will housing inventory increase or decrease in 2019?
Question #4 for 2019: What will the unemployment rate be in December 2019?
by Calculated Risk on 1/02/2019 10:34:00 AM
Earlier I posted some questions for this year: Ten Economic Questions for 2019. I'm adding some thoughts, and maybe some predictions for each question.
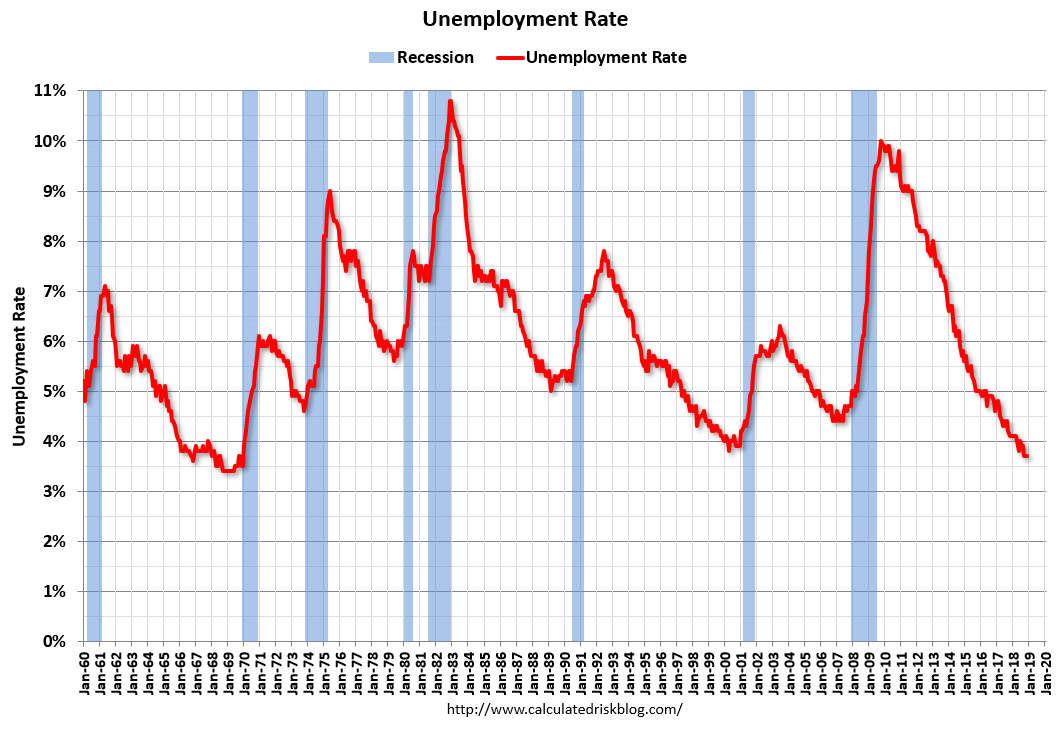
4) Unemployment Rate: The unemployment rate was at 3.7% in November, down 0.4 percentage points year-over-year. Currently the FOMC is forecasting the unemployment rate will be in the 3.5% to 3.7% range in Q4 2019. What will the unemployment rate be in December 2019?
This first graph shows the unemployment rate since 1960.
The unemployment rate has declined steadily after peaking at 10% following the great recession.
 Click on graph for larger image.
The current unemployment rate (3.7%) is below the low (3.8%) at the end of the '90s expansion, and at the lowest rate since 1969.
As I've mentioned before, current demographics share some similarities to the '60s, and the unemployment rate bottomed at 3.4% in the '60s - and we might see the unemployment rate that low again this cycle. If we look further back in time, the unemployment rate was as low as 2.5% in the 1950s.
Forecasting the unemployment rate includes forecasts for economic and payroll growth, and also for changes in the participation rate.
On participation: We can be pretty certain that the participation rate will decline over the next decade or longer based on demographic trends. However, over the last several years, the participation rate has been fairly steady as the strong labor market offset the long term trend.
 Here is a graph of the overall participation rate since 1960. Note: The participation rate is the percent of the working age population (16 and over) that is in the labor force.
The participation increased significantly starting in the late 60s as the Boomer generation entered the workforce and women participated at a much higher rate.
Since 2000, the participation rate has generally declined, mostly due to demographics.
Here is a table of the participation rate and unemployment rate since 2008.
| Unemployment and Participation Rate for December each Year | |||
|---|---|---|---|
| December of | Participation Rate | Change in Participation Rate (percentage points) | Unemployment Rate |
| 2008 | 65.8% | 7.3% | |
| 2009 | 64.6% | -1.2 | 9.9% |
| 2010 | 64.3% | -0.3 | 9.3% |
| 2011 | 64.0% | -0.3 | 8.5% |
| 2012 | 63.7% | -0.3 | 7.9% |
| 2013 | 62.9% | -0.8 | 6.7% |
| 2014 | 62.7% | -0.2 | 5.6% |
| 2015 | 62.7% | 0.0 | 5.0% |
| 2016 | 62.7% | 0.0 | 4.7% |
| 2017 | 62.7% | 0.0 | 4.1% |
| 20181 | 62.9% | 0.2 | 3.7% |
| 12018 is for November 2018. | |||
Depending on the estimate for the participation rate and job growth (next question), it appears the unemployment rate will decline into the mid 3's by December 2019 from the current 3.7%. My guess is based on the participation rate being mostly unchanged in 2019, and for decent job growth in 2019, but less than in 2018 or 2017.
Here are the Ten Economic Questions for 2019 and a few predictions:
• Question #1 for 2019: Will Mr. Trump negatively impact the economy in 2019?
• Question #2 for 2019: How much will the economy grow in 2019?
• Question #3 for 2019: Will job creation in 2019 be as strong as in 2018?
• Question #3 for 2019: Will job creation in 2019 be as strong as in 2018?
• Question #4 for 2019: What will the unemployment rate be in December 2019?
• Question #5 for 2019: Will the core inflation rate rise in 2019? Will too much inflation be a concern in 2019?
• Question #6 for 2019: Will the Fed raise rates in 2019, and if so, by how much?
• Question #7 for 2019: How much will wages increase in 2019?
• Question #8 for 2019: How much will Residential Investment increase?
• Question #9 for 2019: What will happen with house prices in 2019?
• Question #10 for 2019: Will housing inventory increase or decrease in 2019?
U.S. Light Vehicle Sales increase to 17.5 million annual rate in December
by Calculated Risk on 1/02/2019 08:43:00 AM
Based on a preliminary estimate from AutoData, light vehicle sales were at a 17.47 million SAAR in December.
That is up 5% year-over-year from June 2017, and up 4% from last month.

Click on graph for larger image.
This graph shows the historical light vehicle sales from the BEA (blue) and an estimate for June (red, light vehicle sales of 17.47 million SAAR from AutoData).
This was above the consensus forecast for June.
Note that the increase in sales at the end of 2017 was due to buying following the hurricanes.
Sales will probably move sideways or decline in 2018 after setting new sales records in both 2015 and 2016.
 The second graph shows light vehicle sales since the BEA started keeping data in 1967.
Note: dashed line is current estimated sales rate.
CoreLogic: House Prices up 5.1% Year-over-year in November
by Calculated Risk on 1/02/2019 08:42:00 AM
Notes: This CoreLogic House Price Index report is for November. The recent Case-Shiller index release was for October. The CoreLogic HPI is a three month weighted average and is not seasonally adjusted (NSA).
From CoreLogic: CoreLogic Reports November Home Prices Increased by 5.1 Percent Year Over Year
CoreLogic® ... today released the CoreLogic Home Price Index (HPI™) and HPI Forecast™ for November 2018, which shows home prices rose both year over year and month over month. Home prices increased nationally by 5.1 percent year over year from November 2017. On a month-over-month basis, prices increased by 0.4 percent in November 2018. (October 2018 data was revised. Revisions with public records data are standard, and to ensure accuracy, CoreLogic incorporates the newly released public data to provide updated results each month.)CR Note: The CoreLogic YoY increase has been in the 5% to 7% range for the last few years. This is near the bottom of that range - and slowing. The year-over-year comparison has been positive for almost seven consecutive years since turning positive year-over-year in February 2012.
Looking ahead, the CoreLogic HPI Forecast indicates home prices will increase by 4.8 percent on a year-over-year basis from November 2018 to November 2019. On a month-over-month basis, home prices are expected to decrease by 0.8 percent from November to December 2018. The CoreLogic HPI Forecast is a projection of home prices calculated using the CoreLogic HPI and other economic variables. Values are derived from state-level forecasts by weighting indices according to the number of owner-occupied households for each state.
“The rise in mortgage rates has dampened buyer demand and slowed home-price growth,” said Dr. Frank Nothaft, chief economist for CoreLogic. “Interest rates for new 30-year fixed-rate loans averaged 4.9 percent during November, the highest monthly average since February 2011. These higher rates and home prices have reduced buyer affordability. Home sellers are responding by lowering their asking price, which is reflected in the slowing growth of the CoreLogic Home Price Index.”
emphasis added
Tuesday, January 01, 2019
Question #5 for 2019: Will the core inflation rate rise in 2019? Will too much inflation be a concern in 2019?
by Calculated Risk on 1/01/2019 05:33:00 PM
Earlier I posted some questions for this year: Ten Economic Questions for 2019. I'm adding some thoughts, and maybe some predictions for each question.
5) Inflation: The inflation rate has increased and some key measures are now close to the the Fed's 2% target. Will core inflation rate rise in 2019? Will too much inflation be a concern in 2019?
Although there are different measure for inflation (including some private measures) they mostly show inflation slightly above the Fed's 2% inflation target. Core PCE was below the target at 1.8% YoY in October.
Note: I follow several measures of inflation, median CPI and trimmed-mean CPI from the Cleveland Fed. Core PCE prices (monthly from the BEA) and core CPI (from the BLS).
 Click on graph for larger image.
This graph shows the year-over-year change for these four key measures of inflation. On a year-over-year basis, the median CPI rose 2.8%, the trimmed-mean CPI rose 2.2%, and the CPI less food and energy rose 2.2%. Core PCE is for October and increased 1.8% year-over-year.
On a monthly basis, median CPI was at 4.1% annualized, trimmed-mean CPI was at 2.3% annualized, and core CPI was at 2.5% annualized.
The Fed is projecting core PCE inflation will increase to 2.0% to 2.1% by Q4 2019. There are risks for higher inflation with the labor market near full employment, however I do think there are structural reasons for low inflation (demographics, few employment agreements that lead to wage-price-spiral, etc).
So, although I think core PCE inflation (year-over-year) will increase in 2019 and be around 2% by Q4 2019 (up from 1.9%), I think too much inflation will still not be a serious concern in 2019.
Here are the Ten Economic Questions for 2019 and a few predictions:
• Question #1 for 2019: Will Mr. Trump negatively impact the economy in 2019?
• Question #2 for 2019: How much will the economy grow in 2019?
• Question #3 for 2019: Will job creation in 2019 be as strong as in 2018?
• Question #3 for 2019: Will job creation in 2019 be as strong as in 2018?
• Question #4 for 2019: What will the unemployment rate be in December 2019?
• Question #5 for 2019: Will the core inflation rate rise in 2019? Will too much inflation be a concern in 2019?
• Question #6 for 2019: Will the Fed raise rates in 2019, and if so, by how much?
• Question #7 for 2019: How much will wages increase in 2019?
• Question #8 for 2019: How much will Residential Investment increase?
• Question #9 for 2019: What will happen with house prices in 2019?
• Question #10 for 2019: Will housing inventory increase or decrease in 2019?
Question #6 for 2019: Will the Fed raise rates in 2019, and if so, by how much?
by Calculated Risk on 1/01/2019 11:15:00 AM
Earlier I posted some questions for this year: Ten Economic Questions for 2019. I'm adding some thoughts, and maybe some predictions for each question.
6) Monetary Policy: The Fed raised rates four times in 2018. Currently the Fed is forecasting two more rate hikes in 2019. Some analysts are forecasting three rate hikes. Will the Fed raise rates in 2019, and if so, by how much?
The Fed raised rates once in 2015, once again in 2016, three times in 2017, and four times in 2018. Currently the target range for the federal funds rate is 2-1/4 to 2‑1/2 percent.
There is a wide range of views on the FOMC. As of December, looking at the "dot plot", the FOMC participants see the following number of rate hikes in 2019:
| 25bp Rate Hikes in 2019 | FOMC Members |
|---|---|
| One Rate Cut | 0 |
| No Hikes | 2 |
| One | 4 |
| Two | 5 |
| Three | 6 |
| Four | 0 |
The main view of the FOMC is about two rate hikes in 2018.
Goldman Sachs economists wrote last week:
“We have made a further downgrade to our funds rate call. We now see a probability-weighted 1.2 hikes in all of 2019, from 1.6 hikes previously."The economy slowed in the 2nd half of 2018, and it seems likely the FOMC will "pause" in Q1 (and maybe for the first half of 2019). However, as the economy approaches full employment, the FOMC will be watching for any pickup in inflation, and that could lead to more rate hikes.
I think one or two rate hikes in 2019 seem likely, and my current guess is just one hike in the 2nd half of the year.
As an aside, many new Fed Chairs have faced a crisis early in their term. A few examples, Paul Volcker took office in August 1979, and inflation hit almost 12% (up from 7.9% the year before), and the economy went into recession as Volcker raised rates. Alan Greenspan took office in August 1987, and the stock market crashed almost 34% within a couple months of Greenspan taking office (including over 20% in one day!). And Ben Bernanke took office in February 2006, just as house prices peaked - and he was challenged by the housing bust, great recession and financial crisis.
Hopefully Jerome Powell will see smoother sailing.
Here are the Ten Economic Questions for 2019 and a few predictions:
• Question #1 for 2019: Will Mr. Trump negatively impact the economy in 2019?
• Question #2 for 2019: How much will the economy grow in 2019?
• Question #3 for 2019: Will job creation in 2019 be as strong as in 2018?
• Question #3 for 2019: Will job creation in 2019 be as strong as in 2018?
• Question #4 for 2019: What will the unemployment rate be in December 2019?
• Question #5 for 2019: Will the core inflation rate rise in 2019? Will too much inflation be a concern in 2019?
• Question #6 for 2019: Will the Fed raise rates in 2019, and if so, by how much?
• Question #7 for 2019: How much will wages increase in 2019?
• Question #8 for 2019: How much will Residential Investment increase?
• Question #9 for 2019: What will happen with house prices in 2019?
• Question #10 for 2019: Will housing inventory increase or decrease in 2019?
Monday, December 31, 2018
Question #7 for 2019: How much will wages increase in 2019?
by Calculated Risk on 12/31/2018 03:58:00 PM
Earlier I posted some questions for next year: Ten Economic Questions for 2019. I'm adding some thoughts, and maybe some predictions for each question.
7) Real Wage Growth: Wage growth picked up in 2018 (up 3.1% year-over-year as of November). How much will wages increase in 2019?
The most followed wage indicator is the “Average Hourly Earnings” from the Current Employment Statistics (CES) (aka "Establishment") monthly employment report.
 Click on graph for larger image.
The blue line shows the nominal year-over-year change in "Average Hourly Earnings" for all private employees. Nominal wage growth had been running close to 2% since 2010, and picked up a little in 2015, and more in 2016.
The red line is real wage growth (adjusted using headline CPI). Real wages increased during the crisis because CPI declined sharply. CPI was very low in 2015 - due to the decline in oil prices - so real wage growth picked up in 2015.
Real wage growth trended down in 2017, and picked up a little in 2018.
There are two quarterly sources for earnings data: 1) “Hourly Compensation,” from the BLS’s Productivity and Costs; and 2) the Employment Cost Index which includes wage/salary and benefit compensation. All three data series are different, and most of the focus recently has been the CES series (used in the graph above).
![]() The second graph is from the Atlanta Fed Wage Tracker. This measure is the year-over-year change in nominal wages for individuals.
The second graph is from the Atlanta Fed Wage Tracker. This measure is the year-over-year change in nominal wages for individuals.
By following wage changes for individuals, this removes the demographic composition effects (older workers who are retiring tend to be higher paid, and younger workers just entering the workforce tend to be lower paid).
The Atlanta Fed Wage tracker showed nominal wage growth close to 4% in late 2016, but dipped in 2017. At the end of 2018, wage growth was back up to close to 4%.
As the labor market continues to tighten, we should see more wage pressure as companies have to compete for employees. I expect to see some further increases in both the Average hourly earning from the CES, and in the Atlanta Fed Wage Tracker. Perhaps nominal wages will increase close to 3.5% in 2019 according to the CES.
Here are the Ten Economic Questions for 2019 and a few predictions:
• Question #1 for 2019: Will Mr. Trump negatively impact the economy in 2019?
• Question #2 for 2019: How much will the economy grow in 2019?
• Question #3 for 2019: Will job creation in 2019 be as strong as in 2018?
• Question #3 for 2019: Will job creation in 2019 be as strong as in 2018?
• Question #4 for 2019: What will the unemployment rate be in December 2019?
• Question #5 for 2019: Will the core inflation rate rise in 2019? Will too much inflation be a concern in 2019?
• Question #6 for 2019: Will the Fed raise rates in 2019, and if so, by how much?
• Question #7 for 2019: How much will wages increase in 2019?
• Question #8 for 2019: How much will Residential Investment increase?
• Question #9 for 2019: What will happen with house prices in 2019?
• Question #10 for 2019: Will housing inventory increase or decrease in 2019?
Question #8 for 2019: How much will Residential Investment increase?
by Calculated Risk on 12/31/2018 01:13:00 PM
Earlier I posted some questions for next year: Ten Economic Questions for 2019. I'm adding some thoughts, and maybe some predictions for each question.
8) Residential Investment: Residential investment (RI) was sluggish in 2018, and new home sales were mostly unchanged from 2017. Note: RI is mostly investment in new single family structures, multifamily structures, home improvement and commissions on existing home sales. How much will RI increase in 2019? How about housing starts and new home sales in 2019?
First a graph of RI as a percent of Gross Domestic Product (GDP) through Q3 2018:
 Click on graph for larger image.
Usually residential investment is a strong contributor to GDP growth and employment in the early stages of a recovery, but not this time - and that weakness was a key reason why the start of the recovery was sluggish.
Residential investment finally turned positive during 2011 and made a solid positive contribution to GDP every year through 2017.
We don't have the data for Q4 2018 yet, but it appears RI will make a small negative contribution to GDP in 2018.
RI as a percent of GDP is still low - close to the lows of previous recessions.
 The second graph shows total and single family housing starts through November 2018.
Housing starts are on pace to increase close to 5% in 2018, although growth slowed toward the end of 2018.
Even after the significant increase over the last several years, the approximately 1.26 million housing starts in 2018 will still be the 18th lowest on an annual basis since the Census Bureau started tracking starts in 1959 (the seven lowest years were 2008 through 2014). The other lower years were the bottoms of previous recessions.
 The third graph shows New Home Sales since 1963 through October 2018. The dashed line is the October sales rate.
Note: Due to the government shutdown, New Home sales for November are not available.
New home sales in 2018, through October, were up about 3% compared to the same period in 2017. However, sales were soft in Q4, and I estimate sales were about the same in 2018 as in 2017.
Here is a table showing housing starts and new home sales since 2005. No one should expect an increase to 2005 levels, however demographics and household formation suggest starts will increase further over the next few years.
| Housing Starts and New Home Sales (000s) | ||||
|---|---|---|---|---|
| Housing Starts | Change | New Home Sales | Change | |
| 2005 | 2,068 | --- | 1,283 | --- |
| 2006 | 1,801 | -12.9% | 1,051 | -18.1% |
| 2007 | 1,355 | -24.8% | 776 | -26.2% |
| 2008 | 906 | -33.2% | 485 | -37.5% |
| 2009 | 554 | -38.8% | 375 | -22.7% |
| 2010 | 587 | 5.9% | 323 | -13.9% |
| 2011 | 609 | 3.7% | 306 | -5.3% |
| 2012 | 781 | 28.2% | 368 | 20.3% |
| 2013 | 925 | 18.5% | 429 | 16.6% |
| 2014 | 1,003 | 8.5% | 437 | 1.9% |
| 2015 | 1,112 | 10.9% | 501 | 14.7% |
| 2016 | 1,174 | 5.6% | 561 | 12.0% |
| 2017 | 1,203 | 2.5% | 613 | 9.3% |
| 20181 | 1,263 | 5.0% | 613 | 0.0% |
| 12018 estimated | ||||
Most analysts are looking for starts and new home sales to increase to slightly in 2019. For example, the NAHB is forecasting a slight increase in starts (to 1.269 million), and no change in home sales in 2019. And Fannie Mae is forecasting a slight increase in starts (to 1.265 million), and for new home sales to increase to 619 thousand in 2019.
My sense is the weakness in late 2018 will continue into 2019, and starts will be down year-over-year, but not a huge decline. My guess is starts will decrease slightly in 2019 and new home sales will be close to 600 thousand.
Here are the Ten Economic Questions for 2019 and a few predictions:
• Question #1 for 2019: Will Mr. Trump negatively impact the economy in 2019?
• Question #3 for 2019: Will job creation in 2019 be as strong as in 2018?
• Question #4 for 2019: What will the unemployment rate be in December 2019?
• Question #5 for 2019: Will the core inflation rate rise in 2019? Will too much inflation be a concern in 2019?
• Question #6 for 2019: Will the Fed raise rates in 2019, and if so, by how much?
• Question #7 for 2019: How much will wages increase in 2019?
• Question #8 for 2019: How much will Residential Investment increase?
• Question #9 for 2019: What will happen with house prices in 2019?
• Question #10 for 2019: Will housing inventory increase or decrease in 2019?
Dallas Fed: "Texas Manufacturing Expands Modestly, Outlook Worsens"
by Calculated Risk on 12/31/2018 10:38:00 AM
From the Dallas Fed: Texas Manufacturing Expands Modestly, Outlook Worsens
Texas factory activity continued to expand rather modestly in December, according to business executives responding to the Texas Manufacturing Outlook Survey. The production index, a key measure of state manufacturing conditions, inched down one point to 7.3.This was the last of the regional Fed surveys for December.
Other indexes of manufacturing activity also suggested modest growth in December, although demand growth picked up a bit. The capacity utilization index fell from 9.4 to 7.6, and the shipments index dipped to 6.1. Meanwhile, the new orders index moved up five points to 14.4, and the growth rate of new orders index edged up to 5.8.
Perceptions of broader business conditions turned slightly negative in December. The general business activity index plummeted 23 points to -5.1, hitting its lowest level since mid-2016. The company outlook index also fell markedly, dropping 17 points to -3.4, also a two-and-a-half-year low. More than 20 percent of manufacturers noted their outlook worsened this month.
Labor market measures suggested continued but slightly slower employment growth and longer workweeks in December. The employment index retreated five points to 11.0, a level still above average.
emphasis added
Here is a graph comparing the regional Fed surveys and the ISM manufacturing index:
 Click on graph for larger image.
The New York and Philly Fed surveys are averaged together (yellow, through December), and five Fed surveys are averaged (blue, through December) including New York, Philly, Richmond, Dallas and Kansas City. The Institute for Supply Management (ISM) PMI (red) is through November (right axis).
Based on these regional surveys, it seems likely the ISM manufacturing index will decline significantly in December and probably be below the consensus forecast of 58.0 (to be released on Thursday, January 3rd).
Sunday, December 30, 2018
Sunday Night Futures
by Calculated Risk on 12/30/2018 08:58:00 PM
Weekend:
• Schedule for Week of December 30, 2018
Monday:
• At 10:30 AM ET, Dallas Fed Survey of Manufacturing Activity for December. This is the last of regional manufacturing surveys for December.
From CNBC: Pre-Market Data and Bloomberg futures: S&P 500 are up 12 and DOW futures are up 130 (fair value).
Oil prices were down slightly over the last week with WTI futures at $45.40 per barrel and Brent at $53.27 per barrel. A year ago, WTI was at $60, and Brent was at $67 - so oil prices are down about 25% year-over-year.
Here is a graph from Gasbuddy.com for nationwide gasoline prices. Nationally prices are at $2.25 per gallon. A year ago prices were at $2.49 per gallon, so gasoline prices are down 24 cents per gallon year-over-year.


