by Calculated Risk on 4/22/2009 10:24:00 AM
Wednesday, April 22, 2009
DOT: U.S. Vehicle Miles Off 0.9% in February
The Dept of Transportation reports on U.S. Traffic Volume Trends:
[T]ravel during February 2009 on all roads and streets in the nation changed by -0.9 percent (-1.9 billion vehicle miles) resulting in estimated travel for the month at 215.8 billion vehicle-miles.Update: added the leap year adjustment.
...
NOTE: The Average Daily Travel changed by +2.7% for February 2009 as compared to February 2008
 Click on graph for larger image in new window.
The first graph shows the annual change in the rolling 12 month average of U.S. vehicles miles driven. Note: the rolling 12 month average is used to remove noise and seasonality.
By this measure, vehicle miles driven are off 3.6% Year-over-year (YoY); the decline in miles driven is worse than during the early '70s and 1979-1980 oil crisis.
 The second graph shows the comparison of month to the same month in the previous year as reported by the DOT.
 This comparison has been improving. As the DOT noted, miles driven in February 2009 were 0.9% less than in February 2008.
Year-over-year miles driven started to decline in December 2007, and really fell off a cliff in March 2008. So the March 2009 report, to be released next month, will be very interesting.
Thursday, March 19, 2009
DOT: U.S. Vehicle Miles Off 3.1% in January
by Calculated Risk on 3/19/2009 11:49:00 AM
The Dept of Transportation reports on U.S. Traffic Volume Trends:
[T]ravel during January 2009 on all roads and streets in the nation changed by -3.1 percent (-7.0 billion vehicle miles) resulting in estimated travel for the month at 222.4 billion vehicle-miles.
 Click on graph for larger image in new window.
The first graph shows the rolling 12 month total vehicle miles driven since 1971.
The second graph shows the annual change in the rolling 12 month average of U.S. vehicles miles driven. Note: the rolling 12 month average is used to remove noise and seasonality.
 By this measure, vehicle miles driven are off 3.6% Year-over-year (YoY); the decline in miles driven is worse than during the early '70s and 1979-1980 oil crisis.
 As the DOT noted, miles driven in January 2009 were 3.1% less than January 2008.
Even with much lower gasoline prices in January 2009 ($1.84 per gallon) compared to January 2008 ($3.09 per gallon), the total vehicle miles driven is less because of the weaker economy.
Sunday, March 15, 2009
Domestic Oil Investment to Decline Sharply in 2009
by Calculated Risk on 3/15/2009 12:18:00 PM
Here is another area of domestic non-residential investment that will slump in 2009.
From the NY Times: As Oil and Gas Prices Plunge, Drilling Frenzy Ends
The great American drilling boom is over.The following graph compares real domestic investment in petroleum and natural gas with real gasoline prices.
The number of oil and gas rigs deployed to tap new energy supplies across the country has plunged to less than 1,200 from 2,400 last summer, and energy executives say the drop is accelerating further.
 Click on graph for larger image in new window.
After the oil shock of 1973, oil exploration investment (real dollars) has tracked real gasoline prices pretty closely.
This graph shows oil investment in 2000 dollars. Investment in 2008 was $138 billion in nominal dollars.
The recent rapid decline in gasoline prices suggests investment in petroleum and natural gas exploration and wells could decline by 1/3 or more in 2009 from the $138 billion invested in 2008. This is another area of non-residential structure investment that will decline sharply in 2009 - along with investment in offices, malls and hotels.
Note: Real gasoline prices are annual prior to 1980. The gasoline data is from the EIA.
Saturday, March 07, 2009
The Oil Cushion
by Calculated Risk on 3/07/2009 12:43:00 PM
Last year I wrote a post about how falling oil prices would provide some cushion for the U.S. economy: The Oil Cushion. Here is an update ...
The following graph shows the monthly personal consumption expenditures (PCE) at a seasonally adjusted annual rate (SAAR) for gasoline, oil and other energy goods compared to the U.S. spot price for oil (monthly).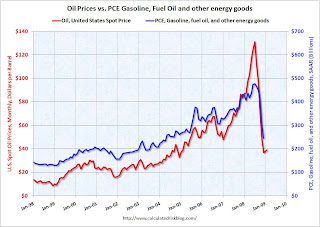 Click on graph for larger image in new window.
The good news is at current oil prices (U.S. spot prices averaged about $39 per barrel in February), oil related PCE will be in the $250 billion seasonally adjusted annual rate (SAAR) range in Q1 - well below the $440 billion SAAR of the first 8 months of 2008.
This is a savings of about $16 billion per month compared to the first 8 months of 2008. That savings will definitely provide a cushion for consumers.
The previous two quarters (Q3 and Q4) saw two of the four largest percentage declines in PCE in the last 40 years (-4.3% and -3.8% respectively). But there was little or no oil cushion in Q3, and about $7 billion per month in Q4 ... and as expected, the Q4 oil cushion showed up more as savings, as opposed to other consumption. But savings is a help too, because rebuilding savings is a necessary step towards rebuilding household balance sheets.
In Q1 the oil savings is much larger and will probably provide more of a cushion for consumers.
Data sources:
PCE from BEA underlying detail tables: Table 2.4.5U. Personal Consumption Expenditures by Type of Product line 117.
Oil prices from EIA U.S. Spot Prices.
Thursday, February 19, 2009
U.S. Vehicle Miles Driven Off 3.6% in 2008
by Calculated Risk on 2/19/2009 11:20:00 AM
The Dept of Transportation reports on U.S. Traffic Volume Trends:
Travel on all roads and streets changed by -1.6% (-3.8 billion vehicle miles) for December 2008 as compared with December 2007. Travel for the month is estimated to be 237.2 billion vehicle miles.
Cumulative Travel for 2008 changed by -3.6% (-107.9 billion vehicle miles). The Cumulative estimate for the year is 2,921.9 billion vehicle miles of travel.
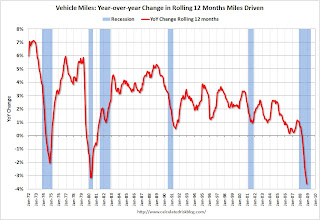 Click on graph for larger image in new window.
The first graph shows the annual change in the rolling 12 month average of U.S. vehicles miles driven. Note: the rolling 12 month average is used to remove noise and seasonality.
By this measure, vehicle miles driven are off 3.6% Year-over-year (YoY); the decline in miles driven is worse than during the early '70s and 1979-1980 oil crisis. As the DOT noted, miles driven in December 2008 were 1.6% less than December 2007, so the YoY change in the rolling average may start to increase.
 The second graph shows the change from the same month in the previous year. This is a noisy graph. Although miles driven was 1.6% less in December 2008 as compared to December 2007, the decline from the previous year was much less than the previous months.
For miles driven in December, the sharp decline in gasoline prices offset the impact from the slowing economy.
Thursday, January 22, 2009
DOT: U.S. Vehicle Miles Driven Declines Sharply
by Calculated Risk on 1/22/2009 09:48:00 AM
The Dept of Transportation reports on U.S. Traffic Volume Trends:
Travel on all roads and streets changed by -5.3% (-12.9 billion vehicle miles) for November 2008 as compared with November 2007. Travel for the month is estimated to be 230.4 billion vehicle miles.
Cumulative Travel for 2008 changed by -3.7% (-102.1 billion vehicle miles). The Cumulative estimate for the year is 2,656.2 billion vehicle miles of travel.
 Click on graph for larger image in new window.
This graph shows the annual change in the rolling 12 month average of U.S. vehicles miles driven. Note: the rolling 12 month average is used to remove noise and seasonality.
By this measure, vehicle miles driven are off a record 3.7% Year-over-year (YoY); the decline in miles driven is worse than during the early '70s and 1979-1980 oil crisis. As the DOT noted, miles driven in November 2008 were 5.4% less than November 2007, so the YoY change in the rolling average may get worse.
So far the slowing economy is more than offsetting the sharp decline in gasoline prices last year.
Wednesday, December 24, 2008
Oil Prices: Cliff Diving
by Calculated Risk on 12/24/2008 03:57:00 PM
From MarketWatch: Oil tumbles 9.3% as Cushing inventories hit record
Crude-oil futures fell for a third session Wednesday, tumbling 9.3% to close below $36 a barrel as government data showed inventories at a key delivery point hit a record.And all these Gulf States need $50 per barrel just to pay for their government programs.
Crude inventories at Cushing, Okla., the delivery point for crude futures contracts traded on the New York Mercantile Exchange, reached 28.7 million barrels in the week ended Dec. 19, the Energy Information Administration reported.
It was the highest since at least April 2004, when the government started collecting Cushing data.
...
Crude for February delivery ended down $3.63 at $35.35 a barrel in Nymex dealings.
And this is hitting other oil producers too, from Bloomberg: Russia’s Central Bank Devalues Ruble for Third Time in Week
Russia devalued the ruble for the third time in a week, sending the currency to its lowest level against the dollar since January 2006, as oil’s drop below $37 a barrel dimmed the outlook for growth.
...
The economy, which recovered from the government’s 1998 debt default to expand an average 7 percent in the eight years to 2007, may slip into a recession in the first half of 2009, Kremlin economic adviser Arkady Dvorkovich told Bloomberg Television on Dec. 19.
The government will post a budget deficit next year for the first time in a decade and will use its $132.6 billion reserve fund, or extra oil revenue the government has set aside, to cover the financing gap, Dvorkovich told reporters in Moscow today.
Sunday, December 21, 2008
U.S. retail gasoline prices decline to $1.66 per gallon
by Calculated Risk on 12/21/2008 07:20:00 PM
From Bloomberg: U.S. Retail Gasoline Falls to $1.66 a Gallon, Lundberg Says
The average price of regular gasoline at U.S. filling stations fell to $1.66 a gallon as the nation’s recession sapped demand.
Gasoline slipped 9 cents, or 5.1 percent, in the two weeks ended Dec. 19, according to oil analyst Trilby Lundberg’s survey of 7,000 filling stations nationwide.
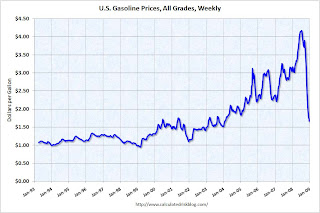 Click on graph for larger image in new window.
 This graph shows the nominal weekly U.S. gasoline prices since 1993 (source: EIA)
Gasoline prices are close to the 2000 through 2003 price range, when the median prices was just over $1.50 per gallon.
Friday, December 19, 2008
Crude Oil below $33 per Barrel
by Calculated Risk on 12/19/2008 04:39:00 PM
From Bloomberg: New York Oil Falls as Stockpiles at Cushing, Oklahoma, Climb
Crude oil dropped below $33 a barrel in New York as rising stockpiles at Cushing, Oklahoma, leave little room to store supplies for delivery next year.UPDATE: For those that missed it, the article also mentions:
The more-active February contract rose 69 cents, or 1.7 percent, to $42.36.But my key points concerning the economic impact are the same.
For the U.S. economy, I think there are two points worth repeating: 1) this decline in oil prices will significantly reduce PCE for gasoline, oil and other energy goods - and provide a stimulus for U.S. household to either save more, or spend more on other items, and 2) the oil price decline will also impact investment in domestic oil production (also foreign oil production, but that doesn't direclty impact the U.S. economy).
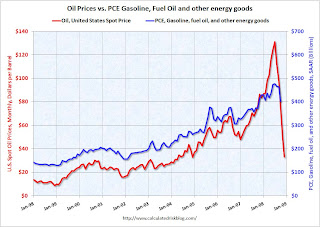
The following graph shows the monthly personal consumption expenditures (PCE) at a seasonally adjusted annual rate (SAAR) for gasoline, oil and other energy goods compared to the U.S. spot price for oil (monthly).
 Click on graph for larger image in new window.
 At current oil prices, it appears oil related PCE could fall to $250 billion or so SAAR, from close to $500 billion SAAR in July. This is a savings of almost $20 billion per month compared to July. And that would be helpful and definitely provide some cushion for consumers. This might show up as more savings, as opposed to other consumption, but rebuilding savings is probably a necessary step towards rebuilding household balance sheets.
Data sources: PCE from BEA underlying detail tables: Table 2.4.5U. Personal Consumption Expenditures by Type of Product line 117. Oil prices from EIA U.S. Spot Prices.
The second graph (repeated from earlier in the week) compares real oil prices (data from the St. Louis Fed, adjusted with CPI) and real investment in petroleum exploration and wells in the U.S. (data from the BEA).
This doesn't include investment in alternative energy sources.
 Not surprisingly there is a strong correlation between oil prices and investment. With oil prices now in the $33 per barrel range, this suggests that domestic investment could fall under $20 billion per year or so. This is another area of non-residential investment that will probably see a significant decline in 2009.
Monday, December 15, 2008
The Impact of Falling Oil Prices on Energy Investment
by Calculated Risk on 12/15/2008 11:02:00 PM
Jad Mouawad at the NY Times writes about the impact of falling oil prices on investment: Big Oil Projects Put in Jeopardy by Fall in Prices
The NY Times article discusses the impact of falling oil prices on energy investment worldwide, but also interesting is the impact on domestic investment. The following graph compares real oil prices (data from the St. Louis Fed, adjusted with CPI) and real investment in petroleum exploration and wells in the U.S. (data from the BEA).
This doesn't include investment in alternative energy sources. Click on graph for larger image in new window.
Not surprisingly there is a strong correlation between oil prices and investment. With oil prices now in the $45 per barrel range, this suggests that domestic investment could fall to $25 billion per year or so. This is another area of non-residential investment that will probably see a significant decline in 2009.
Saturday, December 13, 2008
Oil Prices: Cliff Diving
by Calculated Risk on 12/13/2008 09:06:00 AM
The Goldman Sachs analyst who predicted oil at $200 per barrel in 2008, has lowered his 2009 forecast again.
From The Times: Expert cuts $200-a-barrel oil forecast to $45
In a research note published late on Thursday, [Goldman Sachs oil analyst Arjun] Murti's team said that it had been compelled to trim its average price outlook for next year to $45, from a previously reduced forecast of $75, because of a “continued deterioration in global oil demand”.
The note read: “Global economic conditions are the weakest the world has seen since at least the early 1980s and demand is declining at an accelerating rate.”
...
“We think that the sharp and sudden collapse in global oil demand exceeds Opec's ability to, on its own, balance markets, and necessitates sharply lower non-Opec crude-oil supply,” the report said.
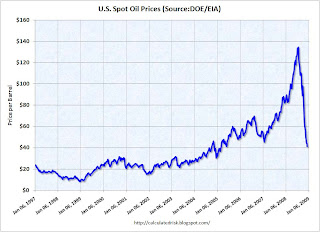 Click on graph for larger image in new window.
This graph shows the weekly U.S. spot oil prices (from EIA). This is some serious cliff diving.
Murti expects production cuts from both OPEC and non-OPEC producers. However, as I noted in Thoughts on Oil, it is difficult for some countries to cut production when their expenditures are $50 per barrel and oil prices are in the mid $40!
The only good news for oil producers is there was an increase in gasoline consumption in the U.S. in October (see DOT: Gasoline Demand Increases in October), but vehicle miles driven in the U.S. was still 3.5% below last year. And with China's economy weakening significantly, global demand for oil will probably be weak in 2009.
Friday, December 12, 2008
DOT: Gasoline Demand Increases in October
by Calculated Risk on 12/12/2008 01:24:00 PM
The Dept of Transportation reports on U.S. Traffic Volume Trends:
Travel on all roads and streets changed by -3.5% (-9.0 billion vehicle miles) for October 2008 as compared with October 2007. Travel for the month is estimated to be 249.7 billion vehicle miles.
 Click on graph for larger image in new window.
This graph shows the annual change in the rolling 12 month average of U.S. vehicles miles driven through October (from DOT). The number of U.S. vehicle miles driven has fallen off a cliff with high gasoline prices, rising unemployment and an overall weaker economy. Note: the rolling 12 month average is used to remove noise and seasonality.
By this measure, vehicle miles driven are off 3.4% YoY, and the decline in miles driven is worse than during the early '70s oil crisis - and about the same as the 1979-1980 declines. Miles driven in October 2008 were 3.5% less than October 2007, however miles driven were up sharply from September. (Note: the usual pattern is for miles driven to increase from September to October by about 2.5%, however this October miles were up over 7% due to lower gasoline prices)
 The second graph shows the weekly U.S. gasoline prices from the EIA through Dec 1st. This shows that gasoline prices really started to decline in October (still high in September). So we have been waiting for the October and November vehicle mile reports to see the impact of sharply lower gasoline prices.
 As I noted in my thoughts on oil, I expected vehicle miles to start increasing again with lower prices. I believe the impact of price declines on driving behavior will more than offset higher unemployment and the weaker economy. This report suggests that view is correct.
Tuesday, December 09, 2008
Report: Consumers Buying more Gasoline
by Calculated Risk on 12/09/2008 06:28:00 PM
From Bloomberg: U.S. Gasoline Demand Up First Time Since April, MasterCard Says (hat tip Travis)
U.S. gasoline demand rose last week for the first time since April as prices at the pump fell further ... Motorists bought an average 9.331 million barrels of gasoline a day in the week ended Dec. 5, up from 9.302 million a year earlier, MasterCard, the second-biggest credit-card company, said in its weekly SpendingPulse report.This weekend I speculated (among other things) that lower gasoline prices would have a larger impact on miles driven than unemployment and the weaker economy. This evidence suggests that that might be correct.
...
“The price relief seems to have had a meaningful steady impact on demand,” said Michael McNamara, vice president of research and analysis for MasterCard Advisors.
The miles driven data from the DOT (for October) will be released in about 10 days.
Sunday, December 07, 2008
Thoughts on Oil
by Calculated Risk on 12/07/2008 03:07:00 PM
All year we have been discussing the potential for significant demand destruction with regards to oil - the weaker economy and higher prices leading to less consumption in the U.S. and elsewhere, the demand impact of the Chinese stockpiling oil before the Olympics (and subsequently reducing demand after the Olympics), other Asian countries reducing their subsidies - all leading to a significant decline in oil prices in the 2nd half of 2008.
Now that oil prices have fallen sharply to around $40 per barrel, here are some further thoughts ...
First, I think it will be interesting to see if U.S. vehicle miles driven increases with gasoline prices now below $2 per gallon. Or will households just save the difference?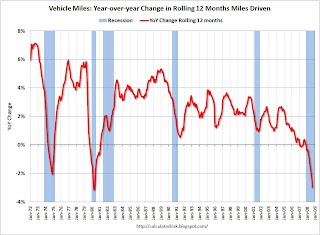 Click on graph for larger image in new window.
This graph shows the annual change in the rolling 12 month average of U.S. vehicles miles driven through September (from DOT). The number of U.S. vehicle miles driven has fallen off a cliff with high gasoline prices, rising unemployment and an overall weaker economy. Note: the rolling 12 month average is used to remove noise and seasonality.
By this measure, vehicle miles driven are off 3.0% YoY, and the decline in miles driven is worse than during the early '70s oil crisis - and about the same as the 1979-1980 declines. As the DOT noted, miles in September 2008 were 4.4% less than September 2007, so the YoY change in the rolling average will probably get worse. The second graph shows the weekly U.S. gasoline prices from the EIA through Dec 1st. This shows that gasoline prices really declined in October - but prices in September were still over $3.50 per gallon. So we will have to wait for the October and November vehicle mile reports to see the impact of sharply lower gasoline prices.
I expect vehicle miles to start increasing again - or at least stop declining. I think the impact of price declines on driving behavior will more than offset higher unemployment and the weaker economy. And gasoline prices are still falling in December!
How much will the decline in oil prices cushion the U.S. recession? That is another key question.
The following graph shows the monthly personal consumption expenditures (PCE through October) at a seasonally adjusted annual rate (SAAR) for gasoline, oil and other energy goods compared to the U.S. spot price for oil (monthly through November, December estimated at $41 per barrel). At current oil prices, it appears oil related PCE will fall to $250 to $300 billion SAAR, from close to $500 billion SAAR in July. This is a savings of over $15 billion per month compared to July. And that would be very helpful and definitely provide some cushion for consumers. This might show up as more savings, as opposed to other consumption, but rebuilding savings is probably a necessary step towards rebuilding household balance sheets.
Data sources: PCE from BEA underlying detail tables: Table 2.4.5U. Personal Consumption Expenditures by Type of Product line 117. Oil prices from EIA U.S. Spot Prices.
And this leads to the potential impact on oil producing countries and U.S. interest rates. Rachel Ziemba (filling in for Brad Setser) at RGE Monitor in March discussed how petrodollars are being spent by the GCC (Gulf Cooperation Council) countries in Petrodollars: How to Spend It. When I saw the following graph, my first thought was: What happens if oil prices fall? Rachel Ziemba writes:
2007 was the first year that spending growth outstripped revenues [growth] in the GCC and many other oil exporters. 2008 budget plans imply even higher current (especially wages and subsidies) and capital expenditures. Even countries that have traditionally saved more (Kuwait) are ramping up spending especially on capital projects and in some cases transfers to the population or pension funds. ... With megaprojects in the works in a variety of sectors including energy and other infrastructure, capital spending will likely continue to rise.With oil prices at $40 per barrel, and government spending at $50 per barrel, the math doesn't work!
And once again I'd like to recommend (again) this paper from Dr. Krugman: The Energy Crisis Revisited
The fact that oil is an exhaustible resource means that not extracting it is a form of investment. And it is an investment that might look attractive to a national government when oil prices are high. If a country does not want to spend all of the massive flow of cash generated by a sudden price increase on consumption, it must do one of three things: engage in real investment at home, which is subject to diminishing returns; invest abroad; or "invest" by cutting oil extraction, and hence reducing supply.
 Krugman: Figure 1.
So there is a definite possibility that over some range higher oil prices will lead to lower output. And given highly inelastic demand, as Cremer et al showed, that means that you can have multiple equilibria. Figure 1 illustrates the point: given the backward-bending supply curve and a steep demand curve, there are stable equilibria at both the low price PL and the high price PH.And my comment from back in March:
So there is a possibility that what has looked like peak oil to some observers (something I believe is coming), was actually GCC countries investing by not extracting oil. If oil prices start to fall, and with rising expenditures (see first graph again), the GCC countries might increase production - causing prices to fall further.Now that oil prices are below the level needed to support government expenditure in the GCC, I think OPEC's talk of production cuts is mostly just talk.
And finally, I've been writing about how China might cut back on buying dollar denominated assets as they try to stimulate their domestic economy. However Dr. Brad Setser has argued several times that he views this is unlikely, and he recently highlighted this report from David Dollar and Louis Kuijs World Bank China Quarterly:
The last thing anyone needs to worry about is fall in Chinese demand for US treasuries.That is a good argument for China not cutting their purchases of U.S. assets, but what about oil producing countries? That has the same impact on demand for dollar denominated assets (just further down the chain).
...
The World Bank forecasts that China’s current account surplus will RISE not fall in 2009, going from an estimated $385 billion to $425 billion. How is that possible if real imports are forecast to grow faster than real exports? Easy – the terms of trade moved in China’s favor. The price of the raw materials China imports will fall faster than the value of China’s exports. China’s oil and iron bill will fall dramatically.
This touches on a number of related topics, and hopefully provides some food for thought on a Sunday. Best to all.
Wednesday, November 19, 2008
DOT: U.S. Vehicle Miles Off Sharply in September
by Calculated Risk on 11/19/2008 08:55:00 PM
The Dept of Transportation reports on U.S. Traffic Volume Trends:
Travel on all roads and streets changed by -4.4% (-10.7 billion vehicle miles) for September 2008 as compared with September 2007. Travel for the month is estimated to be 232.8 billion vehicle miles.
 Click on graph for larger image in new window.
This graph shows the annual change in the rolling 12 month average of U.S. vehicles miles driven. Note: the rolling 12 month average is used to remove noise and seasonality.
By this measure, vehicle miles driven are off 3.0% YoY, and the decline in miles driven is worse than during the early '70s oil crisis - and about the same as the 1979-1980 decline. As the DOT noted, miles in September 2008 were 4.4% less than September 2007, so the YoY change in the rolling average will probably get worse.
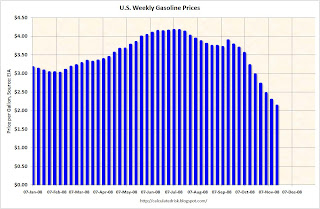 The second graph shows the weekly U.S. gasoline prices from the EIA. This shows that gasoline prices really declined in October - but prices in September were still over $3.50 per gallon. So we will have to wait for the October vehicle miles report to see the impact of sharply lower gasoline prices.
 Lower gasoline prices should mean more vehicle miles driven, but the weakening economy might offset the impact from lower prices.
Saturday, October 25, 2008
The Oil Cushion
by Calculated Risk on 10/25/2008 11:03:00 PM
How much will the decline in oil prices cushion the U.S. recession? That seems like a key question.
Here is an excerpt from Time: What's Behind (and Ahead for) the Plunging Price of Oil
If gasoline drops $1.50 the $900 [the average driver] saves would amount to a big stimulus package. According to Ed Leamer, director of the UCLA's Anderson Forecast, the current price slide could drop another $200-to-$250 billion into consumers' pockets, given that as of the second quarter personal spending for gas fuel oil and other energy was about $442 billion on an annualized basis.The following graph shows the monthly personal consumption expenditures (PCE) at a seasonally adjusted annual rate (SAAR) for gasoline, oil and other energy goods compared to the U.S. spot price for oil (monthly).
 Click on graph for larger image in new window.
 At current oil prices, it appears oil related PCE will fall to $300-$350 billion SAAR, from close to $500 billion SAAR in July. This is a savings of $12 to $15 billion per month compared to July. And that would be helpful and definitely provide some cushion for consumers. This might show up as more savings, as opposed to other consumption, but rebuilding savings is probably a necessary step towards rebuilding household balance sheets.
Data sources:
PCE from BEA underlying detail tables: Table 2.4.5U. Personal Consumption Expenditures by Type of Product line 117.
Oil prices from EIA U.S. Spot Prices.
Friday, October 24, 2008
DOT: U.S. Vehicles Miles Driven Off Sharply in August
by Calculated Risk on 10/24/2008 11:54:00 AM
The Dept of Transportation reports on U.S. Traffic Volume Trends:
Travel on all roads and streets changed by -5.6% (-15.0 billion vehicle miles) for August 2008 as compared with August 2007. Travel for the month is estimated to be 253.7 billion vehicle miles.
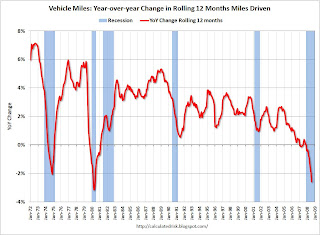 Click on graph for larger image in new window.
This graph shows the annual change in the rolling 12 month average of U.S. vehicles miles driven. Note: the rolling 12 month average is used to remove seasonality.
By this measure, vehicle miles driven are off 2.6% YoY, and the decline in miles driven is worse than during the early '70s oil crisis - and almost as bad as the 1979-1980 decline.
From the WSJ: Oil Prices Drop, Despite OPEC Cut
Crude-oil futures Friday fell to their lowest point since May 2007, with concerns of a global recession overwhelming an Organization of Petroleum Exporting Countries decision to trim output.This is clear demand destruction.
Light, sweet crude for December delivery was recently down $4.38, or 6.5%, at $63.46 a barrel on the New York Mercantile Exchange. Brent crude on the ICE Futures exchange fell $4.19 to $61.73 a barrel.
Nymex crude is off more than $80 from July's record highs. Oil's speedy reversal pushed OPEC to convene an emergency meeting in Vienna early Friday, where the cartel pledged to cut 1.5 million barrels a day from its production quota of 28.8 million barrels a day, effective Nov. 1.
Thursday, October 16, 2008
Oil Below $70 per Barrel
by Calculated Risk on 10/16/2008 11:15:00 AM
From AFP: Oil price hits 15-month low under $68
Oil prices slumped further on Thursday, with Brent crude briefly sliding close to 67 dollars a barrel and the lowest level for more than 15 months, as slowing energy demand took its toll, traders said.The free fall continues. At least this will help with inflation and take some pressure off consumer spending.
Crude oil futures were down more than 50 percent from record highs of above 147 dollars reached in July ...
Thursday, October 09, 2008
Trade Deficit and Oil
by Calculated Risk on 10/09/2008 07:06:00 PM
Something a little different ...
Tomorrow morning the Department of Commerce will release the trade deficit report for August. Some people might be looking at this report to see the impact of falling oil prices and slowing export growth.
It is helpful to remember that oil prices peaked in July, but there is a lag between spot price and import prices. Therefore I expect import oil prices to be a little higher for August than July.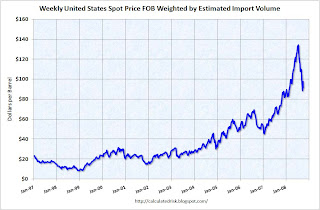 Click on table for larger image in new window.
This graph, based on data from the EIA, shows the weekly spot prices for oil weighted by import volume.
I expect that the collapse in oil prices will not show up until the September trade deficit report.
Oil prices fell even further today, from the AP: Demand destruction: Oil prices drop to 1-year low.
And export growth may be slowing, but I don't expect to see much evidence in the August report. If we look at container traffic at the Los Angeles area ports, exports were still strong in August.
So the trade deficit tomorrow probably won't show either the impact from falling oil prices or slowing export growth. Just something to remember when we read the news reports.
Monday, September 22, 2008
Oil Futures Hit $130 per Barrel
by Calculated Risk on 9/22/2008 02:42:00 PM
From MarketWatch: Crude futures set for biggest daily price leap ever
Crude futures leaped as much as $25 per barrel, or 24.3%, shortly before the New York close Monday, to tap a high of $130 per barrel.Wow.


