by Calculated Risk on 2/19/2009 11:20:00 AM
Thursday, February 19, 2009
U.S. Vehicle Miles Driven Off 3.6% in 2008
The Dept of Transportation reports on U.S. Traffic Volume Trends:
Travel on all roads and streets changed by -1.6% (-3.8 billion vehicle miles) for December 2008 as compared with December 2007. Travel for the month is estimated to be 237.2 billion vehicle miles.
Cumulative Travel for 2008 changed by -3.6% (-107.9 billion vehicle miles). The Cumulative estimate for the year is 2,921.9 billion vehicle miles of travel.
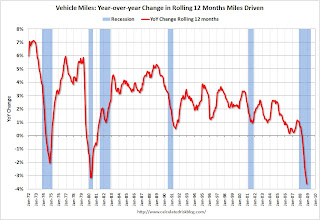
 Click on graph for larger image in new window.
The first graph shows the annual change in the rolling 12 month average of U.S. vehicles miles driven. Note: the rolling 12 month average is used to remove noise and seasonality.
By this measure, vehicle miles driven are off 3.6% Year-over-year (YoY); the decline in miles driven is worse than during the early '70s and 1979-1980 oil crisis. As the DOT noted, miles driven in December 2008 were 1.6% less than December 2007, so the YoY change in the rolling average may start to increase.
 The second graph shows the change from the same month in the previous year. This is a noisy graph. Although miles driven was 1.6% less in December 2008 as compared to December 2007, the decline from the previous year was much less than the previous months.
For miles driven in December, the sharp decline in gasoline prices offset the impact from the slowing economy.


