 RSS Feed
 by Calculated Risk on 8/29/2010 07:24:00 AM
Showing posts with label Weekly Summary. Show all posts
Showing posts with label Weekly Summary. Show all posts
Sunday, August 29, 2010
Summary for Week ending August 28th
It was a busy week ...
The NAR reported:
Existing-home sales, which are completed transactions that include single-family, townhomes, condominiums and co-ops, dropped 27.2 percent to a seasonally adjusted annual rate of 3.83 million units in July from a downwardly revised 5.26 million in June, and are 25.5 percent below the 5.14 million-unit level in July 2009.
...
Total housing inventory at the end of July increased 2.5 percent to 3.98 million existing homes available for sale, which represents a 12.5-month supply at the current sales pace, up from an 8.9-month supply in June.
 Click on graph for larger image in new window.
This graph shows existing home sales, on a Seasonally Adjusted Annual Rate (SAAR) basis since 1993.
Sales in July 2010 (3.83 million SAAR) were 27.2% lower than last month, and were 25.5% lower than July 2009 (5.14 million SAAR).
The next graph shows the year-over-year (YoY) change in reported existing home inventory and months-of-supply. Inventory is not seasonally adjusted, so it really helps to look at the YoY change.
 Although inventory increased from June 2010 to July 2010, inventory decreased 1.9% YoY in July. The slight year-over-year decline is probably because some sellers put their homes on the market in the Spring hoping to take advantage of the home buyer tax credit.
 Note: Usually July is the peak month for inventory.
A normal housing market usually has under 6 months of supply. The following graph shows the relationship between supply and house prices (using Case-Shiller).
 This graph show months of supply (through July 2010) and the annualized change in the Case-Shiller Composite 20 house price index (through May 2010).
Below 6 months of supply (blue line) house prices are typically rising (black line).
Above 6 or 7 months of supply, house prices are usually falling. This isn't perfect - it is just a guideline. This is a key reason why I expect house prices to fall further later this year as measured by the Case-Shiller and CoreLogic repeat sales house price indexes.
 The Census Bureau reports New Home Sales in July were at a seasonally adjusted annual rate (SAAR) of 276 thousand. This is an decrease from the record low of 315 thousand in June (revised down from 330 thousand).
This graph shows New Home Sales vs. recessions for the last 47 years.
And another long term graph - this one for New Home Months of Supply.
 Months of supply increased to 9.1 in July from 8.0 in June. The all time record was 12.4 months of supply in January 2009. This is still very high (less than 6 months supply is normal).
 The 276 thousand annual sales rate for July is the all time record low (May was revised up a little). This was another very weak report. New home sales are important for the economy and jobs - and this indicates that residential investment will be a sharp drag on GDP in Q3.
Here is my post on the MBA Q2 delinquency report: 14.42% of Mortgage Loans Delinquent or in Foreclosure . This graph (from the earlier post) shows the delinquency rate by "bucket" (30 days, 60 days, 90+ days, and in foreclosure process):
 The total percent of loans delinquent or in the foreclosure process declined only slightly in Q2 from Q1 - and the rate is the second highest on record.
Loans 30 days delinquent increased to 3.51%, and this is about the same levels as in Q4 2008 (slightly below the peak of 3.77% in Q1 2009).
Delinquent loans decreased in all other buckets - especially in the 90+ day bucket. MBA Chief Economist Jay Brinkmann suggested the decline in the 90+ day bucket was because of some successful modifications - since the lenders reported the loans as delinquent until the modification was made permanent.
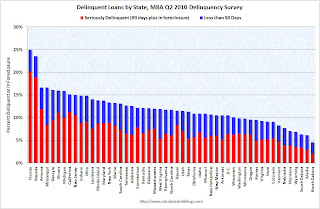 The second graph shows the delinquency rate by state (red is seriously delinquent: 90+ days or in foreclosure, blue is delinquent less than 90 days).
 Clearly Florida and Nevada have a large percentage of loans delinquent or in foreclosure. But the delinquency problem is widespread with 36 states and D.C. all having total delinquency rates above 10%.
With house prices falling - and growth slowing - the delinquency rate will probably increase later this year.
 Here is my post CoreLogic: 11 Million U.S. Properties with Negative Equity in Q2
This graph shows the negative equity and near negative equity by state.
Although Nevada, Arizona, Florida, Michigan and California, have the largest percentage of homeowners underwater, there is a negative equity problem in most states. In 33 states and the D.C., 10 percent or more of homeowners with mortgages have negative equity.
Best wishes to all.
Sunday, August 22, 2010
Summary for Week ending August 21st
by Calculated Risk on 8/22/2010 12:02:00 PM
Here is the Schedule for Week of August 22nd (always in menu bar too).
 Click on graph for larger image in new window.
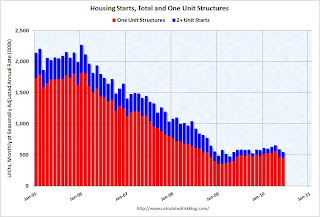
Total housing starts were at 546 thousand (SAAR) in July, up 1.7% from the revised June rate of 537 thousand (revised down from 549 thousand). Single-family starts declined 4.2% to 432 thousand in July.
The graph shows total and single unit starts since 1968. This shows the huge collapse following the housing bubble, and that housing starts have mostly been moving sideways for over a year - with a slight up and down over the last several months due to the home buyer tax credit.
The National Association of Home Builders (NAHB) reported the housing market index (HMI) was at 13 in August. This is down slightly from 14 in July and below expectations. The record low was 8 set in January 2009, and 13 is very low ...
Note: any number under 50 indicates that more builders view sales conditions as poor than good.
 This graph compares the NAHB HMI (left scale) with single family housing starts (right scale). This includes the August release for the HMI and the June data for starts (NAHB was released before starts).
This shows that the HMI and single family starts mostly move generally in the same direction - although there is plenty of noise month-to-month.
Press release from the NAHB: Builder Confidence Declines In August
Builder confidence in the market for newly built, single-family homes edged down for a third consecutive month in August ... The HMI declined one point to 13, its lowest level since March of 2009.
From CoreLogic (formerly First American LoanPerformance): CoreLogic® Home Price Index Increases Decelerate in June Note: CoreLogic reports the year-over-year change.
 This graph shows the national LoanPerformance data since 1976. January 2000 = 100.
The index is up 1.4% over the last year, and off 28% from the peak.
CoreLogic expects prices to "moderately decline" (more negative view than last month). I expect that we will see lower prices on this index later this year and into 2011.
This data is for June and was still impacted by the tax credit. I've been expecting this index to start showing price declines in July as sales collapsed.
Note: This index is a leading indicator for new Commercial Real Estate (CRE) investment.
 This graph shows the Architecture Billings Index since 1996. The index has remained below 50, indicating falling demand, since January 2008.
Note: Nonresidential construction includes commercial and industrial facilities like hotels and office buildings, as well as schools, hospitals and other institutions.
According to the AIA, there is an "approximate nine to twelve month lag time between architecture billings and construction spending" on non-residential construction. So there will probably be further declines in CRE investment into 2011.
From the NY Fed: New York Fed Releases New Report, Web Page on Household Credit Conditions in U.S., Select States Showing Decline in Consumer Indebtedness
Here is the report: Quarterly Report on Household Debt and Credit
And some data and graphs.
 Graph and text from the NY Fed. "Aggregate consumer debt continued to decline in the second quarter, continuing its trend of the previous six quarters. As of June 30, 2010, total consumer indebtedness was $11.7 trillion, a reduction of $812 billion (6.5%) from its peak level at the close of 2008Q3, and $178 billion (1.5%) below its March 31, 2010 level. ... Excluding mortgage and HELOC balances, consumer indebtedness fell 1.5% in the quarter and, after having fallen for six consecutive quarters, stands at $2.31 trillion, 8.4% below its 2008Q4 peak."
From the Fed: Industrial production and Capacity Utilization
 This graph shows Capacity Utilization. This series is up 9.8% from the record low set in June 2009 (the series starts in 1967).
 Capacity utilization at 74.8% is still far below normal - and well below the the pre-recession levels of 81.2% in November 2007.
Note: y-axis doesn't start at zero to better show the change.
The DOL reports on weekly unemployment insurance claims
 This graph shows the 4-week moving average of weekly claims since January 2000.
The four-week average of weekly unemployment claims increased this week by 8,000 to 482,500.
The dashed line on the graph is the current 4-week average. This is the highest level for initial claims - and also for the 4-week average - since November 2009.
Best wishes to all.
Sunday, August 15, 2010
Weekly Summary August 15th
by Calculated Risk on 8/15/2010 11:45:00 AM
Note: I'm going to split the weekly summary and the schedule for the coming week into two posts - sometimes one post was too long!
The big story of last week was that the Fed acknowledged the weaker U.S. economy and announced that they will reinvest maturing MBS into Treasury securities.
From the FOMC statement:
[T]he pace of recovery in output and employment has slowed in recent months [and] the pace of economic recovery is likely to be more modest in the near term than had been anticipated.The Fed's goal (according to the technical note from the NY Fed) is to "maintain the face value of outright holdings of domestic securities" at approximately $2.054 trillion.
...
[T]he Committee will keep constant the Federal Reserve's holdings of securities at their current level by reinvesting principal payments from agency debt and agency mortgage-backed securities in longer-term Treasury securities.
 Click on graph for larger image in new window.
The red line on this graph is the amount of outright holdings on the Fed's balance sheet. The dashed line is the new target level for quantitative neutrality.
The outright holdings were expected to fall by about $200 billion by the end of 2011 (some have estimated as high as $400 billion), and that would represent tightening in the face of high unemployment and below target inflation.
NY Fed FAQs: Reinvestment of Principal Payments on Agency Debt and Agency Mortgage-Backed Securities in Treasuries
And from the NY Fed: New York Fed Plans to Buy $18 billion in Treasuries over the next month
On a monthly basis, retail sales increased 0.4% from June to July (seasonally adjusted, after revisions), and sales were up 5.5% from July 2009. Retail sales increased 0.2% ex-autos.
 This graph shows retail sales since 1992.
 This is monthly retail sales, seasonally adjusted (total and ex-gasoline).
Retail sales are up 8.1% from the bottom, but still off 4.5% from the pre-recession peak.
This was close to expectations, but retail sales are still below the March 2010 level (moving sideways for four months).
The combined REO (Real Estate Owned) inventory for Fannie, Freddie and the FHA increased by 13% in Q2 2010 from Q1 2010. The REO inventory (lender Real Estate Owned) increased 74% compared to Q2 2009 (year-over-year comparison).
 This graph shows the REO inventory for Fannie, Freddie and FHA through Q2 2010.
The REO inventory for the "Fs" has increased sharply over the last year, from 135,868 at the end of Q2 2009 to 236,338 at the end of Q2 2010.
This is a new record for Fannie and Freddie; the FHA's REO inventory decreased slightly in Q2 2010.
Remember this is just a portion of the total REO inventory. Private label securities (PLS) and banks and thrifts also hold a substantial number of REOs.
From Diana Olick at CNBC: Foreclosure Math: Shadow Inventory Adds Up
Moody's estimates that private label repossessions stand at 203,665. ... "My best guess right now is that REO held by Fannie, Freddie, and FHA, and other government entities, and banks and thrifts is just under 600-thousand, but unfortunately it is on the rise," says [Thomas] Lawler.
The Census Bureau reports:
[T]otal June exports of $150.5 billion and imports of $200.3 billion resulted in a goods and services deficit of $49.9 billion, up from $42.0 billion in May, revised.This graph shows the U.S. trade deficit, with and without petroleum, through June.
 The blue line is the total deficit, and the black line is the petroleum deficit, and the red line is the trade deficit ex-petroleum products.
The increase in the deficit in June was unrelated to oil as the trade gap with China increased to $26.15 billion in June - the highest level since October 2008 and up sharply from last year.
Once again the imbalances have returned ... and July will probably be worse (see LA Port Traffic: Imports increase, Exports Flat)
From the Association of American Railroads: Rail Time Indicators. The AAR reports traffic in July 2010 was up 4.1% compared to July 2009 - and traffic was 14.6% lower than in July 2008.
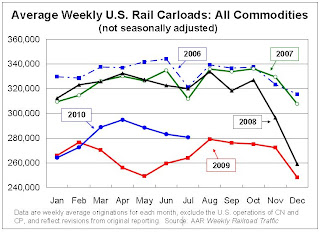 This graph shows U.S. average weekly rail carloads (NSA). Traffic increased in 14 of 19 major commodity categories year-over-year.
As the graph above shows, rail traffic collapsed in November 2008, and now, a year into the recovery, traffic has only recovered part way.
Seasonally there is usually a decline in traffic in July, so seasonally adjusted traffic increased last month. However traffic is only up 4.1% compared to July 2009.
From the National Federation of Independent Business (NFIB): Small Business Economic Trends
 NFIB reported its optimism index fell 0.9 point to 88.1 in July. (Graph from NFIB)
Note: A large percentage of small businesses are in real estate related fields and that will keep optimism down.
And once again the key problem is lack of demand.
Best wishes to all.
Sunday, August 08, 2010
Weekly Summary and Schedule, August 8th
by Calculated Risk on 8/08/2010 10:55:00 AM
The key economic report this week will be July retail sales to be released on Friday. The FOMC statement on Tuesday will also be closely watched.
Sometime this week the July rail traffic report, from the Association of American Railroads (AAR), and the July Ceridian-UCLA Pulse of Commerce Index (based on diesel fuel consumption) will probably both be released. Both showed transportation weakness in June.
On Tuesday, the National Association of Independent Business (NFIB) will release the small business optimism survey for July. Also on Tuesday, the BLS will release the Q2 Productivity and Costs report, and the Census Bureau will release the Monthly Wholesale Trade: Sales and Inventories for June.
The Federal Reserve’s Federal Open Market Committee (FOMC) will meet on Tuesday, and the FOMC statement will be released at around 2:15 PM ET. This will be closely scrutinized for a discussion of the economic slowdown since the last meeting on June 23rd – especially considering the two weak employment reports in the interim – and to see if the FOMC will slightly ease monetary policy. There has been some discussion that the Fed might announce they are reinvesting maturing mortgage backed securities (MBS) into either new MBS or Treasury securities.
Jon Hilsenrath discusses this possibility in the WSJ: Jobs Report Intensifies Fed Debate
A key item on the agenda is likely to be whether the Fed should tweak its strategy for managing its $1.1-trillion portfolio of mortgage backed securities so holdings don't shrink in the months ahead.On Wednesday, the MBA will release the mortgage purchase applications index. Also on Wednesday, the June Trade Balance report will be released at 8:30 AM by the Census Bureau. The consensus is for the U.S. trade deficit to increase slightly to $42.5 billion (from $42.3 billion in May). This might lead to further adjustments for Q2 GDP.
...
The divisive question for the Fed is what message they would be sending if they alter their reinvestment strategy. Fed officials are acutely aware that if they start reinvesting proceeds from maturing mortgage bonds -- as they now do for maturing Treasury debt -- many investors will think they are laying the groundwork for a more dramatic move of large scale purchases of new bonds ...
Also on Wednesday the Job Openings and Labor Turnover Survey (JOLTS) for June will be released at 10 AM by the BLS. This report has been showing very little turnover in the labor market and few job openings.
On Thursday, the initial weekly unemployment claims will be released. Consensus is for a decline to 460K from 479K last week.
On Friday, the Consumer Price Index for July will be released at 8:30 AM. This is expected to show a 0.2% increase in prices. Also on Friday July retail sales will be released at 8:30 AM. The consensus is for an increase of 0.5% from the June rate, and 0.2% increase ex-autos. Also the preliminary August Reuter's/University of Michigan's Consumer sentiment index will be released at 9:55 AM, and June Business inventories will be released at 10 AM.
And of course the FDIC will probably have another busy Friday afternoon ...
And a summary of last week:
Total nonfarm payroll declined by 131,000 in July.
The number of temporary decennial Census worker declined by 143,000.
So the total nonfarm ex-Census is -143,000 minus -131,000 = +12,0001.
1For an explanation, see: Employment Report: Why the different payroll numbers?
 Click on graph for larger image.
This graph shows the job losses from the start of the employment recession, in percentage terms.
The dotted line shows the impact of Census hiring. In July, there were 196,000 temporary 2010 Census workers on the payroll. The number of Census workers will continue to decline - and the gap between the solid and dashed red lines will be gone in a few months.
Sunday, August 01, 2010
Weekly Summary and Schedule, August 1st
by Calculated Risk on 8/01/2010 11:55:00 AM
The key economic report this week will be the July Employment Report to be released on Friday. It will be a busy week ...
On Monday, the Census Bureau will release Construction Spending for June at 10 AM. The consensus is for a 0.5% decline in spending (although the tax credit related decline will show up in the July report). Also on Monday, the ISM manufacturing survey for July will be released at 10 AM ET. Most of the regional surveys suggest growth in the manufacturing sector slowed in July, and the consensus is for a decline in the ISM index to 54 from 56.2 in June.
Also on Monday, Fed Chairman Ben Bernanke will address the Southern Legislative Conference 64th Annual Meeting at 10:30 AM ET in Charleston, South Carolina. The title of his speech is: "Challenges for the Economy and State Governments"
On Tuesday, the BEA will release the June Personal Income and Outlays report. The consensus is for a 0.1% increase in income, and a 0.1% increase in spending. With the strong downwards revision in the GDP report for personal consumption expenditures, this report will be interesting (the savings rate increased too).
Also on Tuesday, the June Manufacturers' Shipments, Inventories and Order will be released at 10 AM, and the NAR will release Pending Home Sales for June. The collapse for pending home sales happened in May, and this report might show another slight decline.
Also on Tuesday, the automakers will report vehicle sales for July. Expectations are for about a 11.6 million SAAR for light vehicles in July – up from the 11.1 million sales rate in June. Some forecasts are even higher, from Edmunds:
Edmunds.com analysts predict that July's Seasonally Adjusted Annualized Rate (SAAR) will be 11.8 million, up from 11.1 in June 2010.Also on Tuesday, the American Bankruptcy Institute will probably report personal bankruptcy filings for July. This will probably show another "surge" in filings.
"July sales numbers should be the highest we've seen since last August's 'Cash for Clunkers' frenzy," reported Edmunds.com Senior Analyst Ray Zhou, PhD. "Retail demand for new cars this month has been the strongest of the year, even more than in March when Toyota launched an aggressive incentive campaign and other automakers followed suit."
On Wednesday, the ADP employment report will be released (consensus is for an increase of 35K private sector jobs, up from 13K in June). Also on Wednesday, the ISM non-manufacturing index for July will be released at 10 AM. The consensus is for a slight decline from the 53.8 June reading. Also on Wednesday, the MBA will release the mortgage Purchase Applications Index. This index collapsed following the tax credit, but has been bouncing around at a low level for the last couple of months.
Also on Wednesday, the quarterly NMHC Apartment Market Tightness index for July will probably be released. Last quarter this report showed a surprising tightening in the apartment market index, and some increases in effective rents.
On Thursday, the initial weekly unemployment claims report will be released. Consensus is for a slight decline to 455K from 457K last week.
And on Friday, the BLS will release the July Employment report at 8:30 AM. The consensus is for a loss of 70,000 payroll jobs in July, and for the unemployment rate to increase slightly to 9.6% (from 9.5%). Of course the minus 70,000 includes a substantial decline in the number of temporary hires for Census 2010 (May was the peak month). It will be important to remove the Census hiring to try to determine the underlying trend. Consensus is around a gain of 75,000 payroll jobs ex-Census. (see Estimate of July Decennial Census impact on payroll employment: minus 144,000 ).
As a reminder, the media stories on the employment report will be confusing because of the Census hiring. There are three numbers that will be reported:
All three numbers have meaning, but when trying to remove the impact of hiring for the decennial Census, the 2nd number is consistent with non-Census year reports.
Also on Friday the Fed will release Consumer Credit. The consensus is for another decline in credit of around $5 billion. And Friday afternoon will be another BFF (Bank Failure Friday) ...
And a summary of last week:
The Census Bureau reported New Home Sales in June were at a seasonally adjusted annual rate (SAAR) of 330 thousand. This is an increase from the record low of 267 thousand in May (revised from 300 thousand). Ignore all the month to previous month comparisons. May was revised down sharply and that makes the increase look significant. Here is the bottom line: this was the worst June for new home sales on record.
 Click on graph for larger image in new window.
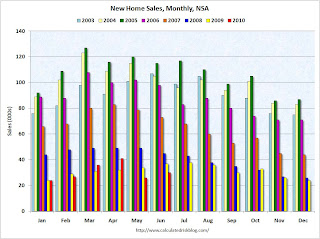
This graph shows monthly new home sales (NSA - Not Seasonally Adjusted).
Note the Red columns for 2010. In June 2010, 30 thousand new homes were sold (NSA). This is a new record low for June.
The previous record low for the month of June was 34 thousand in 1982; the record high was 115 thousand in June 2005.
Here are more graphs based on the New Home sales report.
Special Note: I apologize for a couple of errors in my original GDP post. I make plenty of typos, but I usually get the math right. I corrected the error as soon as possible.
From the BEA:
Real gross domestic product ... increased at an annual rate of 2.4 percent in the second quarter of 2010 ... Real personal consumption expenditures increased 1.6 percent in the second quarter, compared with an increase of 1.9 percent in the first.Here is a summary of the revisions to prior years:
| Quarter | GDP before revisions | Current GDP estimate | Change |
|---|---|---|---|
| 2007-I | 1.2% | 0.9% | -0.3% |
| 2007-II | 3.2% | 3.2% | 0.0% |
| 2007-III | 3.6% | 2.3% | -1.3% |
| 2007-IV | 2.1% | 2.9% | 0.8% |
| 2008-I | -0.7% | -0.7% | 0.0% |
| 2008-II | 1.5% | 0.6% | -0.9% |
| 2008-III | -2.7% | -4.0% | -1.3% |
| 2008-IV | -5.4% | -6.8% | -1.4% |
| 2009-I | -6.4% | -4.9% | 1.5% |
| 2009-II | -0.7% | -0.7% | 0.0% |
| 2009-III | 2.2% | 1.6% | -0.6% |
| 2009-IV | 5.6% | 5.0% | -0.6% |
| 2010-I | 2.7% | 3.7% | 1.0% |
| 2010-II | 2.4% |
 The revisions indicate that the recession was worse than originally estimated, and the recovery slightly weaker.
Here is a graph of the real PCE revisions.
Annualized real PCE is now 0.85% below the pre-recession peak.
This was a substantial downward revision.
S&P/Case-Shiller released the monthly Home Price Indices for May (actually a 3 month average).
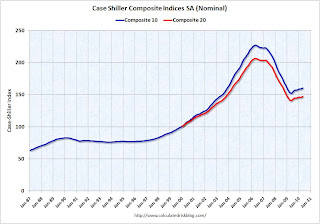 This graph shows the nominal seasonally adjusted Composite 10 and Composite 20 indices (the Composite 20 was started in January 2000).
The Composite 10 index is off 29.3% from the peak, and up 1.0% in May (SA).
The Composite 20 index is off 28.7% from the peak, and up 1.1% in May (SA).
The next graph shows the price declines from the peak for each city included in S&P/Case-Shiller indices.
 Prices increased (SA) in 15 of the 20 Case-Shiller cities in May seasonally adjusted.
Prices in Las Vegas are off 56.1% from the peak, and prices in Dallas only off 4.8% from the peak.
Note: Prices are probably starting to fall right now, but this will not show up in the Case-Shiller index for a few months.
The Census Bureau reported the homeownership and vacancy rates for Q2 2010 this week.
 The homeownership rate declined to 66.9%. This is the lowest level since 1999.
Note: graph starts at 60% to better show the change.
The homeownership rate increased in the '90s and early '00s because of changes in demographics and "innovations" in mortgage lending. The increase due to demographics (older population) will probably stick, so I've been expecting the rate to decline to the 66% to 67% range - and not all the way back to 64% to 65%.
For more on the homeownership rate, see: How far will the homeownership rate fall?
Here are graphs of the homeowner and rental vacancy rate.
Economic activity has continued to increase, on balance, since the previous survey, although the Cleveland and Kansas City Districts reported that the level of economic activity generally held steady.
Best wishes to all.
Sunday, July 25, 2010
Weekly Summary and Schedule, July 25th
by Calculated Risk on 7/25/2010 11:29:00 AM
The focus this week will be on the Q2 GDP report to be released on Friday. There are also two key housing reports: New Home Sales on Monday and Case-Shiller house prices on Tuesday.
On Monday, the June Chicago Fed National Activity Index will be released at 8:30 AM. This is a composite index of other data.
At 10 AM on Monday, the Census Bureau will release the New Home Sales report for June. The consensus is for a slight increase to 310 thousand at a seasonally adjusted annual rate (SAAR) from the record low 300 thousand in May.
Also on Monday, the Dallas Fed Manufacturing survey for July will be released at 10:30 AM. This is one of several regional surveys that will be released this week. Usually I don't highlight the minor regional reports, but right now I'm looking for hints of a slowdown in industrial production.
On Tuesday, the May Case-Shiller house price index will be released at 9:00 AM. The consensus is for a slight increase in the house price index. At 10:00 AM, the Conference Board will release Consumer Confidence for July (consensus is for a slight decrease from June). Also at 10:00 AM, the Richmond Fed Manufacturing Survey for July will be released.
Also at 10 AM Tuesday, the Census Bureau will release the Q2 Housing Vacancies and Homeownership report. This report provides the homeownership rate and estimates of the homeowner and rental vacancy rates.
On Wednesday, the MBA mortgage purchase index will be released. The purchase index is at the same level as in 1996 – suggesting further weakness in housing. Also on Wednesday, the June Durable Goods Orders will be released at 8:30 AM. The consensus is for a 1.0% increase.
Also on Wednesday, at 2 PM ET, the Fed will release the Beige Book for July. This will be closely scrutinized for further evidence of a 2nd half slowdown.
On Thursday, the initial weekly unemployment claims will be released. Consensus is for a decline to 460 thousand from 464 thousand last week. Also on Thursday, the Kansas City Fed Manufacturing survey will be released at 11 AM.
And on Friday, at 8:30 AM, the BEA will release the Q2 GDP report. The consensus is for real annualized GDP growth of 2.5% in Q2, down from a sluggish 2.7% in Q1. Also on Friday, the Chicago Purchasing Manager index for July will be released at 9:45 AM. And the FDIC will probably be busy on Friday afternoon ...
And a summary of last week:
 Click on graph for larger image in new window.
This graph shows existing home sales, on a Seasonally Adjusted Annual Rate (SAAR) basis since 1993.
Sales in June 2010 (5.37 million SAAR) were 5.1% lower than last month, and were 9.8% higher than June 2009 (4.89 million SAAR).
 The second graph shows nationwide inventory for existing homes.
According to the NAR, inventory increased to 3.99 million in June from 3.89 million in May. The all time record high was 4.58 million homes for sale in July 2008.
Months of supply increased to 8.9 months in June from 8.3 months in May. A normal market has under 6 months of supply, so this is already high - and probably excludes some substantial shadow inventory.
The next graph shows the year-over-year (YoY) change in reported existing home inventory and months-of-supply. Inventory is not seasonally adjusted, so it really helps to look at the YoY change.
 Inventory increased 4.7% YoY in June. This is the third consecutive month of a year-over-year increases in inventory, and this is the largest YoY increase since early 2008.
 This increase in inventory is especially bad news because the reported inventory is already historically very high, and the 8.9 months of supply in June is well above normal.
The months-of-supply will jump in July as sales collapse - probably to double digits - and a double digit months-of-supply would be a really bad sign for house prices ...
This was another a weak report. Sales were slightly above expectations (5.37 million at a seasonally adjusted annual rate vs. expectations of 5.3 million), but the YoY increase in inventory and the increase in months-of-supply are the real stories.
 Total housing starts were at 549 thousand (SAAR) in June, down 5% from the revised May rate of 578,000 (revised down from 593 thousand), and up 15% from the all time record low in April 2009 of 477 thousand (the lowest level since the Census Bureau began tracking housing starts in 1959).
 Single-family starts declined 0.7% to 454,000 in June. This is 26% above the record low in January 2009 (360 thousand).
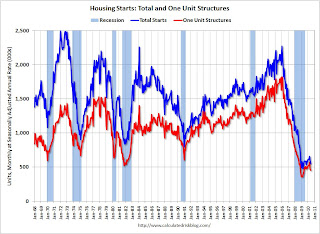 This graph shows total and single unit starts since 1968. This shows the huge collapse following the housing bubble, and that housing starts have mostly been moving sideways for over a year.
This was way below expectations of 580 thousand (I took the under!), and is good news for the housing market longer term (there are already too many housing units), but bad news for the economy and employment short term.
 This graph shows the builder confidence index from the National Association of Home Builders (NAHB).
The housing market index (HMI) was at 14 in June. This is the lowest level since April 2009.
The record low was 8 set in January 2009, but 14 is very low ...
Note: any number under 50 indicates that more builders view sales conditions as poor than good.
Note: This index is a leading indicator for new Commercial Real Estate (CRE) investment.
 This graph shows the Architecture Billings Index since 1996. The index has remained below 50, indicating falling demand, since January 2008.
Note: Nonresidential construction includes commercial and industrial facilities like hotels and office buildings, as well as schools, hospitals and other institutions.
This suggests the slump for commercial real estate design is ongoing. According to the AIA, there is an "approximate nine to twelve month lag time between architecture billings and construction spending" on non-residential construction. So there will probably be further declines in CRE investment into 2011.
Best wishes to all.
Sunday, July 18, 2010
Weekly Summary and a Look Ahead
by Calculated Risk on 7/18/2010 11:29:00 AM
Three housing related reports will be released this week: the NAHB builder confidence survey on Monday, housing starts on Tuesday, and existing home sales on Thursday. Fed Chairman Bernanke will report to the Senate and House on Wednesday and Thursday, and on Friday, the European bank stress test results will be released.
Here is the daily schedule:
On Monday, the July NAHB homebuilder survey will be released at 10 AM. The consensus is for another low reading at about the same level as June (17).
On Tuesday, Housing Starts for June will be released at 8:30 AM. The consensus is for a decrease to 580K (SAAR) in June from 593K in May. Based on builder comments, I'll take the under again this month.
Also on Tuesday, the BLS will release the Regional and State Employment and Unemployment report for June at 10 AM.
On Wednesday, the AIA's Architecture Billings Index for June will be released (a leading indicator for commercial real estate). Also on Wednesday, the MBA will release the mortgage purchase applications index. This has fallen to the lowest level in over 13 years suggesting weak home sales will be reported in July and later this year.
On Wednesday, starting at 10 AM ET, Fed Chairman Ben Bernanke will report to the Senate Banking Committee: The Semiannual Monetary Policy Report to the Congress
Possibly on Wedneday, the Moodys/REAL Commercial Property Price Index (for May) will also be released.
On Thursday, the initial weekly unemployment claims report will be released. Consensus is for an increase to 450K from 429K last week.
Also on Thursday, the National Association for Realtors (NAR) will release the June existing home sales report. The consensus is for a decline to 5.3 million sales in June (SAAR, seasonally adjusted annual rate), from 5.66 million in May. A key number in the release will be existing home inventory. Inventory has increased year-over-year for the last two months, and this suggests that the months-of-supply will be in double digits later this summer.
Also on Thursday, starting at 9:30 AM ET, Fed Chairman Ben Bernanke will report to the House Financial Services Committee: Monetary Policy and the State of the Economy. The report will be the same as for the Senate, but the Q&A might be interesting.
Also on Thursday, the FHFA house price index, and the Conference Board's index of leading indicators will be released.
On Friday, the Committee of European Banking Supervisors (CEBS) will release the stress test results for 91 European Banks. And the FDIC will probably be busy too ...
And a summary of last week:
On a monthly basis, retail sales decreased 0.5% from May to June (seasonally adjusted, after revisions), and sales were up 4.8% from June 2009.
 Click on graph for larger image in new window.
This graph shows retail sales since 1992.
This is monthly retail sales, seasonally adjusted (total and ex-gasoline).
Retail sales are up 7.3% from the bottom, but still off 5.2% from the pre-recession peak. Retail sales have declined for two consecutive months. This was another weak report, and the decline in sales was worse than expected.
The Census Bureau reports:
[T]otal May exports of $152.3 billion and imports of $194.5 billion resulted in a goods and services deficit of $42.3 billion, up from $40.3 billion in April, revised.
 This graph shows the U.S. trade deficit, with and without petroleum, through May.
With oil prices and volumes down, oil imports decreased sharply in May, however other imports - especially from China - increased significantly. Most of the increase in the trade deficit since last year has been related to oil, but now it appears the ex-oil deficit is increasing sharply again.
Note: the lower than expected retail sales, and higher than expected trade deficit, have lead to several key analysts downgrading Q2 real GDP growth to around 2% annualized.
 From the Association of American Railroads: Rail Time Indicators. The AAR reports traffic in June 2010 was up 10.6% compared to June 2009 - but traffic was still 10.2% lower than in June 2008.
This graph shows U.S. average weekly rail carloads.
From AAR:
On a seasonally adjusted basis, U.S. rail carloads fell 1.3% in June 2010 from May 2010, following a 1.1% decline in May 2010 from April 2010. After bottoming out in May 2009, seasonally adjusted rail carloads trended upward, with some fits and starts along the way, through April 2010. They’ve now declined for two consecutive months. ... an economy several months into a recovery from the worst recession in decades should be yielding rail traffic levels heading north, not south.
 This graph shows the national LoanPerformance data since 1976. January 2000 = 100.
The index is up 2.9% over the last year, and off 28.5% from the peak.
CoreLogic expects prices to "moderate and possibly decline". I think this index will show a further price increase in June, as tax credit related existing home sales close. But I expect the index will show declines by the end of summer and into the fall.
 The Fed reported:
Industrial production edged up 0.1 percent in June ... capacity utilization rate for total industry remained unchanged in June at 74.1 percent, a rate 5.9 percentage points above the rate from a year earlier but 6.5 percentage points below its average from 1972 to 2009.This graph shows Capacity Utilization. This series is up 8.7% from the record low set in June 2009 (the series starts in 1967).
Capacity utilization at 74.1% is still far below normal - and well below the the pre-recession levels of 81.2% in November 2007.
 From Reuters: Consumer Sentiment Sinks To Lowest in 11 Months
 The survey's preliminary July reading on the overall index on consumer sentiment plummeted to 66.5 from 76.0 in June.Consumer sentiment is a coincident indicator - and this is further evidence of an economic slowdown.
Best wishes to all.
Sunday, July 11, 2010
Weekly Summary and a Look Ahead
by Calculated Risk on 7/11/2010 12:49:00 PM
First, more on sovereign debt issues this morning: Part 2B: More on Historic Sovereign Default Research
This will be a busy week. The key economic report this week will be June retail sales to be released on Wednesday.
On Monday, the June Ceridian-UCLA Pulse of Commerce Index (based on diesel fuel consumption) will be released. Also on Monday at 10 AM ET, Fed Chairman Ben Bernanke will open the Fed’s small business forum: Addressing the Financing Needs of Small Businesses.
On Tuesday, the National Association of Independent Business (NFIB) will release the small business optimism survey for June at 7:30 AM. The May Trade Balance report will be released at 8:30 AM by the Census Bureau. The consensus is for a slight decrease in the U.S. trade deficit to $39 billion (from $40.3 billion). Also on Tuesday the Job Openings and Labor Turnover Survey (JOLTS) for May will be released at 10 AM by the BLS. This report has been showing very little turnover in the labor market.
On Wednesday, the June Advance Monthly Retail Trade Report will be released by the Census Bureau at 8:30 AM. The consensus is for a 0.2% decline in retail sales (flat ex-autos). Also on Wednesday, the MBA will release the mortgage purchase applications index. This has been very weak after the expiration of the tax credit, although refinance activity has picked up significantly as mortgage rates have fallen.
Also on Wednesday, the May Manufacturing and Trade Inventories and Sales report from the Census Bureau will be released at 10 AM. This has been suggesting that the inventory adjustment is mostly over. At 2 PM the Fed will release the minutes of the June 23rd FOMC meeting.
On Thursday, the initial weekly unemployment claims will be released. Consensus is for a decline to 445K from 454K last week. The Producer Price index will be released at 8:30 AM. Consensus is for a slight increase in the PPI. The July Empire State manufacturing survey will also be released at 8:30 AM. The consensus is for a slight decrease from the June reading.
Also on Thursday the Federal Reserve will release the June Industrial Production and Capacity Utilization report at 9:15 AM. Expectations are for production to decrease slightly and capacity utilization to fall to 74.0% from 74.7% in May. If so, this will be the first decline since June 2009. The Philly Fed Business Outlook Survey for July will be released at 10 AM, and the consensus is for a slight increase.
On Friday, the June Consumer Price Index will be released at 8:30 AM. Expectations are for a slight decrease of 0.1% in the CPI. At 9:55 AM the July Reuters / University of Michigan's Consumer sentiment index will be released. The consensus is for a slight decrease in the index.
Also this week, the June rail traffic report from the Association of American Railroads (AAR) and June LA port traffic will probably be released and the FDIC will probably be busy ...
Three posts on Sovereign debt:
And a summary of last week:
 Click on graph for larger image in new window.
The June ISM Non-manufacturing index was at 53.8%, down from 55.4% in May - and below expectations of 55. The employment index showed contraction in June at 49.7%.
This graph shows the ISM non-manufacturing index (started in January 2008) and the ISM non-manufacturing employment diffusion index.
The employment index is showing contraction again after one month of expansion.
 This graph shows the 4-week moving average of weekly claims since January 2000.
The four-week average of weekly unemployment claims decreased this week by 1,250 to 466,000.
The dashed line on the graph is the current 4-week average.
Initial weekly claims have been at about the same level since December 2009.
 The MBA reports: The seasonally adjusted Purchase Index decreased 2.0 percent from one week earlier.
 "The Purchase Index has decreased eight of the last nine weeks."
This graph shows the MBA Purchase Index and four week moving average since 1990.
There has been a mini-refi boom because of the low mortgage rates, but the purchase index has fallen sharply to the levels of 1996.
Best wishes to all.
Sunday, July 04, 2010
Weekly Summary and a Look Ahead
by Calculated Risk on 7/04/2010 11:45:00 AM
This will be a light week for US economic data. The US stock markets will be closed on Monday to observe Independence Day.
Sometime this week, Reis will release the Q2 mall, office and apartment vacancy rates. In Q1, Reis reported the strip mall vacancy rate hit 10.8% (highest since 1991), the apartment vacancy rate was at a record 8% (large cities only), and the office vacancy rate rose to rose to 17.2% (highest since the early '90s).
On Tuesday, the June ISM non-manufacturing report will be released. Consensus is for a decrease to 55.0 from 55.4 in the service sector.
On Wednesday, the MBA will release the mortgage purchase applications index. This has been falling sharply after the expiration of the home buyer tax credit. Also on Wednesday, Minneapolis Fed President Narayan Kocherlakota will speak at the Université de Montréal at 3:30 PM ET (Society for Economic Dynamics).
On Thursday, the initial weekly unemployment claims will be released. Consensus is for a decline to 465K from 472K last week. Also on Thursday, the Fed will release Consumer Credit for May at 3 PM ET. Consumer credit has declined sharply since mid-2008, especially revolving debt (credit cards).
Also on Thursday, at 6 PM ET, Professor Robert Hall, the current Chairman of NBER, will speak at the Society for Economic Dynamics: “Reconsidering the Basic Tenets of Macroeconomics in the Light of the Past Two Years”. He might be asked about the possibility of a “double dip” recession.
On Friday the Census Bureau will release Wholesale Inventories for May, and the FDIC will probably get back to work ...
A couple of posts on the 2nd half:
And a summary of last week:
1) Total nonfarm payroll employment declined by 125,000 in June
2) Census 2010 hiring decreased 225,000 in June.
3) So non-farm payroll employment increased 100,000 in June ex-Census. Private-sector payroll employment increased by 83,000.
4) The unemployment rate declined down to 9.5 percent as the participation rate fell (workers leaving the workforce pushed down the unemployment rate).
5) Average hourly wages and average hours worked decreased.
Overall this was a weak report. Here are a few graphs ...
Percent Job Losses During Recessions, aligned at Bottom
 Click on graph for larger image.
This graph shows the job losses from the start of the employment recession, in percentage terms - aligned at the bottom of the recession.
The dotted line shows the impact of Census hiring. In June, there were 339,000 temporary 2010 Census workers on the payroll. The number of Census workers will continue to decline - and the gap between the solid and dashed red lines will be mostly closed in three or four months.
Employment-Population Ratio
The Employment-Population ratio decreased to 58.5% in June from 58.7% in May. This had been increasing after plunging since the start of the recession, and the recovery in the Employment-Population ratio was considered a good sign - but the ratio has now decreased for two consecutive months.
 This graph shows the employment-population ratio; this is the ratio of employed Americans to the adult population.
Note: the graph doesn't start at zero to better show the change.
Also the Labor Force Participation Rate decreased to 64.7% in June from 65.0% in May. This is the percentage of the working age population in the labor force. This decline is very disappointing, and the rate is well below the 66% to 67% rate that was normal over the last 20 years.
The reason the unemployment rate declined was because people left the workforce - and that is not good news. As the employment picture improves, people will return to the labor force, and that will put upward pressure on the unemployment rate.
Part Time for Economic Reasons
 The number of workers only able to find part time jobs (or have had their hours cut for economic reasons) was at 8.63 million in June. This was a slight decline from May - and was a little bit of good news.
The all time record of 9.24 million was set in October.
These workers are included in the alternate measure of labor underutilization (U-6) that was at 16.5% in June.
Unemployed over 26 Weeks
 The blue line is the number of workers unemployed for 27 weeks or more. The red line is the same data as a percent of the civilian workforce.
According to the BLS, there are 6.751 million workers who have been unemployed for more than 26 weeks and still want a job. This is a record 4.39% of the civilian workforce. (note: records started in 1948). It does appear the increases are slowing ...
 Based on an estimate from Autodata Corp, light vehicle sales were at a 11.08 million SAAR in June. That is up 14% from June 2009 (when sales were very low), and down 4.6% from the May sales rate.
This graph shows the historical light vehicle sales (seasonally adjusted annual rate) from the BEA (blue) and an estimate for June (red, light vehicle sales of 11.08 million SAAR from Autodata Corp).
This was below most forecasts of around 11.4 million SAAR.
S&P/Case-Shiller released the monthly Home Price Indices for April (actually a 3 month average).
 This graph shows the nominal not seasonally adjusted Composite 10 and Composite 20 indices (the Composite 20 was started in January 2000).
The Composite 10 index is off 29.7% from the peak, and up 0.3% in April (SA).
The Composite 20 index is off 29.0% from the peak, and up 0.4% in April (SA).
The next graph shows the price declines from the peak for each city included in S&P/Case-Shiller indices.
 Prices increased (SA) in 17 of the 20 Case-Shiller cities in April (SA).
 Prices in Las Vegas are off 55.9% from the peak, and prices in Dallas only off 5.2% from the peak.
Case Shiller is reporting on the NSA data (18 cities up), and I'm using the SA data. As S&P noted, there probably was a small boost to prices from tax credit related buying, but prices will probably fall later this year.
From the BEA: Personal Income and Outlays, April 2010
The following graph shows real Personal Consumption Expenditures (PCE) through May (2005 dollars). Note that the y-axis doesn't start at zero to better show the change.
 The quarterly change in PCE is based on the change from the average in one quarter, compared to the average of the preceding quarter.
Even with no growth in June, PCE growth in Q2 would be 2.5%. Even with the weak June data, it looks like my earlier estimate of 3% PCE growth in Q2 will be about right (maybe a little high).
Best wishes to all.


