 RSS Feed
 by Calculated Risk on 7/25/2010 11:29:00 AM
Sunday, July 25, 2010
Weekly Summary and Schedule, July 25th
The focus this week will be on the Q2 GDP report to be released on Friday. There are also two key housing reports: New Home Sales on Monday and Case-Shiller house prices on Tuesday.
On Monday, the June Chicago Fed National Activity Index will be released at 8:30 AM. This is a composite index of other data.
At 10 AM on Monday, the Census Bureau will release the New Home Sales report for June. The consensus is for a slight increase to 310 thousand at a seasonally adjusted annual rate (SAAR) from the record low 300 thousand in May.
Also on Monday, the Dallas Fed Manufacturing survey for July will be released at 10:30 AM. This is one of several regional surveys that will be released this week. Usually I don't highlight the minor regional reports, but right now I'm looking for hints of a slowdown in industrial production.
On Tuesday, the May Case-Shiller house price index will be released at 9:00 AM. The consensus is for a slight increase in the house price index. At 10:00 AM, the Conference Board will release Consumer Confidence for July (consensus is for a slight decrease from June). Also at 10:00 AM, the Richmond Fed Manufacturing Survey for July will be released.
Also at 10 AM Tuesday, the Census Bureau will release the Q2 Housing Vacancies and Homeownership report. This report provides the homeownership rate and estimates of the homeowner and rental vacancy rates.
On Wednesday, the MBA mortgage purchase index will be released. The purchase index is at the same level as in 1996 – suggesting further weakness in housing. Also on Wednesday, the June Durable Goods Orders will be released at 8:30 AM. The consensus is for a 1.0% increase.
Also on Wednesday, at 2 PM ET, the Fed will release the Beige Book for July. This will be closely scrutinized for further evidence of a 2nd half slowdown.
On Thursday, the initial weekly unemployment claims will be released. Consensus is for a decline to 460 thousand from 464 thousand last week. Also on Thursday, the Kansas City Fed Manufacturing survey will be released at 11 AM.
And on Friday, at 8:30 AM, the BEA will release the Q2 GDP report. The consensus is for real annualized GDP growth of 2.5% in Q2, down from a sluggish 2.7% in Q1. Also on Friday, the Chicago Purchasing Manager index for July will be released at 9:45 AM. And the FDIC will probably be busy on Friday afternoon ...
And a summary of last week:
 Click on graph for larger image in new window.
This graph shows existing home sales, on a Seasonally Adjusted Annual Rate (SAAR) basis since 1993.
Sales in June 2010 (5.37 million SAAR) were 5.1% lower than last month, and were 9.8% higher than June 2009 (4.89 million SAAR).
 The second graph shows nationwide inventory for existing homes.
According to the NAR, inventory increased to 3.99 million in June from 3.89 million in May. The all time record high was 4.58 million homes for sale in July 2008.
Months of supply increased to 8.9 months in June from 8.3 months in May. A normal market has under 6 months of supply, so this is already high - and probably excludes some substantial shadow inventory.
The next graph shows the year-over-year (YoY) change in reported existing home inventory and months-of-supply. Inventory is not seasonally adjusted, so it really helps to look at the YoY change.
 Inventory increased 4.7% YoY in June. This is the third consecutive month of a year-over-year increases in inventory, and this is the largest YoY increase since early 2008.
 This increase in inventory is especially bad news because the reported inventory is already historically very high, and the 8.9 months of supply in June is well above normal.
The months-of-supply will jump in July as sales collapse - probably to double digits - and a double digit months-of-supply would be a really bad sign for house prices ...
This was another a weak report. Sales were slightly above expectations (5.37 million at a seasonally adjusted annual rate vs. expectations of 5.3 million), but the YoY increase in inventory and the increase in months-of-supply are the real stories.
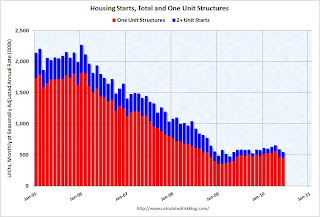 Total housing starts were at 549 thousand (SAAR) in June, down 5% from the revised May rate of 578,000 (revised down from 593 thousand), and up 15% from the all time record low in April 2009 of 477 thousand (the lowest level since the Census Bureau began tracking housing starts in 1959).
 Single-family starts declined 0.7% to 454,000 in June. This is 26% above the record low in January 2009 (360 thousand).
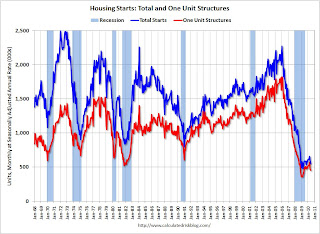 This graph shows total and single unit starts since 1968. This shows the huge collapse following the housing bubble, and that housing starts have mostly been moving sideways for over a year.
This was way below expectations of 580 thousand (I took the under!), and is good news for the housing market longer term (there are already too many housing units), but bad news for the economy and employment short term.
 This graph shows the builder confidence index from the National Association of Home Builders (NAHB).
The housing market index (HMI) was at 14 in June. This is the lowest level since April 2009.
The record low was 8 set in January 2009, but 14 is very low ...
Note: any number under 50 indicates that more builders view sales conditions as poor than good.
Note: This index is a leading indicator for new Commercial Real Estate (CRE) investment.
 This graph shows the Architecture Billings Index since 1996. The index has remained below 50, indicating falling demand, since January 2008.
Note: Nonresidential construction includes commercial and industrial facilities like hotels and office buildings, as well as schools, hospitals and other institutions.
This suggests the slump for commercial real estate design is ongoing. According to the AIA, there is an "approximate nine to twelve month lag time between architecture billings and construction spending" on non-residential construction. So there will probably be further declines in CRE investment into 2011.
Best wishes to all.


