 RSS Feed
 by Calculated Risk on 8/08/2010 10:55:00 AM
Sunday, August 08, 2010
Weekly Summary and Schedule, August 8th
The key economic report this week will be July retail sales to be released on Friday. The FOMC statement on Tuesday will also be closely watched.
Sometime this week the July rail traffic report, from the Association of American Railroads (AAR), and the July Ceridian-UCLA Pulse of Commerce Index (based on diesel fuel consumption) will probably both be released. Both showed transportation weakness in June.
On Tuesday, the National Association of Independent Business (NFIB) will release the small business optimism survey for July. Also on Tuesday, the BLS will release the Q2 Productivity and Costs report, and the Census Bureau will release the Monthly Wholesale Trade: Sales and Inventories for June.
The Federal Reserve’s Federal Open Market Committee (FOMC) will meet on Tuesday, and the FOMC statement will be released at around 2:15 PM ET. This will be closely scrutinized for a discussion of the economic slowdown since the last meeting on June 23rd – especially considering the two weak employment reports in the interim – and to see if the FOMC will slightly ease monetary policy. There has been some discussion that the Fed might announce they are reinvesting maturing mortgage backed securities (MBS) into either new MBS or Treasury securities.
Jon Hilsenrath discusses this possibility in the WSJ: Jobs Report Intensifies Fed Debate
A key item on the agenda is likely to be whether the Fed should tweak its strategy for managing its $1.1-trillion portfolio of mortgage backed securities so holdings don't shrink in the months ahead.On Wednesday, the MBA will release the mortgage purchase applications index. Also on Wednesday, the June Trade Balance report will be released at 8:30 AM by the Census Bureau. The consensus is for the U.S. trade deficit to increase slightly to $42.5 billion (from $42.3 billion in May). This might lead to further adjustments for Q2 GDP.
...
The divisive question for the Fed is what message they would be sending if they alter their reinvestment strategy. Fed officials are acutely aware that if they start reinvesting proceeds from maturing mortgage bonds -- as they now do for maturing Treasury debt -- many investors will think they are laying the groundwork for a more dramatic move of large scale purchases of new bonds ...
Also on Wednesday the Job Openings and Labor Turnover Survey (JOLTS) for June will be released at 10 AM by the BLS. This report has been showing very little turnover in the labor market and few job openings.
On Thursday, the initial weekly unemployment claims will be released. Consensus is for a decline to 460K from 479K last week.
On Friday, the Consumer Price Index for July will be released at 8:30 AM. This is expected to show a 0.2% increase in prices. Also on Friday July retail sales will be released at 8:30 AM. The consensus is for an increase of 0.5% from the June rate, and 0.2% increase ex-autos. Also the preliminary August Reuter's/University of Michigan's Consumer sentiment index will be released at 9:55 AM, and June Business inventories will be released at 10 AM.
And of course the FDIC will probably have another busy Friday afternoon ...
And a summary of last week:
Total nonfarm payroll declined by 131,000 in July.
The number of temporary decennial Census worker declined by 143,000.
So the total nonfarm ex-Census is -143,000 minus -131,000 = +12,0001.
1For an explanation, see: Employment Report: Why the different payroll numbers?
 Click on graph for larger image.
This graph shows the job losses from the start of the employment recession, in percentage terms.
The dotted line shows the impact of Census hiring. In July, there were 196,000 temporary 2010 Census workers on the payroll. The number of Census workers will continue to decline - and the gap between the solid and dashed red lines will be gone in a few months.
 This second graph shows the job losses from the start of the employment recession, in percentage terms again - this time aligned at the bottom of the recession (Both the 1991 and 2001 recessions were flat at the bottom, so the choice was a little arbitrary).
Longer. Deeper. And flat at the bottom. Unfortunately that describes the 2007 employment recession.
Employment-Population Ratio
The Employment-Population ratio decreased to 58.4% in July from 58.5% in June. This had been increasing after plunging since the start of the recession, and the recovery in the Employment-Population ratio was considered a good sign - but the ratio has now decreased for three consecutive months.
 This graph shows the employment-population ratio; this is the ratio of employed Americans to the adult population.
Note: the graph doesn't start at zero to better show the change.
The Labor Force Participation Rate decreased to 64.6% from 64.7% in June. This is the percentage of the working age population in the labor force. This decline is very disappointing, and the rate is well below the 66% to 67% rate that was normal over the last 20 years.
The reason the unemployment rate was steady at 9.5% was because people left the workforce - and that is not good news. As the employment picture improves, people will return to the labor force, and that will put upward pressure on the unemployment rate.
The underlying details of the employment report were mixed. The positives: a slight increase in hours worked and in hourly wages, and the slight decreases in part time workers (for economic reasons) and in the long term unemployed.
The negatives include the weak hiring of only 12,000 ex-Census, the declines in the participation rate and employment-population rate, and the significant downward revision to the June employment report.
Overall this was a weak report.
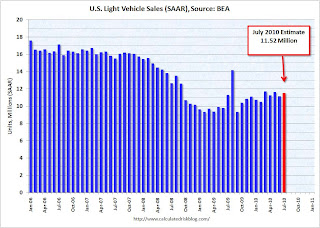 This graph shows the historical light vehicle sales (seasonally adjusted annual rate) from the BEA. The BEA reported that the sales rate was 11.52 million in July.
This was increase from June, but below most forecasts of around 11.6 to 11.8 million SAAR, and is below the levels of March and May earlier this year.
 Fannie Mae reported that their REO inventory more than doubled since Q2 2009, from 62,615 to 129,310 in Q2 2010. REO: Real Estate Owned.
 See page 11 of the 2010 Second Quarter Credit Supplement (ht jb)
This graph shows the rapid increase in REO. Freddie Mac and the FHA together have about the same number of REOs as Fannie Mae. When that data is released, I'll put up a chart of all three. Also this does not include REO held by other lenders and private-label RMBS.
From the American Bankruptcy Institute: July Consumer Bankruptcy Filings up 9 Percent from last Month, Year
The 137,698 consumer bankruptcies filed in July represented a 9 percent increase nationwide over the 126,434 filings recorded in July 2009 ... “Debt burdens, unemployment and an uncertain economic climate continue to weigh on consumers,” said ABI Executive Director Samuel J. Gerdano. “The pace of consumer filings this year remains on track to top 1.6 million filings.”
 This graph shows the non-business bankruptcy filings by quarter using monthly data from the ABI and previous quarterly data from USCourts.gov.
Excluding 2005, when the so-called "Bankruptcy Abuse Prevention and Consumer Protection Act of 2005" was enacted (really a pro-lender act), the record year was in 2003 when 1.62 million personal bankruptcies were filed. This year will be close to that level.
 Overall construction spending increased slightly in June, and private construction spending, both residential and non-residential, decreased in June.
This graph shows private residential and nonresidential construction spending since 1993. Note: nominal dollars, not inflation adjusted.
I expect that private residential construction spending will decline sharply in July since builders rushed to complete homes in June (because of the tax credit).
Best wishes to all.


