 RSS Feed
 by Calculated Risk on 2/11/2011 08:30:00 AM
Showing posts with label Trade Deficit. Show all posts
Showing posts with label Trade Deficit. Show all posts
Friday, February 11, 2011
Trade Deficit increased in December
The Department of Commerce reports:
[T]otal December exports of $163.0 billion and imports of $203.5 billion resulted in a goods and services deficit of $40.6 billion, up from $38.3 billion in November, revised. December exports were $2.8 billion more than November exports of $160.1 billion. December imports were $5.1 billion more than November imports of $198.5 billion.
 Click on graph for larger image.
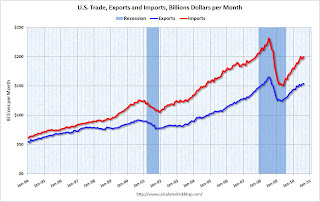
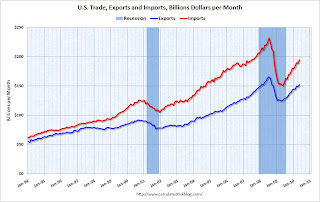
The first graph shows the monthly U.S. exports and imports in dollars through December 2010.
Imports had been mostly flat since May, but increased again in December. Exports have started increasing again after the mid-year slowdown.
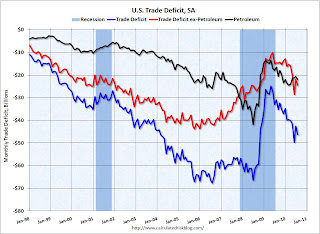
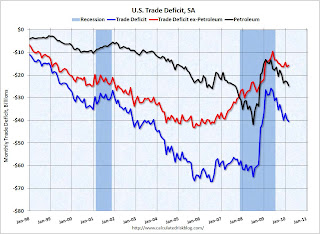
The second graph shows the U.S. trade deficit, with and without petroleum, through December.
 The blue line is the total deficit, and the black line is the petroleum deficit, and the red line is the trade deficit ex-petroleum products.
The petroleum deficit increased in December as both quantity and import prices continued to rise - averaging $79.78 in December. Prices will be even higher in January. Once again oil and China deficits are essentially the entire trade deficit (or even more).
Thursday, January 13, 2011
Trade Deficit declined slightly in November
by Calculated Risk on 1/13/2011 09:13:00 AM
The Department of Commerce reports:
[T]otal November exports of $159.6 billion and imports of $198.0 billion resulted in a goods and services deficit of $38.3 billion, down from $38.4 billion in October, revised. November exports were $1.2 billion more than October exports of $158.4 billion. November imports were $1.1 billion more than October imports of $196.8 billion.
 Click on graph for larger image.
The first graph shows the monthly U.S. exports and imports in dollars through November 2010.
Imports have been mostly flat since May, and exports have started increasing again after the mid-year slowdown.
The second graph shows the U.S. trade deficit, with and without petroleum, through November.
 The blue line is the total deficit, and the black line is the petroleum deficit, and the red line is the trade deficit ex-petroleum products.
The petroleum deficit increased in November as import prices continued to rise - averaging $76.81 in November. Prices will be even higher in December. The deficit with China increased to $25.634 billion from $25,517 in October. Once again oil and China deficits are essentially the entire trade deficit (or even more).
Friday, December 17, 2010
LA Port Traffic in November: Exports Increase
by Calculated Risk on 12/17/2010 10:17:00 PM
Notes: this data is not seasonally adjusted. LA area ports handle about 40% of the nation's container port traffic.
The following graph shows the loaded inbound and outbound traffic at the ports of Los Angeles and Long Beach in TEUs (TEUs: 20-foot equivalent units or 20-foot-long cargo container). Although containers tell us nothing about value, container traffic does give us an idea of the volume of goods being exported and imported - and possible hints about the trade report for November.
 Click on graph for larger image in new window.
There is a strong seasonal pattern for loaded inbound traffic, and traffic was up about 15% compared to November 2009.
After stalling out over the summer, loaded outbound traffic is up sharply over the last two months, and was up 19% YoY from November 2009.
This suggests that the trade deficit with China (and other Asian countries) might have declined somewhat in November (seasonally adjusted).
Friday, December 10, 2010
Trade Deficit decreases in October
by Calculated Risk on 12/10/2010 08:30:00 AM
The Census Bureau reports:
[T]otal October exports of $158.7 billion and imports of $197.4 billion resulted in a goods and services deficit of $38.7 billion, down from $44.6 billion in September, revised. October exports were $4.9 billion more than
September exports of $153.8 billion. October imports were $0.9 billion less than September imports of $198.4 billion.
 Click on graph for larger image.
The first graph shows the monthly U.S. exports and imports in dollars through October 2010.
After trade bottomed in the first half of 2009, imports increased much faster than exports. October exports were $4.9 billion more than in September and are at the highest level since August 2008.
The second graph shows the U.S. trade deficit, with and without petroleum, through October.
 The blue line is the total deficit, and the black line is the petroleum deficit, and the red line is the trade deficit ex-petroleum products.
The petroleum deficit decreased slightly in September - even with higher prices - and the trade deficit with China decreased (NSA).
After stalling over the summer, it appears exports are growing again. I expect the dollar volume of oil imports to rise over the next couple of months since oil prices have increased sharply since October.
Monday, November 15, 2010
LA Port Traffic in October: Exports increase
by Calculated Risk on 11/15/2010 07:40:00 PM
Notes: this data is not seasonally adjusted. There is a very distinct seasonal pattern for imports, but not for exports. LA area ports handle about 40% of the nation's container port traffic.
The following graph shows the loaded inbound and outbound traffic at the ports of Los Angeles and Long Beach in TEUs (TEUs: 20-foot equivalent units or 20-foot-long cargo container). Although containers tell us nothing about value, container traffic does give us an idea of the volume of goods being exported and imported.
 Click on graph for larger image in new window.
Loaded inbound traffic was up 15% compared to October 2009.
Loaded outbound traffic was up 12% from October 2009.
For imports, there is a clear seasonal pattern and frequently a double peak - first in late summer, and then in October as retailers build inventory for the holiday season - so this was an unusual decrease in October compared to September.
For exports there is no clear seasonal pattern, and exports increased to just above the level in May. This suggests that the trade deficit with China (and other Asian countries) might have declined slightly in October (seasonally adjusted).
Wednesday, November 10, 2010
Trade Deficit decreases in September
by Calculated Risk on 11/10/2010 09:20:00 AM
The Census Bureau reports:
[T]otal September exports of $154.1 billion and imports of $198.1 billion resulted in a goods and services deficit of $44.0 billion, down from $46.5 billion in August, revised.
 Click on graph for larger image.
The first graph shows the monthly U.S. exports and imports in dollars through September 2010.
After trade bottomed in the first half of 2009, imports increased much faster than exports. Over the last five months, both exports and imports have been relatively flat.
The second graph shows the U.S. trade deficit, with and without petroleum, through September.
 The blue line is the total deficit, and the black line is the petroleum deficit, and the red line is the trade deficit ex-petroleum products.
The petroleum deficit decreased slightly in September, and the trade deficit with China decreased slightly (NSA).
The trade deficit will probably increase in October since oil prices increased, and China reported a higher trade surplus for October.
Thursday, October 14, 2010
Trade Deficit increases sharply in August
by Calculated Risk on 10/14/2010 09:10:00 AM
The Census Bureau reports:
[T]otal August exports of $153.9 billion and imports of $200.2 billion resulted in a goods and services deficit of $46.3 billion, up from $42.6 billion in July, revised.
 Click on graph for larger image.
The first graph shows the monthly U.S. exports and imports in dollars through August 2010.
After trade bottomed in the first half of 2009, both imports and exports increased significantly. However in 2010 export growth has slowed, and imports have been increasing much faster than exports.
The second graph shows the U.S. trade deficit, with and without petroleum, through August.
 The blue line is the total deficit, and the black line is the petroleum deficit, and the red line is the trade deficit ex-petroleum products.
The increase in the deficit in August was due to both oil and China, although the bulk of the increase was because of trade with China. The trade deficit with China increased to $28.0 billion in August from $25.9 billion in July (NSA).
The imbalances have returned ...
Tuesday, September 14, 2010
LA Port Traffic in August: Imports Surge, Exports down year-over-year
by Calculated Risk on 9/14/2010 09:28:00 PM
Notes: this data is not seasonally adjusted. There is a very distinct seasonal pattern for imports, but not for exports. LA area ports handle about 40% of the nation's container port traffic.
The following graph shows the loaded inbound and outbound traffic at the ports of Los Angeles and Long Beach in TEUs (TEUs: 20-foot equivalent units or 20-foot-long cargo container). Although containers tell us nothing about value, container traffic does give us an idea of the volume of goods being exported and imported. Click on graph for larger image in new window.
Loaded inbound traffic was up 24% compared to August 2009. Inbound traffic is now up 4% vs. two years ago (August '08).
Loaded outbound traffic was down 2.6% from August 2009. Unlike imports, exports are still off from 2 years ago (off 17%).
For imports there is usually a significant dip in either February or March, depending on the timing of the Chinese New Year, and then usually imports increase until late summer or early fall as retailers build inventory for the holiday season. So part of this increase in August imports is just the normal seasonal pattern.
Based on this data, it appears the trade deficit with Asia increased again in August. Not only have the pre-crisis global imbalances returned, but exports appear to have peaked in May (no clear seasonal pattern), and have moved sideways or down over the last 6 months.
Thursday, September 09, 2010
Trade Deficit declines in July
by Calculated Risk on 9/09/2010 09:11:00 AM
The Census Bureau reports:
[T]otal July exports of $153.3 billion and imports of $196.1 billion resulted in a goods and services deficit of $42.8 billion, down from $49.8 billion in June, revised.
 Click on graph for larger image.
The first graph shows the monthly U.S. exports and imports in dollars through June 2010.
Although imports declined in July, imports have been increasing much faster than exports.
The second graph shows the U.S. trade deficit, with and without petroleum, through July.
 The blue line is the total deficit, and the black line is the petroleum deficit, and the red line is the trade deficit ex-petroleum products.
The decrease in the deficit in July was across the board, although the oil deficit only declined slightly. And the trade gap with China declined slightly to $25.92 billion from $26.15 billion in June - essentially unchanged.
This is the 2nd largest monthly trade deficit since the 2008 collapse in trade.
Friday, August 13, 2010
Port traffic may slow as retailers turn cautious
by Calculated Risk on 8/13/2010 09:53:00 PM
This is a followup to my earlier post today on LA port traffic in July ...
From Ronald White at the LA Times: Ports wary of stunted holiday rush
The bad news for the ports of Los Angeles and Long Beach — part of a supply-chain infrastructure that employs dockworkers, truck drivers, railroad employees, warehouse and distribution center staffs and logistics experts — the big bump in holiday-season cargo jobs may not come this year.This is something to watch over the next few months. Exports have already slowed, and it is possible that import growth will slow too.
Consumers remain very cautious about the safety of their own jobs, and retailers are paying attention to those signals, experts said.
"Retailers are monitoring demand very closely and hoping to see increases in employment and other areas that will boost consumer confidence," said Jonathan Gold, vice president for supply chain and customs policy for the National Retail Federation.
LA Port Traffic: Imports increase, Exports Flat
by Calculated Risk on 8/13/2010 05:21:00 PM
This data last month gave the first hint of the sharp increase in the U.S. trade deficit in June.
Notes: this data is not seasonally adjusted. There is a very distinct seasonal pattern for imports, but not for exports. LA area ports handle about 40% of the nation's container port traffic.
The following graph shows the loaded inbound and outbound traffic at the ports of Los Angeles and Long Beach in TEUs (TEUs: 20-foot equivalent units or 20-foot-long cargo container). Although containers tell us nothing about value, container traffic does give us an idea of the volume of goods being exported and imported. Click on graph for larger image in new window.
Loaded inbound traffic was up 26% compared to July 2009. Inbound traffic is now up 4% vs. two years ago (July '08).
Loaded outbound traffic was up 10% from July 2009. Exports were off almost 4% from May 2010. Unlike imports, exports are still off from 2 years ago (off 17%).
For imports there is usually a significant dip in either February or March, depending on the timing of the Chinese New Year, and then usually imports increase until late summer or early fall as retailers build inventory for the holiday season. So part of this increase in July imports is just the normal seasonal pattern.
Based on this data, it appears the trade deficit with Asia increased again in July. Not only have the pre-crisis global imbalances returned, but the flat line in exports, after declining in June, is concerning (there is no clear seasonal pattern for exports).
Wednesday, August 11, 2010
Trade Deficit increases sharply in June
by Calculated Risk on 8/11/2010 08:30:00 AM
The Census Bureau reports:
[T]otal June exports of $150.5 billion and imports of $200.3 billion resulted in a goods and services deficit of $49.9 billion, up from $42.0 billion in May, revised.
 Click on graph for larger image.
The first graph shows the monthly U.S. exports and imports in dollars through June 2010.
Clearly imports are increasing much faster than exports. On a year-over-year basis, exports are up 17% and imports are up 29%. This is an easy comparison because of the collapse in trade at the end of 2008 and into early 2009.
The second graph shows the U.S. trade deficit, with and without petroleum, through June.
 The blue line is the total deficit, and the black line is the petroleum deficit, and the red line is the trade deficit ex-petroleum products.
The increase in the deficit in June was unrelated to oil as the trade gap with China increased to $26.15 billion in June - the highest level since October 2008 and up sharply from last year. Once again the imbalances have returned ...
Wednesday, July 14, 2010
LA Port Traffic: Imports Surge, Exports Decline
by Calculated Risk on 7/14/2010 03:38:00 PM
Notes: this data is not seasonally adjusted. There is a very distinct seasonal pattern for imports, but not for exports. LA area ports handle about 40% of the nation's container port traffic.
Sometimes port traffic gives us an early hint of changes in the trade deficit. The following graph shows the loaded inbound and outbound traffic at the ports of Los Angeles and Long Beach in TEUs (TEUs: 20-foot equivalent units or 20-foot-long cargo container). Although containers tell us nothing about value, container traffic does give us an idea of the volume of goods being exported and imported. Click on graph for larger image in new window.
Loaded inbound traffic was up 30.0% compared to June 2009. Inbound traffic is now up 1% vs. two years ago (June '08).
Loaded outbound traffic was up 7.7% from June 2009. Exports were off almost 4% from May 2010. Unlike imports, exports are still off from 2 years ago (off 13%).
For imports there is usually a significant dip in either February or March, depending on the timing of the Chinese New Year, and then usually imports increase until late summer or early fall as retailers build inventory for the holiday season. So part of this increase in June imports is just the normal seasonal pattern.
Based on this data, it appears the trade deficit with Asia increased again in June. Not only have the pre-crisis global imbalances returned, but the decline in exports from May is concerning (there is no clear seasonal pattern for exports).
Tuesday, July 13, 2010
Trade Deficit increases in May
by Calculated Risk on 7/13/2010 08:56:00 AM
The Census Bureau reports:
[T]otal May exports of $152.3 billion and imports of $194.5 billion resulted in a goods and services deficit of $42.3 billion, up from $40.3 billion in April, revised. May exports were $3.5 billion more than April exports of $148.7 billion. [May] imports were $5.5 billion more than April imports of $189.0 billion.
 Click on graph for larger image.
The first graph shows the monthly U.S. exports and imports in dollars through May 2010.
Clearly imports are increasing much faster than exports. On a year-over-year basis, exports are up 21% and imports are up 29%. This is an easy comparison because of the collapse in trade at the end of 2008 and into early 2009.
The second graph shows the U.S. trade deficit, with and without petroleum, through May.
 The blue line is the total deficit, and the black line is the petroleum deficit, and the red line is the trade deficit ex-petroleum products.
Import oil prices decreased slightly to $76.93 in May - and are up 96% from the low of February 2009 (at $39.22). Oil import volumes were down in May.
With oil prices and volumes down, oil imports decreased sharply in May, however other imports - especially from China - increased significantly. Most of the increase in the trade deficit since last year has been related to oil, but now it appears the ex-oil deficit is increasing sharply again.
Friday, June 11, 2010
LA Port Traffic: Imports Surge Year-over-year in May
by Calculated Risk on 6/11/2010 03:58:00 PM
Notes: this data is not seasonally adjusted. There is a very distinct seasonal pattern for imports, but not for exports. LA area ports handle about 40% of the nation's container port traffic.
Sometimes port traffic gives us an early hint of changes in the trade deficit. The following graph shows the loaded inbound and outbound traffic at the ports of Los Angeles and Long Beach in TEUs (TEUs: 20-foot equivalent units or 20-foot-long cargo container). Although containers tell us nothing about value, container traffic does give us an idea of the volume of goods being exported and imported.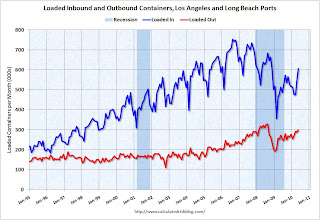 Click on graph for larger image in new window.
Loaded inbound traffic was up 18.3% compared to May 2009. Inbound traffic was still down 5% vs. two years ago (May 08).
Loaded outbound traffic was up 9.4% from May 2009. Just as with imports, exports are still off from 2 years ago (off 7.3%).
For imports there is usually a significant dip in either February or March, depending on the timing of the Chinese New Year, and then usually imports increase until late summer or early fall as retailers build inventory for the holiday season. So this increase in May imports is part of the normal seasonal pattern.
Based on this data, it appears the trade deficit with Asia increased in May. Once again it appears imports are increasing faster than exports and the pre-crisis global imbalances have returned.
Thursday, June 10, 2010
Trade Deficit increases slightly in April
by Calculated Risk on 6/10/2010 09:07:00 AM
The Census Bureau reports:
[T]otal April exports of $148.8 billion and imports of $189.1 billion resulted in a goods and services deficit of $40.3 billion, up from $40.0 billion in March, revised. April exports were $1.0 billion less than March exports of $149.8 billion. April imports were $0.8 billion less than March imports of $189.9 billion.
 Click on graph for larger image.
The first graph shows the monthly U.S. exports and imports in dollars through April 2010.
On a year-over-year basis, exports are up 20% and imports are up 24%. This is an easy comparison because of the collapse in trade at the end of 2008 and into early 2009.
The second graph shows the U.S. trade deficit, with and without petroleum, through April.
 The blue line is the total deficit, and the black line is the petroleum deficit, and the red line is the trade deficit ex-petroleum products.
Import oil prices increased slightly to $77.13 in April - and are up 97% from the low of February 2009 (at $39.22). Oil import volumes were down in April.
Although both imports and exports were off slightly in April, both have been increasing sharply - but are still below the pre-crisis levels. Once again China and oil are the major contributors to the trade deficit.
Thursday, May 13, 2010
LA Port Traffic in April, Exports off Slightly
by Calculated Risk on 5/13/2010 12:07:00 PM
Notes: this data is not seasonally adjusted. There is a very distinct seasonal pattern for imports, but not for exports. LA area ports handle about 40% of the nation's container port traffic.
Sometimes port traffic gives us an early hint of changes in the trade deficit. The following graph shows the loaded inbound and outbound traffic at the ports of Los Angeles and Long Beach in TEUs (TEUs: 20-foot equivalent units or 20-foot-long cargo container). Although containers tell us nothing about value, container traffic does give us an idea of the volume of goods being exported and imported. Click on graph for larger image in new window.
Loaded inbound traffic was up 13.6% compared to April 2009. (up 15% compared to last year using three month average). Inbound traffic was still down 11% vs. two years ago (Apr 08).
Loaded outbound traffic was up 13.7% from April 2009. (+19% using three months average) Just as with imports, exports are still off from 2 years ago (off 7%).
Exports were off slightly in April after the increase in March.
For imports there is usually a significant dip in either February or March, depending on the timing of the Chinese New Year, and that didn't happen this year. Then usually imports increase until late summer or early fall as retailers build inventory for the holiday season. So this increase in April imports is part of the normal seasonal pattern.
Still, based on this data, it appears the trade deficit with Asia increased in April. The old global imbalances continue ...
Wednesday, May 12, 2010
Trade Deficit increases in March
by Calculated Risk on 5/12/2010 08:30:00 AM
The Census Bureau reports:
[T]otal March exports of $147.9 billion and imports of $188.3 billion resulted in a goods and services deficit of $40.4 billion, up from $39.4 billion in February, revised. March exports were $4.6 billion more than February exports of $143.3 billion. March imports were $5.6 billion more than February imports of $182.7 billion.
 Click on graph for larger image.
The first graph shows the monthly U.S. exports and imports in dollars through March 2010.
On a year-over-year basis, exports are up 20% and imports are up 24%. This is an easy comparison because of the collapse in trade at the end of 2008 and into early 2009.
The second graph shows the U.S. trade deficit, with and without petroleum, through March.
 The blue line is the total deficit, and the black line is the petroleum deficit, and the red line is the trade deficit ex-petroleum products.
Import oil prices increased slightly to $73.89 in March - and are up 89% from the low of February 2009 (at $39.22). Oil import volumes increased sharply in March pushing up the value of imports.
Both imports and exports have been increasing sharply, but are still below the pre-financial crisis levels. Once again China and oil are the major contributors to the trade deficit.
Thursday, April 15, 2010
LA Area Port Traffic Increases in March
by Calculated Risk on 4/15/2010 09:49:00 PM
Notes: this data is not seasonally adjusted. There is a very distinct seasonal pattern for imports, but not for exports. LA area ports handle about 40% of the nation's container port traffic.
Sometimes port traffic gives us an early hint of changes in the trade deficit. The following graph shows the loaded inbound and outbound traffic at the ports of Los Angeles and Long Beach in TEUs (TEUs: 20-foot equivalent units or 20-foot-long cargo container). Although containers tell us nothing about value, container traffic does give us an idea of the volume of goods being exported and imported. Click on graph for larger image in new window.
Loaded inbound traffic was up 2.6% compared to March 2009. (up 9.6% compared to last year using three month average). Inbound traffic was still down 9.2% vs. two years ago (Mar08).
Loaded outbound traffic was up 13.6% from March 2009. (+24.9% using three months average) Just as with imports, exports are still off from 2 years ago (off 8.0%).
Looking at the graph (red line), exports recovered in the first half of 2009, but then export traffic only increased gradually since last summer. Export traffic picked up again in March.
It is harder to tell about imports (blue line) because of the large seasonal swings. Usually there is a large dip in either February or March - depending on the timing of the Chinese New Year - and that didn't happen this year. The lack of a large seasonal dip might suggest a significant increase in imports too.
Tuesday, April 13, 2010
Trade Deficit increases in February
by Calculated Risk on 4/13/2010 08:54:00 AM
The Census Bureau reports:
[T]otal February exports of $143.2 billion and imports of $182.9 billion resulted in a goods and services deficit of $39.7 billion, up from $37.0 billion in January, revised.
 Click on graph for larger image.
The first graph shows the monthly U.S. exports and imports in dollars through February 2010.
On a year-over-year basis, exports are up 14% and imports are up 20%. This is an easy comparison because of the collapse in trade at the end of 2008 and into early 2009. This is the first time since late 2008 that imports are up a greater percentage than imports on a YoY basis as export growth appears to have slowed.
The second graph shows the U.S. trade deficit, with and without petroleum, through February.
 The blue line is the total deficit, and the black line is the petroleum deficit, and the red line is the trade deficit ex-petroleum products.
Import oil prices decreased slightly to $72.92 in February - but are up 86% from the low of one year ago in February 2009 (at $39.22). Oil import volumes declined in February.
In general trade has been increasing, although both imports and exports are still below the pre-financial crisis levels. Exports boosted the economy over the last year, however it now appears that export growth has slowed. Imports are still increasing even with the lower oil deficit in February.


