 RSS Feed
 by Calculated Risk on 10/14/2010 09:10:00 AM
Thursday, October 14, 2010
Trade Deficit increases sharply in August
The Census Bureau reports:
[T]otal August exports of $153.9 billion and imports of $200.2 billion resulted in a goods and services deficit of $46.3 billion, up from $42.6 billion in July, revised.
 Click on graph for larger image.
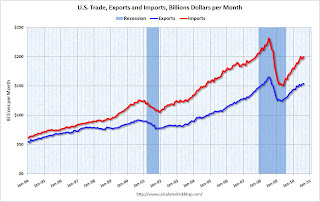
The first graph shows the monthly U.S. exports and imports in dollars through August 2010.
After trade bottomed in the first half of 2009, both imports and exports increased significantly. However in 2010 export growth has slowed, and imports have been increasing much faster than exports.
The second graph shows the U.S. trade deficit, with and without petroleum, through August.
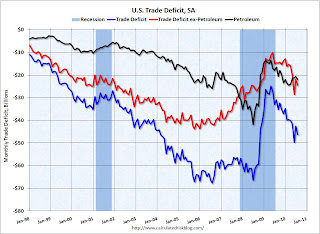 The blue line is the total deficit, and the black line is the petroleum deficit, and the red line is the trade deficit ex-petroleum products.
The increase in the deficit in August was due to both oil and China, although the bulk of the increase was because of trade with China. The trade deficit with China increased to $28.0 billion in August from $25.9 billion in July (NSA).
The imbalances have returned ...


