 RSS Feed
 by Calculated Risk on 10/14/2010 12:43:00 PM
Thursday, October 14, 2010
Hotel Performance: RevPAR up 8.8% compared to same week in 2009
Hotel occupancy is one of several industry specific indicators I follow ...
Important: Even though the occupancy rate is close to 2008 levels, 2010 is a much more difficult year for the hotel industry than 2008. RevPAR (revenue per available room) is up 8.8% compared to 2009, but still down 4.1% compared to 2008 - and 2008 was a very difficult year for the hotel industry.
From HotelNewsNow.com: STR: Economy ADR performance falls short
Overall, the industry’s occupancy increased 6.5% to 63.6%, ADR was up 2.2% to US$101.58, and revenue per available room ended the week up 8.8% to US$64.62.The following graph shows the four week moving average for the occupancy rate by week for 2008, 2009 and 2010 (and a median for 2000 through 2007).
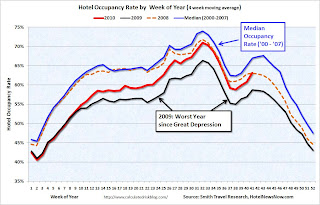 Click on graph for larger image in new window.
Notes: the scale doesn't start at zero to better show the change. The graph shows the 4-week average, not the weekly occupancy rate.
On a 4-week basis, occupancy is up 7.4% compared to last year (the worst year since the Great Depression) and 5.8% below the median for 2000 through 2007.
The occupancy rate is about at the levels of 2008, but RevPAR is still down 4.1%.
Data Source: Smith Travel Research, Courtesy of HotelNewsNow.com


