 RSS Feed
 by Calculated Risk on 4/13/2010 08:54:00 AM
Tuesday, April 13, 2010
Trade Deficit increases in February
The Census Bureau reports:
[T]otal February exports of $143.2 billion and imports of $182.9 billion resulted in a goods and services deficit of $39.7 billion, up from $37.0 billion in January, revised.
 Click on graph for larger image.
The first graph shows the monthly U.S. exports and imports in dollars through February 2010.
On a year-over-year basis, exports are up 14% and imports are up 20%. This is an easy comparison because of the collapse in trade at the end of 2008 and into early 2009. This is the first time since late 2008 that imports are up a greater percentage than imports on a YoY basis as export growth appears to have slowed.
The second graph shows the U.S. trade deficit, with and without petroleum, through February.
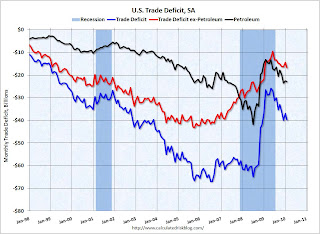 The blue line is the total deficit, and the black line is the petroleum deficit, and the red line is the trade deficit ex-petroleum products.
Import oil prices decreased slightly to $72.92 in February - but are up 86% from the low of one year ago in February 2009 (at $39.22). Oil import volumes declined in February.
In general trade has been increasing, although both imports and exports are still below the pre-financial crisis levels. Exports boosted the economy over the last year, however it now appears that export growth has slowed. Imports are still increasing even with the lower oil deficit in February.


