 RSS Feed
 by Calculated Risk on 7/14/2010 03:38:00 PM
Wednesday, July 14, 2010
LA Port Traffic: Imports Surge, Exports Decline
Notes: this data is not seasonally adjusted. There is a very distinct seasonal pattern for imports, but not for exports. LA area ports handle about 40% of the nation's container port traffic.
Sometimes port traffic gives us an early hint of changes in the trade deficit. The following graph shows the loaded inbound and outbound traffic at the ports of Los Angeles and Long Beach in TEUs (TEUs: 20-foot equivalent units or 20-foot-long cargo container). Although containers tell us nothing about value, container traffic does give us an idea of the volume of goods being exported and imported.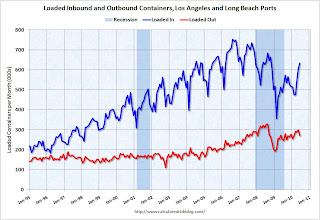 Click on graph for larger image in new window.
Loaded inbound traffic was up 30.0% compared to June 2009. Inbound traffic is now up 1% vs. two years ago (June '08).
Loaded outbound traffic was up 7.7% from June 2009. Exports were off almost 4% from May 2010. Unlike imports, exports are still off from 2 years ago (off 13%).
For imports there is usually a significant dip in either February or March, depending on the timing of the Chinese New Year, and then usually imports increase until late summer or early fall as retailers build inventory for the holiday season. So part of this increase in June imports is just the normal seasonal pattern.
Based on this data, it appears the trade deficit with Asia increased again in June. Not only have the pre-crisis global imbalances returned, but the decline in exports from May is concerning (there is no clear seasonal pattern for exports).


