 RSS Feed
 by Calculated Risk on 2/15/2011 10:00:00 AM
Showing posts with label NAHB. Show all posts
Showing posts with label NAHB. Show all posts
Tuesday, February 15, 2011
NAHB Builder Confidence unchanged in February
The National Association of Home Builders (NAHB) reports the housing market index (HMI) was unchanged at 16 in February. This was slightly below expectations of an increase to 17. Confidence remains very low ... any number under 50 indicates that more builders view sales conditions as poor than good.
 Click on graph for larger image in new window.
This graph compares the NAHB HMI (left scale) with single family housing starts (right scale). This includes the February release for the HMI and the December data for starts (January housing starts will be released tomorrow).
Both confidence and housing starts have been moving sideways at a very depressed level for over two years.
Press release from the NAHB: Builder Confidence Unchanged for Fourth Consecutive Month in February
Builder confidence in the market for newly built, single-family homes remained unchanged at 16 for a fourth consecutive month in February, according to the National Association of Home Builders/Wells Fargo Housing Market Index (HMI), released today.
...
"Builders are telling us that some pockets of optimism have begun to emerge, but many prospective purchasers are concerned about selling their existing home in the current market, or face difficulty securing credit for a home purchase -- even when they are well-qualified," said NAHB Chief Economist David Crowe
...
On a positive note, two out three of the HMI's component indexes edged slightly upward in February. The component gauging current sales conditions improved by two points to 17, while the component gauging sales expectations in the next six months rose a single point, to 25. Meanwhile, the component gauging traffic of prospective buyers held unchanged, at 12.
On a regional basis, HMI scores were mixed in February, with gains reported in two parts of the country and declines in two others. The Northeast registered a two-point gain to 22, the South posted a one-point gain to 18, the Midwest posted a one-point decline to 12 and the West posted a two-point decline to 13.
Tuesday, January 18, 2011
NAHB Builder Confidence Graph
by Calculated Risk on 1/18/2011 06:52:00 PM
Earlier the National Association of Home Builders (NAHB) reported the housing market index (HMI) was unchanged at 16 in January. Here is the graph ...
 Click on graph for larger image in new window.
This graph compares the NAHB HMI (left scale) with single family housing starts (right scale). This includes the January release for the HMI and the November data for starts (December housing starts will be released tomorrow).
This shows that the HMI and single family starts mostly move in the same direction although there is plenty of noise month-to-month. The HMI has mostly moved sideways - with some minor ups and downs - for over 2 years now at a very depressed level.
NAHB Builder Confidence Remains Unchanged In January
by Calculated Risk on 1/18/2011 10:00:00 AM
The National Association of Home Builders (NAHB) reports the housing market index (HMI) was unchanged at 16 in January. The consensus was for a reading of 17. Confidence remains very low ... any number under 50 indicates that more builders view sales conditions as poor than good.
Note: I'm attending the NMHC apartment conference in Palm Springs today - I'll post the graph tonight. Here is the graph from last month (Nothing has changed!)
Press release from the NAHB: Builder Confidence Remains Unchanged In January
Builder confidence in the market for newly built, single-family homes held unchanged at a relatively low level of 16 for a third consecutive month in January, according to the latest National Association of Home Builders/Wells Fargo Housing Market Index (HMI), released today.
...
"The HMI and its subcomponent indexes are holding steady following a below-expectations finish in 2010," noted NAHB Chief Economist David Crowe. "At this point, housing remains on the sidelines of a weak economic recovery as consumers and builders wait for clear and consistent indications that jobs and economic output are reviving."
...
While the HMI components gauging current sales conditions and sales expectations for the next six months both held steady from the previous month, at 16 and 25, respectively, the component gauging traffic of prospective buyers edged up a single point to 12 in January.
HMI scores rose by one point in the Midwest and four points in the West in January, to 14 and 15, respectively. Meanwhile, HMI scores fell two points in the Northeast and one point in the South, to 20 and 17, respectively.
Wednesday, December 15, 2010
NAHB Builder Confidence Flat in December
by Calculated Risk on 12/15/2010 10:00:00 AM
The National Association of Home Builders (NAHB) reports the housing market index (HMI) was unchanged at 16 in December. Confidence remains very low ... any number under 50 indicates that more builders view sales conditions as poor than good.
 Click on graph for larger image in new window.
This graph compares the NAHB HMI (left scale) with single family housing starts (right scale). This includes the December release for the HMI and the October data for starts (November housing starts will be released tomorrow).
This shows that the HMI and single family starts mostly move in the same direction - although there is plenty of noise month-to-month.
Press release from the NAHB: Builder Confidence Remains Flat in December
Builder confidence in the market for newly built, single-family homes remained unchanged in December from the previous month at 16 on the National Association of Home Builders/Wells Fargo Housing Market Index (HMI), released today.
...
Two out of three components of December's HMI remained unchanged from the previous month, including the component gauging current sales conditions (which remained at 16) and the component gauging sales expectations in the next six months (which was flat at 25). The component gauging traffic of prospective buyers fell a single point, to 11.
Monday, October 18, 2010
NAHB Builder Confidence increases in October
by Calculated Risk on 10/18/2010 10:00:00 AM
The National Association of Home Builders (NAHB) reports the housing market index (HMI) was at 16 in October. This is a 3 point increase from 13 in September, and is the highest level since June. The record low was 8 set in January 2009, and 16 is still very low ...
Note: any number under 50 indicates that more builders view sales conditions as poor than good.
 Click on graph for larger image in new window.
This graph compares the NAHB HMI (left scale) with single family housing starts (right scale). This includes the October release for the HMI and the August data for starts (September starts will be released tomorrow).
This shows that the HMI and single family starts mostly move in the same direction - although there is plenty of noise month-to-month.
Press release from the NAHB: Builder Confidence Improves in October
Builder confidence in the market for newly built, single-family homes rose three points to 16 on the National Association of Home Builders/Wells Fargo Housing Market Index (HMI) for October, released today. This was the first improvement registered by the HMI in five months, and returns the index to a level last seen in June of this year.
...
All three of the HMI's component indexes registered gains in October. The index gauging current sales conditions rose three points to16, while the index gauging sales expectations in the next six months rose five points to 23 and the index gauging traffic of prospective buyers rose two points to 11.
Monday, September 20, 2010
NAHB Builder Confidence stuck at low level in September
by Calculated Risk on 9/20/2010 10:00:00 AM
The National Association of Home Builders (NAHB) reports the housing market index (HMI) was at 13 in September. This is the same low level as in August and below expectations. The record low was 8 set in January 2009, and 13 is very low ...
Note: any number under 50 indicates that more builders view sales conditions as poor than good. Click on graph for larger image in new window.
This graph compares the NAHB HMI (left scale) with single family housing starts (right scale). This includes the September release for the HMI and the July data for starts (August starts will be released tomorrow).
This shows that the HMI and single family starts mostly move in the same direction - although there is plenty of noise month-to-month.
Press release from the NAHB: Builder Confidence Unchanged in September
Builder confidence in the market for newly built, single-family homes held unchanged in September from the previous month's low level of 13, according to the latest National Association of Home Builders/Wells Fargo Housing Market Index (HMI), released today.
"In general, builders haven't seen any reason for improved optimism in market conditions over the past month," noted NAHB Chairman Bob Jones, a home builder from Bloomfield Hills, Mich. "If anything, consumer uncertainty has increased, and builders feel their hands are tied until potential home buyers feel more secure about the job market and economy."
"The stall in the nation's housing market continues," agreed NAHB Chief Economist David Crowe. "Builders report that the two leading obstacles to new-home sales right now are consumer reluctance in the face of the poor job market and the large number of foreclosed properties for sale."
Monday, August 16, 2010
NAHB Builder Confidence falls in August to lowest since March 2009
by Calculated Risk on 8/16/2010 10:00:00 AM
The National Association of Home Builders (NAHB) reports the housing market index (HMI) was at 13 in August. This is down slightly from 14 in July and below expectations. The record low was 8 set in January 2009, and 13 is very low ...
Note: any number under 50 indicates that more builders view sales conditions as poor than good. Click on graph for larger image in new window.
This graph compares the NAHB HMI (left scale) with single family housing starts (right scale). This includes the August release for the HMI and the June data for starts (July starts will be released tomorrow).
This shows that the HMI and single family starts mostly move generally in the same direction - although there is plenty of noise month-to-month.
Press release from the NAHB: Builder Confidence Declines In August
Builder confidence in the market for newly built, single-family homes edged down for a third consecutive month in August, according to the latest National Association of Home Builders/Wells Fargo Housing Market Index (HMI), released today. The HMI declined one point to 13, its lowest level since March of 2009.
...
“Today’s report reflects single-family home builders’ concerns about current and future economic conditions and about the increasing hesitancy they are seeing among potential home buyers,” added NAHB Chief Economist David Crowe. “It also reflects the frustration that builders are feeling regarding the effects that foreclosed property sales are having on the new-homes market, with 87 percent of respondents reporting that their market has been negatively impacted by foreclosures.”
...
Two out of three of the HMI’s component indexes fell in August. The component gauging current sales conditions declined one point to 14, while the component gauging sales expectations for the next six months declined three points to 18. The component gauging traffic of prospective buyers held unchanged at 10.
Monday, July 19, 2010
NAHB Builder Confidence falls to lowest level since April 2009
by Calculated Risk on 7/19/2010 10:00:00 AM
Note: any number under 50 indicates that more builders view sales conditions as poor than good. Click on graph for larger image in new window.
This graph shows the builder confidence index from the National Association of Home Builders (NAHB).
The housing market index (HMI) was at 14 in June. This is the lowest level since April 2009.
The record low was 8 set in January 2009, but 14 is very low ... This second graph compares the NAHB HMI (left scale) with single family housing starts (right scale). This includes the July release for the HMI and the May data for starts (June starts will be released tomorrow).
This shows that the HMI and single family starts mostly move generally in the same direction - although there is plenty of noise month-to-month.
Press release from the NAHB: Builder Confidence Declines in July
Builder confidence in the market for newly built, single-family homes declined for a second consecutive month in July to its lowest level since April of 2009, according to the National Association of Home Builders/Wells Fargo Housing Market Index (HMI) released today. The HMI fell two points from a downwardly revised number in the previous month to 14 for July.This suggests futher declines in housing starts. The consensus is for a decrease to 580K (SAAR) in June from 593K in May. I'll take the under.
...
Each of the HMI's component indexes recorded declines in July. The component gauging current sales conditions fell two points to 15, while the component gauging sales expectations in the next six months edged down one point to 21 and the component gauging traffic of prospective buyers fell three points to 10.
Tuesday, June 15, 2010
NAHB Builder Confidence declines sharply in June
by Calculated Risk on 6/15/2010 10:00:00 AM
Note: any number under 50 indicates that more builders view sales conditions as poor than good.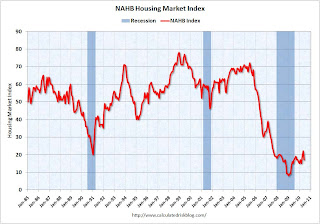 Click on graph for larger image in new window.
This graph shows the builder confidence index from the National Association of Home Builders (NAHB).
The housing market index (HMI) was at 17 in June. This was a sharp decline from 22 in May.
The record low was 8 set in January 2009. This is still very low ... This second graph compares the NAHB HMI (left scale) with single family housing starts (right scale). This includes the June release for the HMI and the April data for starts (May starts will be released tomorrow).
This shows that the HMI and single family starts mostly move generally in the same direction - although there is plenty of noise month-to-month.
Press release from the NAHB: Builder Confidence Declines in June
Snapping a string of two consecutive monthly gains, builder confidence in the market for newly built, single-family homes fell back to February levels, before the beginning of the home buyer tax credit-related surge, according to results of the latest National Association of Home Builders/Wells Fargo Housing Market Index (HMI), released today. The HMI dropped five points to 17 in June.This suggests single family starts will decline sharply soon.
“The home buyer tax credit did its job in stoking spring sales and we expected a temporary pull back in the builders’ outlook after the credit expired at the end of April,” said NAHB Chairman Bob Jones, a home builder from Bloomfield Hills, Mich. “However, the reduction in consumer activity may have been more dramatic than some builders had anticipated, which resulted in their lower confidence levels.”
...
Each of the HMI’s component indexes recorded declines in June. The component gauging current sales conditions fell five points to 17, while the component gauging sales expectations for the next six months declined four points to 23 (from a one-point downward revised index level of 27 in May) and the component gauging traffic of prospective buyers fell two points to 14.
The HMI also posted losses in every region in June. The Northeast, which has the smallest survey sample and is therefore subject to greater month-to-month volatility, fell 17 points to 18 following a 14-point jump in May. The Midwest posted a three-point loss to 14, while the South also registered a three-point decline to 19 and the West fell four points to 15 from a revised May level of 19.
Monday, May 17, 2010
NAHB Builder Confidence Increases in May
by Calculated Risk on 5/17/2010 01:00:00 PM
Note: any number under 50 indicates that more builders view sales conditions as poor than good. Click on graph for larger image in new window.
This graph shows the builder confidence index from the National Association of Home Builders (NAHB).
The housing market index (HMI) was at 22 in May. This is an increase from 19 in April. This is the highest level since August 2007 - and builders were seen as depressed then!
The record low was 8 set in January 2009. This is still very low ... This second graph compares the NAHB HMI (left scale) with single family housing starts (right scale). This includes the May release for the HMI and the March data for starts (April starts will be released tomorrow).
This shows that the HMI and single family starts mostly move generally in the same direction - although there is plenty of noise month-to-month.
Press release from the NAHB: Builder Confidence Continues to Strengthen in May
Builder confidence in the market for newly built, single-family homes rose for a second consecutive month in May to its highest level in more than two years, according to the latest National Association of Home Builders/Wells Fargo Housing Market Index (HMI), released today. The HMI gained three points to 22 in May, its highest point since August of 2007.
“Builders surveyed for the HMI at the beginning of May were undoubtedly reacting to the heightened consumer interest they had just witnessed as the deadline for home buyer tax credits arrived at the end of April,” said Bob Jones, Chairman of the National Association of Home Builders (NAHB) and a home builder from Bloomfield Hills, Mich. “Builders are also hopeful that the solid momentum that the tax credits initiated will continue even now that those incentives are gone.”
“The really encouraging part of today’s HMI is that sales expectations for the next six months continued to gain, despite the expiration of the home buyer tax credits at the end of April,” said NAHB Chief Economist David Crowe. “This means builders are more comfortable that the market is truly beginning to recover, and that positive factors for buying a new home – low interest rates, great selection, stabilizing prices, and a recovering job market – are taking the place of tax incentives to generate buyer demand.”
Crowe was quick to point out, however, that while builder confidence has improved from the depths of the housing downturn, it is still quite low by historic standards. “Obviously we still have a long way to go ..."
Each of the HMI’s three component indexes posted three-point gains in May. The component gauging current sales conditions climbed to 23, its highest level since July of 2007. The component gauging sales expectations in the next six months rose to 28, its highest point since November 2009, and the component gauging traffic of prospective buyers improved to 16, its best showing since September 2009.
Thursday, April 15, 2010
NAHB Builder Confidence increases in April
by Calculated Risk on 4/15/2010 01:00:00 PM
The increase this month was driven by traffic of prospective buyers and current sales - and this was the last month that buyers can take advantage of the housing tax credit - so this increase was no surprise.
Note: any number under 50 indicates that more builders view sales conditions as poor than good. Click on graph for larger image in new window.
This graph shows the builder confidence index from the National Association of Home Builders (NAHB).
The housing market index (HMI) was at 19 in April. This is an increase from 15 in March.
The record low was 8 set in January 2009. This is very low - and this is what I've expected - a long period of builder depression. The HMI has been in the 15 to 19 range since May 2009.  This second graph compares the NAHB HMI (left scale) with single family housing starts (right scale). This includes the April release for the HMI and the February data for starts (March starts will be released tomorrow).
This shows that the HMI and single family starts mostly move generally in the same direction - although there is plenty of noise month-to-month.
And right now they are moving sideways - at best.
Press release from the NAHB: (TBA)
Monday, March 15, 2010
NAHB Builder Confidence declines in March
by Calculated Risk on 3/15/2010 01:00:00 PM
Note: any number under 50 indicates that more builders view sales conditions as poor than good. Click on graph for larger image in new window.
This graph shows the builder confidence index from the National Association of Home Builders (NAHB).
The housing market index (HMI) was at 15 in March. This is a decrease from 17 in February.
The record low was 8 set in January 2009. This is very low - and this is what I've expected - a long period of builder depression. The HMI has been in the 15 to 19 range since May 2009. This second graph compares the NAHB HMI (left scale) with single family housing starts (right scale). This includes the March release for the HMI and the January data for starts (February starts will be released tomorrow, Tuesday March 16th).
This shows that the HMI and single family starts mostly move generally in the same direction - although there is plenty of noise month-to-month.
And right now they are moving sideways - at best.
I was looking back through some old posts - and it seems like yesterday - but it was last summer that I wrote about how starts would probably move sideways for some time because of the large overhang of existing housing units (both owner occupied homes and rental units). I added some emphasis later in the year:
"To be blunt: Those expecting a sharp rebound in starts from the bottom are wrong. And remember - residential investment is usually the best leading indicator for the economy."That still seems correct today.
Press release from the NAHB: (added) Foreclosures Weigh on Builder Confidence in March
Builder confidence in the market for newly built, single-family homes fell back two points to 15 in March as poor weather conditions and distressed property sales posed increasing challenges to both builders and buyers, according to the latest National Association of Home Builders/Wells Fargo Housing Market Index (HMI), released today.Not much snow in March ...
“Unusually poor weather conditions certainly had a negative effect on builders’ business in February,” said NAHB Chairman Bob Jones, a home builder from Bloomfield Hills, Mich. “At the same time, the continual flow of distressed properties priced below the cost of production is having an adverse effect on new-home appraisals and also making it tough for builders’ customers to sell their existing homes.”
Sunday, March 14, 2010
Housing Market Index, Housing Starts, Snow and Spec Homes
by Calculated Risk on 3/14/2010 09:33:00 PM
As mentioned in the Weekly Summary and a Look Ahead post, the NAHB Housing Market Index for March, and Housing Starts for February, will both be released early this week.
Here is a graph showing the relationship between the two series: Click on graph for larger image in new window.
This graph compares the NAHB HMI (left scale) with single family housing starts (right scale). This includes the February release for the HMI and the January data for single family starts.
This shows that the HMI and single family starts mostly move in the same direction - although there is plenty of noise month-to-month. Since the NAHB index increased slightly in February (it is released a month ahead of starts), we might expect some increase in February single family housing starts. Of course the snow might be a factor, although few new homes are built in the northeast compared to the rest of the country. Of course D.C. is in the South region (as is Virginia), so it might be hard to tell. Here is a map of states in each region for the Census Bureau report.
There might also be an increase in speculative starts in some regions (single family) in February since many builders started a few extra homes in anticipation of the expiration of the first time home buyer tax credit. February was probably the last chance to start a spec home to take advantage of the expected buying rush in April - since the builders have to close by the end of June. It usually takes about 6 months to build a home, but 5 months is doable for smaller homes and with so many sub contractors hungry for work.
We will need to look at the details by region this time, but the general trend is sideways ...
Tuesday, February 16, 2010
NAHB Builder Confidence Increases Slightly, Still Very Depressed
by Calculated Risk on 2/16/2010 01:00:00 PM
Note: any number under 50 indicates that more builders view sales conditions as poor than good. Click on graph for larger image in new window.
This graph shows the builder confidence index from the National Association of Home Builders (NAHB).
The housing market index (HMI) was at 17 in February. This is an increase from 15 in January.
The record low was 8 set in January 2009. This is still very low - and this is what I've expected - a long period of builder depression. The HMI has been in the 15 to 19 range since May.
Housing starts will be released tomorrow, and both the HMI and housing starts are moving sideways.
Press release from the NAHB: (added) Builder Confidence Improves in February
Builder confidence in the market for newly built, single-family homes rose two points to 17 in February ...
“Builders are just beginning to see the anticipated effects of the home buyer tax credit on consumer demand,” said NAHB Chief Economist David Crowe. “Meanwhile, another source of encouragement is the improving employment market, which is key to any sustainable economic or housing recovery. That said, several limiting factors are still weighing down builder expectations, including the large number of foreclosed homes on the market, the lack of available credit for new and existing projects, and inappropriately low appraisals tied to the use of distressed properties as comps.”
...
The HMI for February gained two points to 17, its highest level since November of 2009, with two out of three of its component indexes also rising. The component gauging current sales conditions rose two points to 17, while the component gauging sales expectations in the next six months rose a single point to 27. Meanwhile, the component gauging traffic of prospective buyers remained flat, at 12.
Regionally, February’s HMI results were mixed. While the Midwest and South each registered two-point gains, to 13 and 19, respectively, the Northeast and West each registered one-point declines, to 19 and 14, respectively.
Tuesday, January 19, 2010
NAHB: Builder Confidence Declines in January
by Calculated Risk on 1/19/2010 01:00:00 PM
 Click on graph for larger image in new window.
This graph shows the builder confidence index from the National Association of Home Builders (NAHB).
The housing market index (HMI) was at 15 in January. This is a decrease from 16 in December and 17 in November
The record low was 8 set in January. This is still very low - and this is what I've expected - a long period of builder depression. The HMI has been in the 15 to 19 range since May.
Note: any number under 50 indicates that more builders view sales conditions as poor than good. This second graph compares the NAHB HMI (left scale) with single family housing starts (right scale). This includes the January release for the HMI and the November data for starts (December starts will be released Wednesday Jan 19th).
This shows that the HMI and single family starts mostly move in the same direction - although there is plenty of noise month-to-month.
And right now they are moving sideways - at best.
Press release from the NAHB: (added) Builder Confidence Declines in January
The January HMI fell one point to 15, its lowest point since June of 2009. Two of its three component indexes registered one-point declines, with the index gauging current sales conditions and the index gauging traffic of prospective buyers falling to 15 and 12, respectively. The index gauging sales expectations in the next six months held even, at 26.
The HMI edged down by a single point in three regions, with the Northeast falling to 22, the Midwest down to 11 and the South declining to 16. The HMI fell three points in the West, to 16.
Tuesday, December 15, 2009
NAHB: Builder Confidence Declines in December
by Calculated Risk on 12/15/2009 01:00:00 PM
 Click on graph for larger image in new window.
This graph shows the builder confidence index from the National Association of Home Builders (NAHB).
The housing market index (HMI) was at 16 in December. This is a decline from 17 in November. The record low was 8 set in January.
This is very low - and this is what I've expected - a long period of builder depression.
Note: any number under 50 indicates that more builders view sales conditions as poor than good. This second graph compares the NAHB HMI (left scale) with single family housing starts (right scale). This includes the December release for the HMI and the October data for starts (November starts will be released Wednesday Dec 16th).
This shows that the HMI and single family starts mostly move in the same direction - although there is plenty of noise month-to-month.
To be blunt: Those expecting a sharp rebound in starts from the bottom are wrong. And remember - residential investment is usually the best leading indicator for the economy.
Press release from the NAHB: Builder Confidence Edges Down in December
The December HMI fell one point to 16, its lowest point since June of this year. Two out of three component indexes also were down, with a one-point decline to 16 registered for current sales conditions and a two-point decline to 26 registered for sales expectations in the next six months. The component gauging traffic of prospective buyers remained unchanged for a third consecutive month, at 13.
Regionally, December’s HMI results were somewhat mixed. The Northeast posted a three point gain to 23, while the West posted a one-point gain to 19, the South registered no change at 17, and the Midwest posted a two-point decline, to 12.
Tuesday, November 17, 2009
NAHB: Builder Confidence Flat in November
by Calculated Risk on 11/17/2009 01:00:00 PM
 Click on graph for larger image in new window.
This graph shows the builder confidence index from the National Association of Home Builders (NAHB).
The housing market index (HMI) was at 17 in November. October was revised down from 18 to 17. The record low was 8 set in January.
This is very low - and this is what I've expected - a long period of builder depression.
Note: any number under 50 indicates that more builders view sales conditions as poor than good. This second graph compares the NAHB HMI (left scale) with single family housing starts (right scale). This includes the November release for the HMI and the September data for starts (October starts will be released Wednesday Nov 18th).
This shows that the HMI and single family starts mostly move in the same direction - although there is plenty of noise month-to-month. But it appears that those expecting a sharp rebound in starts are probably wrong.
Press release from the NAHB (added): Builder Confidence Unchanged in November
Monday, October 19, 2009
NAHB: Builder Confidence Decreases Slightly in October
by Calculated Risk on 10/19/2009 01:00:00 PM
 Click on graph for larger image in new window.
This graph shows the builder confidence index from the National Association of Home Builders (NAHB).
The housing market index (HMI) decreased to 18 in October from 19 in September. The record low was 8 set in January. Note that Traffic of Prospective Buyers declined sharply.
This is still very low - and this is what I've expected - a long period of builder depression.
Note: any number under 50 indicates that more builders view sales conditions as poor than good. This second graph compares the NAHB HMI (left scale) with single family housing starts (right scale). This includes the October release for the HMI and the August data for starts (September starts will be released tomorrow).
This shows that the HMI and single family starts mostly move in the same direction - although there is plenty of noise month-to-month. Those expecting a sharp rebound in starts are probably wrong.
Press release from the NAHB (added): Builder Confidence Slips in October
“This is the first time since November of 2008 that all three component indexes of the HMI have declined,” noted NAHB Chief Economist David Crowe. “Clearly, builders are experiencing the effects of the expiring tax credit on their sales activity, since it would be virtually impossible at this point to complete a new home sale in time to take advantage of that buyer incentive before Nov. 30.”
...
Each of the HMI’s component indexes recorded declines in October. The component gauging current sales conditions fell one point to 17, while the component gauging sales expectations for the next six months declined two points to 27 and the component gauging traffic of prospective buyers fell three points to 14.
On a regional basis, the Northeast was the only part of the country to record an improvement in its HMI score, with a one-point gain to 25. Meanwhile, the Midwest and South each recorded one-point declines to 18 and the West recorded a four-point decline to 14.
Wednesday, September 16, 2009
NAHB: Builder Confidence increases Slightly in September
by Calculated Risk on 9/16/2009 01:00:00 PM
 Click on graph for larger image in new window.
This graph shows the builder confidence index from the National Association of Home Builders (NAHB).
The housing market index (HMI) increased to 19 in September from 18 in August. The record low was 8 set in January.
This is still very low - and this is what I've expected - a long period of builder depression.
Note: any number under 50 indicates that more builders view sales conditions as poor than good. This second graph compares the NAHB HMI (left scale) with new home sales and single family housing starts (right scale). This is the September release for the HMI compared to the July data for starts and sales.
This shows that the HMI, single family starts and new home sales mostly move in the same direction - although there is plenty of noise month-to-month.
NOTE: For purposes of determining if starts are above or below sales, you have to use the quarterly data by intent. You can't compare the monthly total single family starts directly to new home sales, because single family starts include several categories not included in sales (like owner built units and high rise condos).
Press release from the NAHB (added): Builder Confidence Edges Up Again In September
Builder confidence in the market for newly built, single-family homes edged higher for a third consecutive month in September, according to the latest National Association of Home Builders/Wells Fargo Housing Market Index (HMI), released today. The HMI rose one point to 19 this month, its highest level since May of 2008.
“Builders are seeing some improvement in buyer demand as a result of the first-time home buyer tax credit, and low mortgage rates and strong housing affordability have also helped to revive some optimism,” noted Joe Robson, chairman of the National Association of Home Builders (NAHB) and a home builder from Tulsa, Okla. “However, the window is now basically closed for being able to start a new home that can be completed in time for buyers to take advantage of the tax credit before it expires at the end of November, and builders are concerned about what will keep the market moving once the credit is gone. ....”
“Today’s report indicates that builders are starting to see some glimmers of light at the end of the tunnel in terms of improving sales activity,” said NAHB Chief Economist David Crowe. “However, the fact that the HMI component gauging sales expectations for the next six months slipped backward this month is a sign of their awareness that this is a very fragile recovery period and several major hurdles remain that could stifle the positive momentum. Those hurdles include the impending expiration of the $8,000 tax credit as well as the critical lack of credit for housing production loans and continuing problems with low appraisals that are sinking one quarter of all new-home sales. These concerns need to be addressed if we are to embark on a sustained housing recovery that will help bolster economic growth.”
Derived from a monthly survey that NAHB has been conducting for more than 20 years, the NAHB/Wells Fargo Housing Market Index gauges builder perceptions of current single-family home sales and sales expectations for the next six months as “good,” “fair” or “poor.” The survey also asks builders to rate traffic of prospective buyers as “high to very high,” “average” or “low to very low.” Scores for each component are then used to calculate a seasonally adjusted index where any number over 50 indicates that more builders view sales conditions as good than poor.
Two out of three of the HMI’s component indexes recorded gains in September. The index gauging current sales conditions rose two points to 18, while the index gauging traffic of prospective buyers rose one point, to 17. Meanwhile, the index gauging sales expectations for the next six months declined one point, to 29.
All four regions posted gains in their HMI readings for September. The biggest improvement was registered in the Midwest, where a three-point gain brought its HMI to 19, the highest level since July of 2007. The Northeast posted a two-point gain to 24, the South posted a two-point gain to 19, and the West posted a one-point gain to 18, respectively.
emphasis added
Monday, August 17, 2009
NAHB: Builder Confidence Slightly Higher in August
by Calculated Risk on 8/17/2009 01:00:00 PM
 Click on graph for larger image in new window.
This graph shows the builder confidence index from the National Association of Home Builders (NAHB).
The housing market index (HMI) increased to 18 in August from 17 in July. The record low was 8 set in January.
This is still very low - and this is what I've expected - a long period of builder depression.
Note: any number under 50 indicates that more builders view sales conditions as poor than good. This second graph compares the NAHB HMI (left scale) with new home sales and single family housing starts (right scale). This is the August release for the HMI compared to the June data for starts and sales.
This shows that the HMI, single family starts and new home sales mostly move in the same direction - although there is plenty of noise month-to-month.
NOTE: For purposes of determining if starts are above or below sales, you have to use the quarterly data by intent. You can't compare the monthly total single family starts directly to new home sales, because single family starts include several categories not included in sales (like owner built units and high rise condos).
Press release from the NAHB (added):
Builder confidence in the market for newly built, single-family homes rose one point in August to its highest level in more than a year, according to the latest reading of the National Association of Home Builders/Wells Fargo Housing Market Index (HMI), released today. Building on a two-point gain in July, the HMI reached 18 this month, its highest point since June of 2008.
“Home builder expectations have been buoyed by the success of the first-time home buyer tax credit and its anticipated boost to buying activity leading up to the Nov. 30 expiration date,” said NAHB Chairman Joe Robson, a home builder from Tulsa, Okla. “The question is what happens after that ..."
...
“One very positive aspect of today’s report is the big gain registered in the component gauging home builders’ expectations for the next six months,” noted NAHB Chief Economist David Crowe. “This reflects anticipated sales stemming from the tax credit as well as recent signs that an economic recovery has begun. There is definitely a sense of hope among builders that the worst of the downturn is over and that a turning point is near at hand.”
...
NAHB is calling on Congress to extend the first-time home buyer tax credit for another year and to offer it to all income-eligible buyers.


