 RSS Feed
 by Calculated Risk on 11/23/2010 08:30:00 AM
Showing posts with label GDP. Show all posts
Showing posts with label GDP. Show all posts
Tuesday, November 23, 2010
Q3 real GDP growth revised up to 2.5% annualized rate
From the BEA: Gross Domestic Product, 2nd quarter 2010 (second estimate)
The upward revision came from PCE (revised up from 2.6% to 2.8%), from net exports (added 0.25 percentage points to growth), and state and local government expenditures (revised up from -0.2% to 0.8%).
As expected, non-residential structure investment was revised down from 3.9% to -5.7%.
 Click on graph for larger image in new window.
This graph shows the quarterly GDP growth (at an annual rate) for the last 30 years. The current quarter is in blue.
The dashed line is the median growth rate of 3.05%. The current recovery is still below trend growth.
Monday, November 01, 2010
Q3: Office, Mall and Lodging Investment
by Calculated Risk on 11/01/2010 01:05:00 PM
First - the advance Q3 GDP report released last Friday showed an annualized real increase of 3.9% for investment in non-residential structures. This broke a streak of eight straight quarterly declines. However the construction spending report released this morning suggests that most (probably all) of this gain will be revised away.
Second - with the release of underlying detail data today - we can see that most of the reported small gains for non-residential structure investment in Q3 were for power and petroleum mining structures.
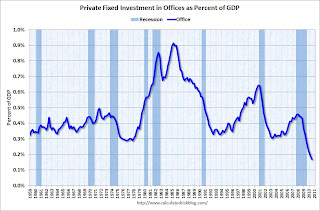
If we look at just office, mall and lodging investment, non-residential structure investment continued to decline in Q3.
 Click on graph for larger image in new window.
This graph shows investment in offices as a percent of GDP. Office investment as a percent of GDP peaked at 0.46% in Q1 2008 and has declined sharply to a new series low as a percent of GDP (data series starts in 1959).
Reis reported that the office vacancy rate is at a 17 year high at 17.5% in Q3, up from 17.4% in Q2, and 16.6% in Q3 2009. With the office vacancy rate still rising, office investment will probably decline further - although most of the decline in investment has already happened.
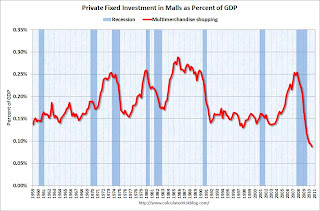 The second graph is for investment in malls.
Investment in multimerchandise shopping structures (malls) peaked in 2007 and has fallen by two-thirds (note that investment includes remodels, so this will not fall to zero). Mall investment is also at a series low (as a percent of GDP).
Reis reported that the mall vacancy rate declined slightly in Q3 2010 from the record high in Q2. However the vacancy rate will have to decline substantially before there is significant new investment.
 The third graph is for lodging (hotels).
The bubble boom in lodging investment was stunning. Lodging investment peaked at 0.32% of GDP in Q2 2008 and has fallen by over 70% already.
As projects are completed there will be little new investment in these categories for some time.
Also notice that investment for all three categories typically falls for a year or two after the end of a recession, and then usually recovers very slowly (flat as a percent of GDP for 2 or 3 years). Something similar will probably happen again, and there will not be a recovery in these categories until the vacancy rates fall significantly.
Friday, October 29, 2010
Q3 Advance Report: Real Annualized GDP Grew at 2.0%
by Calculated Risk on 10/29/2010 08:30:00 AM
Real gross domestic product -- the output of goods and services produced by labor and property located in the United States -- increased at an annual rate of 2.0 percent in the third quarter of 2010, (that is, from the second quarter to the third quarter), according to the "advance" estimate released by the Bureau of Economic Analysis.
 Click on graph for larger image in new window.
This graph shows the quarterly GDP growth (at an annual rate) for the last 30 years. The dashed line is the median growth rate of 3.05%. The current recovery is very weak - the 2nd half slowdown continues.
A few key numbers:
Without the boost in inventories, GDP would have been barely positive in Q3.
This was a little stronger than expected, and PCE will probably slow over the next couple of quarters.
As expected, residential investment declined sharply after the Q2 tax credit boost.
Overall this was a weak report and will not derail QE2 next wednesday (further easing from the Fed).
Friday, August 27, 2010
Q2 real GDP revised down to 1.6% annualized growth rate
by Calculated Risk on 8/27/2010 08:48:00 AM
From the BEA: Gross Domestic Product, 2nd quarter 2010 (second estimate)
The following table shows the changes from the advance release (this is the Contributions to Percent Change in Real Gross Domestic Product).
The largest downward revisions were to the change in private inventories, imports, and non-residential structure investment. Personal consumption expenditures and investment in Equipment and software were revised up.
| Advance | 2nd Estimate (Revision) | Change | |
|---|---|---|---|
| Percent change at annual rate: | |||
| Gross domestic product | 2.4 | 1.6 | -0.8 |
| Percentage points at annual rates: | |||
| Personal consumption expenditures | 1.15 | 1.38 | 0.23 |
| Goods | 0.79 | 0.82 | 0.03 |
| Durable goods | 0.53 | 0.49 | -0.04 |
| Nondurable goods | 0.25 | 0.33 | 0.08 |
| Services | 0.36 | 0.56 | 0.20 |
| Gross private domestic investment | 3.14 | 2.75 | -0.39 |
| Fixed investment | 2.09 | 2.12 | 0.03 |
| Nonresidential | 1.50 | 1.54 | 0.04 |
| Structures | 0.14 | 0.01 | -0.13 |
| Equipment and software | 1.36 | 1.53 | 0.17 |
| Residential | 0.59 | 0.58 | -0.01 |
| Change in private inventories | 1.05 | 0.63 | -0.42 |
| Net exports of goods and services | -2.78 | -3.37 | -0.59 |
| Exports | 1.22 | 1.08 | -0.14 |
| Imports | -4.00 | -4.45 | -0.45 |
| Government consumption expenditures and gross investment | 0.88 | 0.86 | -0.02 |
| Federal | 0.72 | 0.72 | 0.00 |
| National defense | 0.4 | 0.39 | -0.01 |
| Nondefense | 0.33 | 0.32 | -0.01 |
| State and local | 0.16 | 0.14 | -0.02 |
Friday, July 30, 2010
Revisions: Real GDP and PCE well below previous peak
by Calculated Risk on 7/30/2010 11:32:00 AM
Error Correction: Sorry - I confused annual rates and quarterly rates.
Real GDP is 1.1% below the pre-recession peak, so if GDP would have to grow at 4.4% in Q3 the economy to be back to the pre-recession level.
Real PCE is 0.85% below the pre-recession peak, so PCE would have to grow at 3.4% in Q3 to be back to the pre-recession level.
________________________________________________________
These two graphs show the revisions for real GDP and PCE. Click on graph for larger image in new window.
The recession was clearly worse than originally estimated (we suspected this already using Gross Domestic Income).
In fact real GDP in Q2 2010 was lower than originally reported for Q1 2010. And annualized real GDP is still 1.1% below the pre-recession peak. This means that real GDP would have to grow at a 4.3% rate over the next quarter to reach the recession peak.
This shows that St Louis Fed President Bullard was too optimistic in a speech last month. From Bullard in June: The Global Recovery and Monetary Policy
"As of the first quarter of 2010, real GDP stands just shy of the 2008 second quarter level, so that growth of about 1.25 percent would be sufficient to allow real GDP to surpass the previous peak. At that point, the U.S. economy would be fully "recovered" from the very sharp downturn of late 2008 and early 2009. To be clear, the 1.25 percent is a quarterly number, and would be 5.0 percent at an annual rate. Although I think that 5.0 percent at an annual rate is too much to expect for current quarter real GDP growth, it seems like a reasonable possibility over the next two quarters combined. Given these conditions, I expect the U.S. recovery in GDP to be complete in the third quarter of this year."I disagreed with him, and pointed out that GDI suggested downward revisions.
 Real PCE was revised down even more.
Annualized real PCE is now 0.85% below the pre-recession peak, and would have to grow 3.4% over the next quarter to reach the previous peak.
Cleveland Fed President Sandra Pianalto had it right in February: When the Small Stuff Is Anything But Small
[I]t may take years just to get back to the level of output we enjoyed in 2007, just before the economic crisis began.If things go well, the economy will be back to pre-recession levels later this year or in 2011. No wonder there is so little investment. And no wonder there is so little hiring!
Q2: real annualized GDP growth slows to 2.4%
by Calculated Risk on 7/30/2010 08:30:00 AM
Real gross domestic product -- the output of goods and services produced by labor and property located in the United States -- increased at an annual rate of 2.4 percent in the second quarter of 2010, (that is, from the first quarter to the second quarter), according to the "advance" estimate released by the Bureau of Economic Analysis. In the first quarter, real GDP increased 3.7 percent.A few key numbers:
PCE is slowing.
Residential investment was boosted by the tax credit and will decline in Q3.
That is probably the end of the inventory adjustment.
And here is a summary of the revisions:
| Quarter | GDP | GDP Revised | Change |
|---|---|---|---|
| 2007-I | 1.2% | 0.9% | -0.3% |
| 2007-II | 3.2% | 3.2% | 0.0% |
| 2007-III | 3.6% | 2.3% | -1.3% |
| 2007-IV | 2.1% | 2.9% | 0.8% |
| 2008-I | -0.7% | -0.7% | 0.0% |
| 2008-II | 1.5% | 0.6% | -0.9% |
| 2008-III | -2.7% | -4.0% | -1.3% |
| 2008-IV | -5.4% | -6.8% | -1.4% |
| 2009-I | -6.4% | -4.9% | 1.5% |
| 2009-II | -0.7% | -0.7% | 0.0% |
| 2009-III | 2.2% | 1.6% | -0.6% |
| 2009-IV | 5.6% | 5.0% | -0.6% |
| 2010-I | 2.7% | 3.7% | 1.0% |
| 2010-II | 2.4% |
The recession was worse in 2008 than originally estimated.
Q1 2010 was revised up, but Q3 and Q4 2009 were revised down. So the recovery is a little weaker than originally estimated.
I'll have some graphs soon.
Friday, June 25, 2010
Q1 GDP revised down to 2.7%
by Calculated Risk on 6/25/2010 08:32:00 AM
The Q1 real GDP rate was revised down again (third estimate) to 2.7% from the 2nd estimate of 3.0%.
Consumer spending was weaker in Q1 than originally estimated. PCE growth (personal consumption expenditures) was revised down to 3.0% in Q1 from the previous estimate of 3.5%.
Some more from Reuters: Economy Grew Slower in First Quarter than Expected, Up 2.7%
... business spending, which only rose at a 2.2 percent rate instead of 3.1 percent as reported last month. This was as a spending on structures was revised down to show a slightly bigger decline than reported last month. Growth in software and equipment investment was also lowered to a 11.4 percent rate from 12.7 percent.The "Change in private inventories" was revised up to a contribution of 1.88 percentage points from the previous estimate of 1.65. So inventory adjustment accounted for over two-thirds of the GDP growth in Q1 - and the inventory adjustment appears over. This is a weak third estimate.
...
Another drag on growth came from exports whose growth was eclipsed by a rise in imports, resulting in a trade deficit that subtracted from GDP.
... real final sales to domestic purchasers, considered a better measure of domestic demand, rose at a 1.6 percent rate instead of the 2.0 percent pace reported last month.
Tuesday, June 15, 2010
Employment and Real GDP, Real GDI
by Calculated Risk on 6/15/2010 03:47:00 PM
Last night I excerpted from a speech by St Louis Fed President James Bullard. I noted that GDI might be more useful in measuring the recovery than GDP (they are conceptually equivalent).
As a followup to that post (and also to the previous post with the forecast from UCLA-Anderson's Ed Learmer), here are two graphs looking at payroll employment vs. the change in real GDP and real GDI.
At the bottom of this post are estimates of the unemployment rate in 12 months for several growth scenarios. Note: This is similar to Okun's relationship between GDP and unemployment.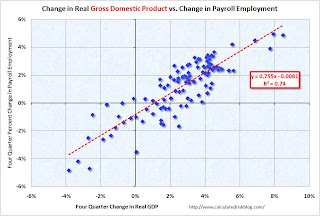 Click on graph for larger image.
The first graph shows the four quarter change in real GDP vs. the four quarter change in employment, as a percent of payroll employment (to normalize for changes in payroll over time).
The second graph shows the same relationship, but uses Gross Domestic Income instead of GDP. There is a clear relationship - the higher the change in the real GDP or real GDI, the larger the increase in payroll employment. The R2 for GDI is slightly higher than for GDP (0.80 vs. 0.74).
This shows that real GDP / real GDI has to grow at a sustained rate of about 1% just to keep the net change in payroll jobs at zero.
A 3% increase in real GDI (over a year) would lead to about a 1.4% increase in payroll employment. With approximately 130 million payroll jobs, a 1.4% increase in payroll employment would be just over 1.8 million jobs over the next year - and the unemployment rate would probably remain close to the current level (9.7%) depending on changes in population and the participation rate.
The following table summarizes several growth scenarios. The unemployment rate is from the household survey and depends on the number of people in the work force - so it cannot be calculated directly. The table uses a range of unemployment rates based on 1.6 to 2.1 million people entering the workforce over the next 12 months (a combination of population growth and discouraged workers reentering the work force).
NOTE: For those interested in understanding the differences between the household and establishment employment surveys - and why the unemployment rate cannot be calculated directly from the payroll report, see: Jobs and the Unemployment Rate
| Real Growth | Percent Payroll Growth | Annual Payroll Growth (000s) | Monthly Payroll Growth (000s) | Unemployment Rate in One Year1 |
|---|---|---|---|---|
| 6.0% | 3.6% | 4648 | 387 | 7.6% to 7.9% |
| 5.0% | 2.9% | 3718 | 310 | 8.2% to 8.5% |
| 4.0% | 2.1% | 2787 | 232 | 8.8% to 9.1% |
| 3.0% | 1.4% | 1857 | 155 | 9.4% to 9.7% |
| 2.0% | 0.7% | 926 | 77 | 10.0% to 10.3% |
| 1.0% | 0.0% | -4 | 0 | 10.6% to 10.9% |
| 1The unemployment rate is from the Household Survey and depends on several factors including changes in population and the participation rate. | ||||
I think Leamer is a little optimistic for 2010 - I'm expecting a 2nd half slowdown in GDP growth this year - and I think the unemployment rate will stay near the current level for some time.
Thursday, May 27, 2010
Gross Domestic Income shows more sluggish recovery
by Calculated Risk on 5/27/2010 03:49:00 PM
Most of the revisions in the "Second Estimate" GDP report this morning were small; the headline GDP number was revised down to 3.0% from 3.2% (annualized real growth rate).
There are really two measures of GDP: 1) real GDP, and 2) real Gross Domestic Income (GDI). The BEA also released GDI today. Recent research suggests that GDI is often more accurate than GDP.
For a discussion on GDI, see from Fed economist Jeremy Nalewaik, “Income and Product Side Estimates of US Output Growth,” Brookings Papers on Economic Activity. An excerpt:
The U.S. produces two conceptually identical official measures of its economic output, currently called Gross Domestic Product (GDP) and Gross Domestic Income (GDI). These two measures have shown markedly different business cycle fluctuations over the past twenty five years, with GDI showing a more-pronounced cycle than GDP. These differences have become particularly glaring over the latest cyclical downturn, which appears considerably worse along several dimensions when looking at GDI. ...The NBER uses both real GDP and real GDI to date recessions.
In discussing the information content of these two sets of estimates, the confusion often starts with the nomenclature. GDP can mean either the true output variable of interest, or an estimate of that output variable based on the expenditure approach. Since these are two very different things, using “GDP” for both is confusing. Furthermore, since GDI has a different name than GDP, it may not be initially clear that GDI measures the same concept as GDP, using the equally valid income approach.
The following graph is constructed as a percent of the previous peak in both GDP and GDI. This shows when the indicator has bottomed - and when the indicator has returned to the level of the previous peak. If the indicator is at a new peak, the value is 100%. The recent recession is marked as ending in Q3 2009 - this is preliminary and NOT an NBER determination.
 Click on graph for larger image in new window.
It appears that GDP bottomed in Q2 2009 and GDI in Q3 2009. Real GDP is only 1.2% below the pre-recession peak - but real GDI is still 2.3% below the previous peak.
GDI suggests the recovery has been more sluggish than the headline GDP report and better explains the weakness in the labor market.
Also "Personal income excluding current transfer receipts (billions of chained 2005 dollars)" was revised down for the last two quarters, and now shows essentially no growth in real personal income since the bottom of the recession.
Friday, April 30, 2010
A few comments on Q1 GDP Report
by Calculated Risk on 4/30/2010 11:59:00 AM
The change in private inventories was smaller this quarter - adding 1.7% to GDP in Q1 2010 compared to 4.4% in Q4 2009. It is important to note that the inventory contribution to Q4 GDP was from a slowdown in the liquidation of inventories, but in Q1 businesses were building inventories - and this inventory build will probably slow in Q2.
As I noted earlier, the two leading sectors, residential investment (RI) and personal consumption expenditures (PCE), were mixed. RI declined to a new record low as percent of GDP, however PCE increased at a 3.6% real annualized rate.
The increase in PCE does not seem sustainable unless employment and incomes increase soon. A large portion of the increase in PCE came from a decrease in personal saving.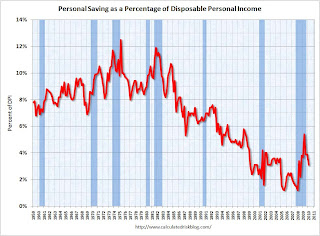 Click on graph for larger image in new window.
This graph shows personal saving as a percent of disposable personal income.
It is not unusual for the saving rate to decline at the beginning of a recovery as people become more confident. This helps drive consumer spending, but with the high levels of household debt, I expect the saving rate to increase over the rest of the year.
Here are some Q1 numbers (all annualized):
So the boost in PCE came from the decline in saving and the increase in benefits. That is not sustainable.
 The second graph shows real personal income less transfer payments as a percent of the previous peak.
Unlike the recovery in GDP, real personal income less transfer payments has barely increased and is still 6.6% below the pre-recession level.
The peak of the stimulus spending is in Q2 2010 (right now), and then the stimulus spending starts to taper off in the 2nd half of 2010. So underlying demand better increase soon - and that means jobs and incomes going forward.
Unfortunately residential investment is usually one of the key engines for employment and growth at the beginning of a recovery - and I expect RI to be sluggish all year because of the huge overhang of existing housing units. So my guess is the recovery will probably remain sluggish, and I still expect a slowdown in the 2nd half of 2010.
Friday, March 26, 2010
Q4 GDP Revised down to 5.6%
by Calculated Risk on 3/26/2010 08:18:00 AM
Real gross domestic product -- the output of goods and services produced by labor and property located in the United States -- increased at an annual rate of 5.6 percent in the fourth quarter of 2009 ... Real personal consumption expenditures increased 1.6 percent in the fourth quarter.The headline GDP number was revised down to 5.6% annualized growth in Q4 (from 5.9%). The following table shows the changes from the "advance estimate" to the "second estimate" to the "third estimate" for several key categories:
| Advance | Second Estimate | Third Estimate | |
|---|---|---|---|
| GDP | 5.7% | 5.9% | 5.6% |
| PCE | 2.0% | 1.7% | 1.6% |
| Residential Investment | 5.7% | 5.0% | 3.8% |
| Structures | -15.4% | -13.9% | -18.0% |
| Equipment & Software | 13.3% | 18.2% | 19.0% |
Friday, February 26, 2010
Q4 GDP Revised to 5.9%
by Calculated Risk on 2/26/2010 08:30:00 AM
The headline GDP number was revised up to 5.9% annualized growth in Q4 (from 5.7%), however most of the improvement in the revision came from changes in private inventories. Excluding inventory changes, GDP would have been revised down to around 1.9% from 2.2%.
This table shows the changes from the "advance estimate" to the "second estimate" for several key categories:
| Advance | Second Estimate | |
|---|---|---|
| GDP | 5.7% | 5.9% |
| PCE | 2.0% | 1.7% |
| Residential Investment | 5.7% | 5.0% |
| Structures | -15.4% | -13.9% |
| Equipment & Software | 13.3% | 18.2% |
Changes in private inventories are transitory (only lasts a few quarters at the start of a recovery), and although the headline number was revised up, final demand was weaker than in the advance estimate.
Saturday, January 30, 2010
Investment Contributions to GDP: Leading and Lagging
by Calculated Risk on 1/30/2010 11:15:00 AM
By request, the following graph is an update to: The Investment Slump in Q2
The following graph shows the rolling 4 quarter contribution to GDP from residential investment, equipment and software, and nonresidential structures. This is important to follow because residential investment tends to lead the economy, equipment and software is generally coincident, and nonresidential structure investment trails the economy.  Click on graph for larger image in new window.
Residential Investment (RI) has made a positive contribution to GDP the last two quarters, and the rolling four quarter change is moving up.
Equipment and software investment made a small positive contribution to GDP in Q3, and a larger contribution in Q4. The four quarter average is also moving up.
As expected, nonresidential investment in structures is now declining sharply as major projects are completed. The economy will recover long before nonresidential investment in structures recovers.
And as always, residential investment is the best leading indicator for the economy.
Friday, January 29, 2010
Real GDP: Declines from Prior Peak
by Calculated Risk on 1/29/2010 03:21:00 PM
This is an update to a graph I posted in early 2009 ... Click on graph for larger image in new window.
This graph shows the real GDP declines from the prior peak for post WWII recessions.
The recent recession was the worst since WWII (the peak decline was 3.83% in Q2 2009).
Even after the strong GDP growth in Q4 (due to inventory changes), current GDP is still 1.9% below the prior peak in real terms. If the recovery is sluggish - as I expect - it will take several more quarters to return to the pre-recession peak in real GDP.
A Few Comments on Q4 GDP Report
by Calculated Risk on 1/29/2010 10:57:00 AM
Any analysis of the Q4 GDP report has to start with the change in private inventories. This change contributed a majority of the increase in GDP, and annualized Q4 GDP growth would have been 2.3% without the transitory increase from inventory changes.
Unfortunately - although expected - the two leading sectors, residential investment (RI) and personal consumption expenditures (PCE), both slowed in Q4.
Note: for more on leading and lagging sectors, see Business Cycle: Temporal Order and Q1 GDP Report: The Good News.
It is not a surprise that both key leading sectors are struggling. The personal saving rate increased slightly to 4.6% in Q4, and I expect the saving rate to increase over the next year or two to around 8% - as households repair their balance sheets - and that will be a constant drag on PCE.
And there is no reason to expect a sustained increase in RI until the excess housing inventory is absorbed. In fact, based on recent reports of housing starts and new home sales, there is a good chance that residential investment will be a slight drag on GDP in Q1 2010.
 Click on graph for larger image in new window.
This graphs shows Residential investment (RI) as a percent of GDP since 1947.
RI had declined for 14 consecutive quarters before the increase in Q3 2009. The Q4 report puts RI as a percent of GDP at just over 2.5%, barely above the record low - since WWII - set in Q2 2009.
Notice that RI usually recovers very quickly coming out of a recession. This time RI is moving sideways - not a good sign for a robust recovery in 2010.
 The second graph shows non-residential investment as a percent of GDP.
Business investment in equipment and software increased 13.3% (annualized). This is a good sign, but continued investment probably depends on increases in underlying demand.
Investment in non-residential structures was only off 15.4% (annualized) and will probably be revised down (this has happened for the last few quarters). I expect non-residential investment in structures to continue to decline sharply over the next several quarters. In previous downturns the economy recovered long before nonresidential investment in structures recovered - and that will probably be true again this time.
When the supplemental data is released, I'll post graphs of investment in retail, offices, and hotels, and a breakdown of residential investment.
The transitory boost from inventory changes is frequently a great kick start to the economy at the beginning of a recovery - as long as the leading sectors (PCE and RI) are also picking up. This report has to be viewed as concerning ... and is reminiscent of Q1 1981 and Q1 2002 ... both examples of inventory changes making large contributions to GDP, but underlying growth remained weak.
BEA: GDP Increases at 5.7% Annual Rate in Q4
by Calculated Risk on 1/29/2010 08:30:00 AM
As expected, GDP growth in Q4 was driven by changes in private inventories, adding 3.39% to GDP.
From the BEA:
Real gross domestic product -- the output of goods and services produced by labor and property located in the United States -- increased at an annual rate of 5.7 percent in the fourth quarter of 2009, (that is, from the third quarter to the fourth quarter), according to the "advance" estimate released by the Bureau of Economic Analysis.This is very close to my expectations and shows a fairly weak economy (real PCE increase 2.0%). The question is: what happens in 2010?
...
The increase in real GDP in the fourth quarter primarily reflected positive contributions from private inventory investment, exports, and personal consumption expenditures (PCE). Imports, which are a subtraction in the calculation of GDP, increased.
The acceleration in real GDP in the fourth quarter primarily reflected an acceleration in private inventory investment, a deceleration in imports, and an upturn in nonresidential fixed investment that were partly offset by decelerations in federal government spending and in PCE.
...
Real personal consumption expenditures increased 2.0 percent in the fourth quarter, compared with an increase of 2.8 percent in the third.
...
Real nonresidential fixed investment increased 2.9 percent in the fourth quarter, in contrast to a decrease of 5.9 percent in the third. Nonresidential structures decreased 15.4 percent, compared with a decrease of 18.4 percent. Equipment and software increased 13.3 percent, compared with an increase of 1.5 percent. Real residential fixed investment increased 5.7 percent, compared with an increase of 18.9 percent.
I'll have some more on GDP and investment later ...
Saturday, January 16, 2010
Q4 GDP: Beware the Blip
by Calculated Risk on 1/16/2010 02:24:00 PM
In a research note released last night, Goldman Sachs raised their estimate of Q4 GDP from 4.0% to 5.8%. They cautioned that the "headline will be an eye-popper", but that this growth is mostly due to inventory changes: "More than two-thirds of our estimated increase comes from a sudden stabilization in inventories". They also noted "anything between 4½% and 7% is possible given the volatility of the inventory data".
The rest of the note cautions on 2010, and Goldman still sees sluggish growth of just under 2.0% with the unemployment rate peaking in early 2011.
This is what we've been discussing - GDP boosted by inventory changes in the 2nd half of 2009, followed by sluggish growth in 2010.
San Francisco Fed President described the impact of inventory changes back in September: The Outlook for Recovery in the U.S. Economy
I expect the biggest source of expansion in the second half of this year to come from a diminished pace of inventory liquidation by manufacturers, wholesalers, and retailers. Such a pattern is typical of business cycles. Inventory investment often is the catalyst for economic recoveries. True, the boost is usually fairly short-lived, but it can be quite important in getting things going. ...But what if this doesn't "get things going"?
When was the last time we saw 5%+ GDP growth, due mostly to inventory changes, and increasing unemployment? It was in Q1 1981.
The 1980 recession ended in Q3 1980, and inventory changes boosted Q4 GDP by 3.8%, and Q1 1981 GDP by an amazing 6.4%! However underlying demand remained weak (as defined by GDP ex-inventory changes, and PCE) as shown in the following table:
| 1980-IV | 1981-I | 1981-II | 2009-III | 2009-IV1 | |
|---|---|---|---|---|---|
| GDP | 7.6% | 8.6% | -3.2% | 2.2% | 5.8%est |
| GDP ex-Inventory Changes | 3.8% | 2.2% | 0.8% | 1.5% | 2.0%est |
| PCE | 3.4% | 1.5% | 0.0% | 2.0% | 1.7%est |
| Change in Unemployment Rate | -0.3% | 0.2% | 0.1% | 0.3% | 0.2% |
Look at the blue period, and notice the boost in GDP from inventory changes in the Q4 1980, and Q1 1981. But PCE was only 1.5% in Q1 1980, and fell to 0.0% in Q2 1980. Since there was no pickup in underlying demand, the economy slid back into recession in July 1981.
Now the causes of the current recession are very different from the early '80s, but once again we are seeing a transitory boost from inventory changes and underlying demand remains weak. With the huge overhang of existing home inventory and record rental vacancies, and the ongoing repair of household balance sheets, I expect underlying demand to remain weak in 2010.
The blip in the 2nd half from inventory changes was expected, and I expect Q4 to be the best quarter for GDP for some time.
1 Q4 2009 is estimated. GDP is from Goldman Sachs, and ex-inventory and PCE is from my own estimate.
Saturday, December 26, 2009
Inventories and Q4 GDP
by Calculated Risk on 12/26/2009 05:49:00 PM
Back in October, as a preview to the Q3 GDP report, I wrote: Inventory Restocking and Q3 GDP
I noted that GDP growth in Q3 and Q4 weren't in question because of a transitory boost from changes in private inventories and from stimulus spending.
Here is a repeat of the graph showing the contributions to GDP from changes in private inventories for the last several recessions. The blue shaded area is the last two quarters of each recession, and the light area is the first four quarters of each recovery. Click on graph for larger image in new window.
The Red line is the median of the last 5 recessions - and indicates about a 2% contribution to GDP from changes in inventories, for each of the first two quarters coming out of a recession.
The key is this boost is transitory.
Last quarter I thought a 1% to 2% contribution from changes in inventories was possible. The actual contribution was 0.69%. I suspect that changes in inventories will add more to Q4; probably closer to 2%.
I also thought Personal Consumption Expenditures (PCE) would be fairly strong in Q3, especially because of the cash-for-clunkers program. My guess was "3% PCE growth in Q3, and that would mean a contribution to GDP of about 2%." The final numbers were 2.8% and a contribution of 1.96%.
The following graph shows real Personal Consumption Expenditures (PCE) through November 2009 (in 2005 dollars). Note that the y-axis doesn't start at zero to better show the change. The quarterly change in PCE is based on the change from the average in one quarter, compared to the average of the preceding quarter.
The colored rectangles show the quarters, and the blue bars are the real monthly PCE.
Using the "two-month method" for estimating Q4 PCE growth gives an estimate of just under 1%. However - note that PCE in August was distorted by the cash-for-clunkers program (and that impacts the two-month method). So my guess is PCE growth in Q4 will be around 1.7% or a contribution to GDP of 1.2% or so. (less than the growth in Q3).
As I've noted, residential investment has been moving sideways, although that will show up more in Q1 2010 than in Q4. So we can add in a positive contributions from net exports, some increase in residential investment (although smaller than in Q3), an increase in equipment and software investment - and subtract out investment in non-residential structures - and Q4 should look pretty healthy.
In a reserach note this week, Ed McKelvey at Goldman Sachs called the 2nd half "ho-hum":
"At a time of the year when ho-ho-ho is the catchword, the first six months of the US economic recovery look distinctly ho-hum following the latest reports. ... Although we continue to estimate a 4% growth rate for the fourth quarter, with upside risk to that figure, the composition of this growth is not strong. Almost half of it comes from a sharp slowing in the rate at which inventories are being drawn down ..."
 And it is probably a good time to repeat this graph from economy.com's Mark Zandi suggesting the greatest impact from the stimulus package is now behind us.
This suggests that all of the growth in Q3 was due to the stimulus package (and then some), and the impact is now waning - only 2% in Q4, and 1.5% in Q1 2010 - and then the impact on GDP growth will be negative in the 2nd half of 2010.
As "ho-hum" as the 2nd half of 2009 was, I expect GDP growth to be more sluggish in 2010 for the following reasons:
So I still think GDP growth will be sluggish in 2010, with downside risks.
Note: There are several upside and downside risks to this view.
Tuesday, December 22, 2009
Q3 GDP Revised Down to 2.2%
by Calculated Risk on 12/22/2009 08:28:00 AM
Real gross domestic product -- the output of goods and services produced by labor and property located in the United States -- increased at an annual rate of 2.2 percent in the third quarter of 2009 ...GDP was revised down from the advance estimated of 3.5% to the preliminary estimate of 2.8%, and now to 2.2%.
Personal consumption expenditures (PCE) were revised down to 2.8% from 2.9%.
And investment in nonresidential structures was revised down to -18.4% from -15.1% (aka falling off a cliff).
Thursday, October 29, 2009
Random Thoughts on the Q3 GDP Report
by Calculated Risk on 10/29/2009 07:29:00 PM
After the Q1 GDP report was released, I wrote: GDP Report: The Good News. The headline number in Q1 was ugly, but there was a clear shift in the negative GDP contributions from leading sectors to lagging sectors.
Here is a repeat of the table from that earlier post showing a simplified typical temporal order for emerging from a recession:
| During Recession | Lags End of Recession | Significantly Lags End of Recession | |
| Residential Investment | Investment, Equipment & Software | Investment, non-residential Structures | |
| PCE | Unemployment(1) | ||
(1) In recent recessions, unemployment significantly lagged the end of the recession. That is very likely this time too.
Now look at the Q3 GDP report from leading to lagging sectors:
This is exactly what I'd expect a recovery to look like.
Unfortunately ... the two leading sectors, residential investment (RI) and personal consumption expenditures (PCE), will both be under pressure for some time. The Census Bureau report this morning showed that there are still far too many excess housing units (homes and rental units) available. There cannot be a sustained recovery in RI without a boom in new home sales and housing starts, and it is difficult to imagine a boom in new home sales with the large overhang of housing units.
It takes household formation to reduce the excess inventory, and household formation requires job creation so that individuals and families will feel more confident and move out of their parent's basements. Some day there will be a boom in household formation, once job creation returns, but usually the first jobs in a recovery are from RI and PCE - so the economy is in sort of a circular trap.
That is why we need policies aimed at job creation and household formation. As housing economist Tom Lawler wrote today in a note to clients: "policies that move renter households into owned homes but that don't stimulate household formations MAKE MATTERS WORSE!"
And the other leading sector, PCE, is also under pressure. The personal saving rate declined in Q3 to 3.3%, but the decline was probably temporary. I expect the saving rate to increase over the next year or two to around 8% - as households repair their balance sheets - and that will be a constant drag on PCE.
I expect Q4 GDP to be similar to Q3, however I think growth in 2010 will be sluggish - with downside risks. I think RI and PCE will be sluggish in 2010, and the stimulus will fade (and become a drag in the 2nd half of 2010).
Here is a look at investment:
 Click on graph for larger image in new window.
Residential investment (RI) had declined for 14 consecutive quarters, and the increase in Q3 2009 was the first since 2005.
This puts RI as a percent of GDP at 2.5%, just barely above the record low - since WWII - set last quarter.
 The second graph shows non-residential investment as a percent of GDP.
Business investment in equipment and software increased 1.1% (annualized), breaking a streak of 6 consecutive quarterly declines.
Investment in non-residential structures was only off 9.0% (annualized) and will probably be revised down (this happened last quarter). I expect non-residential investment in structures to decline sharply over the next several quarters. In previous downturns the economy recovered long before nonresidential investment in structures recovered - and that will probably be true again this time.
When the supplemental data is released, I'll post graphs of investment in retail, offices, and hotels, and a breakdown of residential investment.
Some possibly interesting notes:


