 RSS Feed
 by Calculated Risk on 5/26/2022 07:00:00 AM
Thursday, May 26, 2022
MBA: "Mortgage Application Payments Jumped 8.8 Percent to $1,889 in April"
This is a new monthly affordability index from the Mortgage Bankers Association (MBA).
From the MBA: Mortgage Application Payments Jumped 8.8 Percent to $1,889 in April
Homebuyer affordability decreased in April, with the national median payment applied for by applicants rising 8.8 percent to $1,889 from $1,736 in March. This is according to the Mortgage Bankers Association's (MBA) Purchase Applications Payment Index (PAPI), which measures how new monthly mortgage payments vary across time – relative to income – using data from MBA’s Weekly Applications Survey (WAS).This will likely increase further in May.
“Rapid home-price growth, low inventory, and an 80-basis-point surge in mortgage rates slowed purchase applications in April, with the typical borrower’s principal and interest payment increasing $153 from March and $569 from a year ago,” said Edward Seiler, MBA's Associate Vice President, Housing Economics, and Executive Director, Research Institute for Housing America. “Despite strong employment and wage growth, housing affordability has worsened since the start of the year. Mortgage payments are taking up a larger share of homebuyers’ incomes, and sky-high inflation is making it more difficult for some would-be buyers to save for a down payment or come up with the additional cash they need to afford a higher monthly payment.”
Added Seiler, “MBA’s updated forecast calls for mortgage rates to remain above 5 percent for most of 2022, but prospective homebuyers should start to see moderation from the double-digit price appreciation reported for well over a year in most of the country.”
Click on graph for larger image.
The national PAPI (Figure 1) increased 7.8 percent to 162.7 in April from 150.9 in March, meaning payments on new mortgages take up a larger share of a typical person’s income. Compared to April 2021 (120.2), the index jumped 27.0 percent. For borrowers applying for lower-payment mortgages (the 25th percentile), the national mortgage payment increased 9.6 percent to $1,236 from $1,129 in March.
emphasis added

Wednesday, May 25, 2022
Thursday: GDP, Unemployment Claims, Pending Home Sales
by Calculated Risk on 5/25/2022 09:01:00 PM
Thursday:
• At 8:30 AM ET, The initial weekly unemployment claims report will be released. The consensus is for 220 thousand up from 218 thousand last week.
• Also at 8:30 AM, Gross Domestic Product, 1st quarter 2021 (Second estimate). The consensus is that real GDP decreased 1.3% annualized in Q1, up from the advance estimate of -1.4%.
• At 10:00 AM, Pending Home Sales Index for April. The consensus is for a 1.9% decrease in the index.
• At 11:00 AM, the Kansas City Fed manufacturing survey for May.
On COVID (focus on hospitalizations and deaths):
| COVID Metrics | ||||
|---|---|---|---|---|
| Now | Week Ago | Goal | ||
| Percent fully Vaccinated | 66.6% | --- | ≥70.0%1 | |
| Fully Vaccinated (millions) | 221.1 | --- | ≥2321 | |
| New Cases per Day3🚩 | 104,399 | 99,215 | ≤5,0002 | |
| Hospitalized3🚩 | 19,724 | 16,965 | ≤3,0002 | |
| Deaths per Day3🚩 | 288 | 273 | ≤502 | |
| 1 Minimum to achieve "herd immunity" (estimated between 70% and 85%). 2my goals to stop daily posts, 37-day average for Cases, Currently Hospitalized, and Deaths 🚩 Increasing 7-day average week-over-week for Cases, Hospitalized, and Deaths ✅ Goal met. | ||||
 Click on graph for larger image.
This graph shows the daily (columns) and 7-day average (line) of deaths reported.
Average daily deaths bottomed in July 2021 at 214 per day.
Philly Fed: State Coincident Indexes Increased in 50 States in April
by Calculated Risk on 5/25/2022 04:09:00 PM
From the Philly Fed:
The Federal Reserve Bank of Philadelphia has released the coincident indexes for the 50 states for April 2022. Over the past three months, the indexes increased in all 50 states, for a three-month diffusion index of 100. Additionally, in the past month, the indexes increased in all 50 states, for a one-month diffusion index of 100. For comparison purposes, the Philadelphia Fed has also developed a similar coincident index for the entire United States. The Philadelphia Fed’s U.S. index increased 1.1 percent over the past three months and 0.3 percent in April.Note: These are coincident indexes constructed from state employment data. An explanation from the Philly Fed:
emphasis added
The coincident indexes combine four state-level indicators to summarize current economic conditions in a single statistic. The four state-level variables in each coincident index are nonfarm payroll employment, average hours worked in manufacturing by production workers, the unemployment rate, and wage and salary disbursements deflated by the consumer price index (U.S. city average). The trend for each state’s index is set to the trend of its gross domestic product (GDP), so long-term growth in the state’s index matches long-term growth in its GDP.
 Click on map for larger image.
Here is a map of the three-month change in the Philly Fed state coincident indicators. This map was all red during the worst of the Pandemic and also at the worst of the Great Recession.
The map is all positive on a three-month basis.
Source: Philly Fed.
 And here is a graph is of the number of states with one month increasing activity according to the Philly Fed.
 This graph includes states with minor increases (the Philly Fed lists as unchanged).
In April all 50 states had increasing activity including minor increases.
In April all 50 states had increasing activity including minor increases.
FOMC Minutes: "Risks to inflation were skewed to the upside"; 50bp increases likely appropriate at next couple of meetings
by Calculated Risk on 5/25/2022 02:07:00 PM
From the Fed: Minutes of the Federal Open Market Committee, May 3–4, 2022. Excerpt on the "Plans for Reducing the Size of the Balance Shee"t:
In their discussion of risks to the outlook, participants emphasized that they were highly attentive to inflation risks and would continue to monitor closely inflation developments and inflation expectations. They agreed that risks to inflation were skewed to the upside and cited several such risks, including those associated with ongoing supply bottlenecks and rising energy and commodity prices—both of which were exacerbated by the Russian invasion of Ukraine and COVID-related lockdowns in China. Also mentioned were the risks associated with nominal wage growth continuing to run above levels consistent with 2 percent inflation over time and the extent to which households' high savings since the onset of the pandemic and healthy balance sheets would support greater-than-expected underlying momentum in consumer spending and contribute to upside inflation pressures. In addition, some participants emphasized that persistently high inflation heightened the risk that longer-term inflation expectations could become unanchored; in that case, the task of returning inflation to 2 percent would be more difficult. Uncertainty about real activity was also seen as elevated. Various participants noted downside risks to the outlook, including risks associated with the Russian invasion and COVID-related lockdowns in China and the likelihood of a prolonged rise in energy and commodity prices.
Several participants who commented on issues related to financial stability noted that the tightening of monetary policy could interact with vulnerabilities related to the liquidity of markets for Treasury securities and to the private sector's intermediation capacity. A couple of participants pointed to increased risks in financial markets linked to commodities following Russia's invasion of Ukraine, which had led to higher prices and volatility across a wide range of energy, agricultural, and metal products. These participants observed that the trading and risk-management practices of some key participants in commodities markets were not fully visible to regulatory authorities and noted that central counterparties (CCPs) needed to remain capable of managing risks associated with heightened volatility or that margin requirements at CCPs could give rise to significant liquidity demands for large banks, broker-dealers, and their clients.
In their consideration of the appropriate stance of monetary policy, all participants concurred that the U.S. economy was very strong, the labor market was extremely tight, and inflation was very high and well above the Committee's 2 percent inflation objective. Against this backdrop, all participants agreed that it was appropriate to raise the target range for the federal funds rate 50 basis points at this meeting. They further anticipated that ongoing increases in the target range for the federal funds rate would be warranted to achieve the Committee's objectives. Participants also agreed that it was appropriate to start reducing the size of the Federal Reserve's balance sheet on June 1, as described in the Plans for Reducing the Size of the Federal Reserve's Balance Sheet that would be issued in conjunction with the postmeeting statement. Participants judged that an appropriate firming of the stance of monetary policy, along with an eventual waning of supply–demand imbalances, would help to keep longer-term inflation expectations anchored and bring inflation down over time to levels consistent with the Committee's 2 percent longer-run goal.
All participants reaffirmed their strong commitment and determination to take the measures necessary to restore price stability. To this end, participants agreed that the Committee should expeditiously move the stance of monetary policy toward a neutral posture, through both increases in the target range for the federal funds rate and reductions in the size of the Federal Reserve's balance sheet. Most participants judged that 50 basis point increases in the target range would likely be appropriate at the next couple of meetings. Many participants assessed that the Committee's previous communications had been helpful in shifting market expectations regarding the policy outlook into better alignment with the Committee's assessment and had contributed to the tightening of financial conditions.
All participants supported the plans for reducing the size of the balance sheet. This reduction, starting on June 1, would work in parallel with increases in the target range for the policy rate in firming the stance of monetary policy. A number of participants remarked that, after balance sheet runoff was well under way, it would be appropriate for the Committee to consider sales of agency MBS to enable suitable progress toward a longer-run SOMA portfolio composed primarily of Treasury securities. Any program of sales of agency MBS would be announced well in advance. Regarding risks related to the balance sheet reduction, several participants noted the potential for unanticipated effects on financial market conditions.
Participants agreed that the economic outlook was highly uncertain and that policy decisions should be data dependent and focused on returning inflation to the Committee's 2 percent goal while sustaining strong labor market conditions. At present, participants judged that it was important to move expeditiously to a more neutral monetary policy stance. They also noted that a restrictive stance of policy may well become appropriate depending on the evolving economic outlook and the risks to the outlook. Participants observed that developments associated with Russia's invasion of Ukraine and the COVID-related lockdowns in China posed heightened risks for both the United States and economies around the world. Several participants commented on the challenges that monetary policy faced in restoring price stability while also maintaining strong labor market conditions. In light of the high degree of uncertainty surrounding the economic outlook, participants judged that risk-management considerations would be important in deliberations over time regarding the appropriate policy stance. Many participants judged that expediting the removal of policy accommodation would leave the Committee well positioned later this year to assess the effects of policy firming and the extent to which economic developments warranted policy adjustments.
emphasis added
The Household Mystery: Part II
by Calculated Risk on 5/25/2022 09:51:00 AM
Today, in the Calculated Risk Real Estate Newsletter: The Household Mystery: Part II
Brief excerpt:
Recently there have been two papers that shed some light on this mystery.You can subscribe at https://calculatedrisk.substack.com/.
From SF Fed economist John A. Mondragon and Professor Johannes Wieland: Housing Demand and Remote Work. The authors showed that areas with more work from home (WFH) saw larger house price increases.In this paper we show that the shift to remote work caused a large increase in housing demand. In turn, this increase in housing demand caused house prices and rents to increase sharply. Based on our cross-sectional estimates controlling for migration spillovers, we argue that remote work accounts for at least one half of the 24% increase in house prices from December 2019 to November 2021.And from Federal Reserve economists Daniel García and Andrew Paciorek: The Remarkable Recent Rebound in Household Formation and the Prospects for Future Housing Demand
emphasis added ©Mondragon and WielandThis note updates our previous work on household formation and living arrangements from the summer of 2020. At that early stage in the pandemic, the data showed a dramatic decline in headship rates as millions of Americans changed their living arrangements, many by remaining with or moving back in with parents and older relatives. …Putting these two papers together - it is very possible that work-from-home drove some of the likely sources of household formation over the last 18 months.
In contrast, over the past year and a half there has been a remarkable rebound in the headship rate, driven in large part by a return to the pre-pandemic rates at which younger adults lived with parents or older family members. This rebound has been an important contributor to a huge increase in housing demand.
MBA: Mortgage Applications Decrease in Latest Weekly Survey
by Calculated Risk on 5/25/2022 07:00:00 AM
From the MBA: Mortgage Applications Decrease in Latest MBA Weekly Survey
Mortgage applications decreased 1.2 percent from one week earlier, according to data from the Mortgage Bankers Association’s (MBA) Weekly Mortgage Applications Survey for the week ending May 20, 2022.
... The Refinance Index decreased 4 percent from the previous week and was 75 percent lower than the same week one year ago. The seasonally adjusted Purchase Index increased 0.2 percent from one week earlier. The unadjusted Purchase Index decreased 1 percent compared with the previous week and was 16 percent lower than the same week one year ago.
“The 30-year fixed rate declined for the second straight week to 5.46 percent but remains well above what borrowers were used to over the past two years. Most refinance borrowers continue to remain on the sidelines as a result, and refinance applications have fallen in nine of the past 10 weeks. Compared to January 2022, refinance activity is down 66 percent,” said Joel Kan, MBA’s Associate Vice President of Economic and Industry Forecasting. “Higher mortgage rates are also impacting purchase market conditions, as the purchase index remained close to lows last seen in the spring of 2020 when a significant portion of activity was put on hold due to the onset of the pandemic. Currently, higher rates, low inventory, and high prices are keeping prospective buyers out of the market.”
The refinance share of mortgage activity decreased to 32.3 percent of total applications from 33.0 percent the previous week. The adjustable-rate mortgage (ARM) share of activity decreased to 9.4 percent of total applications.
...
The average contract interest rate for 30-year fixed-rate mortgages with conforming loan balances ($647,200 or less) decreased to 5.46 percent from 5.49 percent, with points decreasing to 0.60 from 0.74 (including the origination fee) for 80 percent loan-to-value ratio (LTV) loans.
emphasis added
 Click on graph for larger image.
The first graph shows the refinance index since 1990.
With higher mortgage rates, the refinance index has declined sharply over the last several months.
The refinance index is at the lowest level since December 2018.
The second graph shows the MBA mortgage purchase index
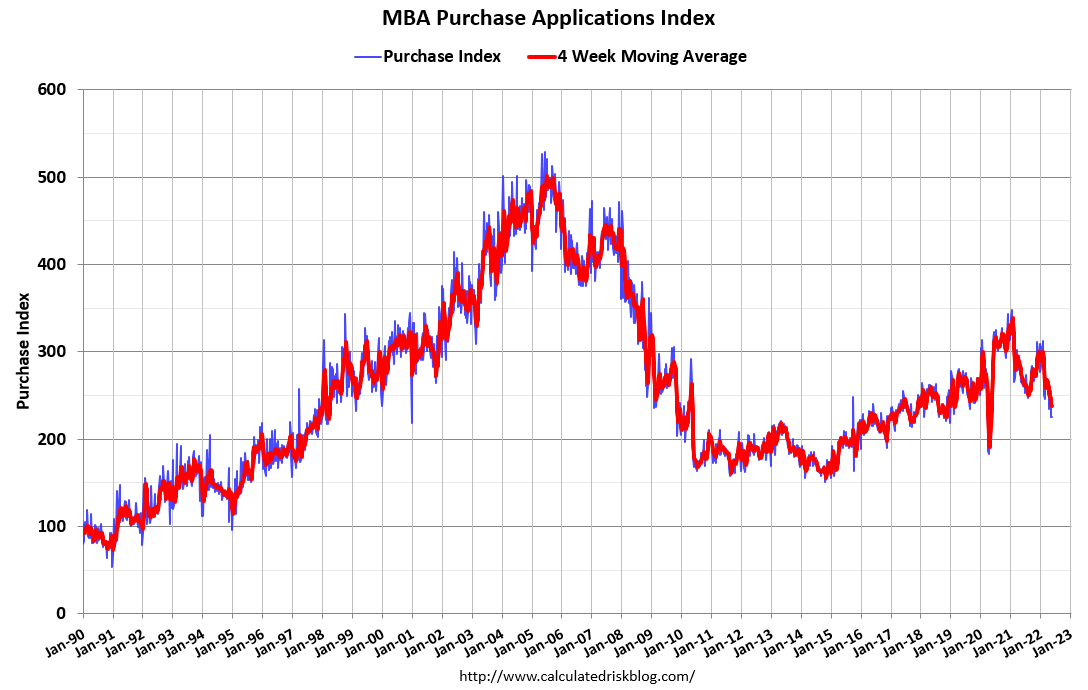 According to the MBA, purchase activity is down 16% year-over-year unadjusted.
Note: Red is a four-week average (blue is weekly).
Tuesday, May 24, 2022
Wednesday: Durable Goods, FOMC Minutes
by Calculated Risk on 5/24/2022 09:01:00 PM
Wednesday:
• At 7:00 AM ET, The Mortgage Bankers Association (MBA) will release the results for the mortgage purchase applications index.
• At 8:30 AM, Durable Goods Orders for April from the Census Bureau. The consensus is for a 0.6% increase in durable goods orders.
• At 2:00 PM, FOMC Minutes, Minutes Meeting of May 3-4, 2022
On COVID (focus on hospitalizations and deaths):
| COVID Metrics | ||||
|---|---|---|---|---|
| Now | Week Ago | Goal | ||
| Percent fully Vaccinated | 66.6% | --- | ≥70.0%1 | |
| Fully Vaccinated (millions) | 221.0 | --- | ≥2321 | |
| New Cases per Day3🚩 | 104,480 | 95,207 | ≤5,0002 | |
| Hospitalized3🚩 | 19,218 | 16,424 | ≤3,0002 | |
| Deaths per Day3 | 279 | 284 | ≤502 | |
| 1 Minimum to achieve "herd immunity" (estimated between 70% and 85%). 2my goals to stop daily posts, 37-day average for Cases, Currently Hospitalized, and Deaths 🚩 Increasing 7-day average week-over-week for Cases, Hospitalized, and Deaths ✅ Goal met. | ||||
 Click on graph for larger image.
This graph shows the daily (columns) and 7-day average (line) of deaths reported.
Average daily deaths bottomed in July 2021 at 214 per day.
FDIC: Problem Banks Declined, Residential REO Increased Slightly in Q1 2022
by Calculated Risk on 5/24/2022 02:09:00 PM
The FDIC released the Quarterly Banking Profile for Q1 2022 this morning:
Net income fell by $17.0 billion (22.2 percent) to $59.7 billion in first quarter 2022 from the year-ago quarter.
...
Total assets increased $253.9 billion (1.1 percent) from fourth quarter 2021 to $24.0 trillion. Cash and balances due from depository institutions declined $183.5 billion (5.2 percent) from fourth quarter 2021. Total loan and lease balances increased $109.9 billion (1.0 percent), federal funds sold increased 48.3 billion (8.1 percent), and securities rose $14.6 billion (0.2 percent). Growth in U.S. Treasury securities (up $37.9 billion, or 2.6 percent) continued to drive the quarterly increases in total securities. The proportion of securities to total assets declined slightly to 26.1 percent from the QBP high of 26.3 percent reported in fourth quarter 2021.
Loans and leases 90 days or more past due or in nonaccrual status (noncurrent loan balances) declined (down $4.5 billion, or 4.5 percent) from fourth quarter 2021, supporting a 5 basis point reduction in the noncurrent rate to 0.84 percent. The noncurrent rate was just 14 basis points above the historical low reported in second quarter 2006. Noncurrent 1–4 family residential real estate loan balances declined most among noncurrent loan categories (down $4.8 billion, or 10.5 percent).
emphasis added
 Click on graph for larger image.
The FDIC reported the number of problem banks declined to 40.
The number of FDIC-insured institutions declined from 4,839 in fourth quarter 2021 to 4,796. In first quarter, 3 banks opened and 44 institutions merged with other FDIC-insured institutions. The number of banks on the FDIC’s “Problem Bank List” declined by 4 from fourth quarter to 40, the lowest level since QBP data collection began in 1984. Total assets of problem banks increased $3.0 billion to $173.1 billion.11 No banks failed in the first quarter.This graph from the FDIC shows the number of problem banks and assets at problem institutions.
Note: The number of assets for problem banks increased significantly back in 2018 when Deutsche Bank Trust Company Americas was added to the list. An even larger bank was added to the list last year, although the identity of the bank is unclear.
 The dollar value of 1-4 family residential Real Estate Owned (REOs, foreclosure houses) increased slightly from $779 million in Q4 2021 to $788 million in Q1 2022.
 This graph shows the nominal dollar value of Residential REO for FDIC insured institutions. Note: The FDIC reports the dollar value and not the total number of REOs.
U.S. Births increased Slightly in 2021, First increase since 2014
by Calculated Risk on 5/24/2022 12:16:00 PM
From the National Center for Health Statistics: Births: Provisional Data for 2021. The NCHS reports:
The provisional number of births for the United States in 2021 was 3,659,289, up 1% from 2020 and the first increase in the number of births since 2014.Here is a long-term graph of annual U.S. births through 2021.
The general fertility rate was 56.6 births per 1,000 women aged 15–44, up 1% from 2020 and the first increase in the rate since 2014. The total fertility rate was 1,663.5 births per 1,000 women in 2021, up 1% from 2020. Birth rates declined for women in age groups 15–24, rose for women in age groups 25–49, and was unchanged for adolescents aged 10–14 in 2021. The birth rate for teenagers aged 15–19 declined by 6% in 2021 to 14.4 births per 1,000 females; rates declined for both younger (aged 15–17) and older (aged 18–19) teenagers.
emphasis added
 Click on graph for larger image.
Births had declined for six consecutive years following increases in 2013 and 2014.
Note the amazing decline in teenage births.
With fewer births, and less net migration, demographics are not as favorable as once expected.
There is much more in the report.
April New Home Sales Decline Sharply, almost 6 Months of Inventory Under Construction
by Calculated Risk on 5/24/2022 10:54:00 AM
Today, in the Calculated Risk Real Estate Newsletter: April New Home Sales Decline Sharply, almost 6 Months of Inventory Under Construction
Brief excerpt:
The next graph shows the months of supply by stage of construction. “Months of supply” is inventory at each stage, divided by the sales rate.You can subscribe at https://calculatedrisk.substack.com/.
The inventory of completed homes for sale was at 38 thousand in April, up from the record low of 32 thousand in several months in 2021 and early 2022. That is just over 0.8 months of completed supply (red line). This is lower than the normal level.
The inventory of new homes under construction is at 5.9 months (blue line) - well above the normal level. This elevated level of homes under construction is due to supply chain constraints. This is close to the record set in 1980.
And 118 thousand homes have not been started - about 2.4 months of supply (grey line) - almost double the normal level. Homebuilders are probably waiting to start some homes until they have a firmer grasp on prices and demand.


