 RSS Feed
 by Calculated Risk on 5/27/2022 12:34:00 PM
Friday, May 27, 2022
Las Vegas April 2022: Visitor Traffic Down 4.5% Compared to 2019
Note: I like using Las Vegas as a measure of recovery for both leisure (visitors) and business (conventions).
From the Las Vegas Visitor Authority: April 2022 Las Vegas Visitor Statistics
The pandemic recovery continued in April with strengthening visitation as the destination hosted nearly 3.4M visitors, roughly 31% ahead of last April and less than 5% behind April 2019.
Overall hotel occupancy reached 84%, up approx. 18.4 pts YoY and down only 7 pts vs. April 2019. Weekend occupancy exceeded 93% (up 9.7 pts YoY and down 3.5 pts vs. April 2019) and Midweek occupancy exceeded 79% (up 21.5 pts YoY and down 9.5 pts vs. April 2019).
Breaking the previous monthly record set just this past October, ADR exceeded $177, 62% ahead of last April and nearly 36% above pre‐COVID levels of April 2019 while RevPAR approached $149 for the month, dramatically ahead of April 2021 (+107.4%) and 25.4% over April 2019.
 Click on graph for larger image.
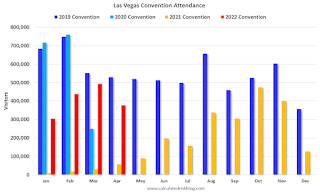
 The first graph shows visitor traffic for 2019 (dark blue), 2020 (light blue), 2021 (yellow) and 2022 (red)
Visitor traffic was down 4.5% compared to the same month in 2019.
Visitor traffic was up 31% compared to last April.
The second graph shows convention traffic.
Convention traffic was down 28.7% compared to April 2019.The second graph shows convention traffic.

Note: There was almost no convention traffic from April 2020 through May 2021.
Update: Delinquencies, Foreclosures and REO
by Calculated Risk on 5/27/2022 10:22:00 AM
Today, in the Calculated Risk Real Estate Newsletter: Update: Delinquencies, Foreclosures and REO
A brief excerpt:
Last year, I pointed out that the foreclosure moratorium, combined with the expiration of a large number of forbearance plans, would NOT lead to a surge in foreclosures and impact house prices (as happened following the housing bubble).There is much more in the article. You can subscribe at https://calculatedrisk.substack.com/
...
Here is some data on REOs through Q1 2022 …
...
We will probably see an increase in REOs in 2022.
This graph shows the nominal dollar value of Residential REO for FDIC insured institutions. Note: The FDIC reports the dollar value and not the total number of REOs.
The dollar value of 1-4 family residential Real Estate Owned (REOs, foreclosure houses) increased slightly from $779 million in Q4 2021 to $788 million in Q1 2022. (Probably declined in 2020 and 2021 due to foreclosure moratoriums, forbearance programs and house price increases).
...
The bottom line is there will be an increase in foreclosures this year (from record low levels), but it will not be a huge wave of foreclosures as happened following the housing bubble. The distressed sales during the housing bust led to cascading price declines, and that will not happen this time.

Personal Income increased 0.4% in April; Spending increased 0.9%
by Calculated Risk on 5/27/2022 08:38:00 AM
The BEA released the Personal Income and Outlays report for April:
Personal income increased $89.3 billion (0.4 percent) in April, according to estimates released today by the Bureau of Economic Analysis. Disposable personal income (DPI) increased $48.3 billion (0.3 percent) and personal consumption expenditures (PCE) increased $152.3 billion (0.9 percent).The April PCE price index increased 6.3 percent year-over-year (YoY), down from 6.6 percent YoY in March.
Real DPI increased less than 0.1 percent in April and Real PCE increased 0.7 percent; goods increased 1.0 percent and services increased 0.5 percent. The PCE price index increased 0.2 percent. Excluding food and energy, the PCE price index increased 0.3 percent (
emphasis added
The PCE price index, excluding food and energy, increased 4.9 percent YoY, down from 5.3% in March.
The following graph shows real Personal Consumption Expenditures (PCE) through April 2022 (2012 dollars). Note that the y-axis doesn't start at zero to better show the change.
 Click on graph for larger image.
The dashed red lines are the quarterly levels for real PCE.
Personal income was below expectations, and the increase in PCE was above expectations.
Inflation was at expectations (lower YoY increase than in March).
Thursday, May 26, 2022
Friday: Personal Income & Outlays
by Calculated Risk on 5/26/2022 09:01:00 PM
Friday:
• At 8:30 AM ET: Personal Income and Outlays, April 2021. The consensus is for a 0.6% increase in personal income, and for a 0.7% increase in personal spending. And for the Core PCE price index to increase 0.3%. PCE prices are expected to be up 6.3% YoY, and core PCE prices up 4.9% YoY.
• At 10:00 AM: University of Michigan's Consumer sentiment index (Final for May). The consensus is for a reading of 59.1.
On COVID (focus on hospitalizations and deaths):
| COVID Metrics | ||||
|---|---|---|---|---|
| Now | Week Ago | Goal | ||
| Percent fully Vaccinated | 66.6% | --- | ≥70.0%1 | |
| Fully Vaccinated (millions) | 221.1 | --- | ≥2321 | |
| New Cases per Day3🚩 | 109,564 | 101,091 | ≤5,0002 | |
| Hospitalized3🚩 | 19,949 | 17,491 | ≤3,0002 | |
| Deaths per Day3🚩 | 305 | 278 | ≤502 | |
| 1 Minimum to achieve "herd immunity" (estimated between 70% and 85%). 2my goals to stop daily posts, 37-day average for Cases, Currently Hospitalized, and Deaths 🚩 Increasing 7-day average week-over-week for Cases, Hospitalized, and Deaths ✅ Goal met. | ||||
 Click on graph for larger image.
This graph shows the daily (columns) and 7-day average (line) of deaths reported.
Average daily deaths bottomed in July 2021 at 214 per day.
Hotels: Occupancy Rate Down 3.5% Compared to Same Week in 2019
by Calculated Risk on 5/26/2022 04:11:00 PM
U.S. hotel performance increased from the previous week, according to STR‘s latest data through May 21.The following graph shows the seasonal pattern for the hotel occupancy rate using the four-week average.
May 15-21, 2022 (percentage change from comparable week in 2019*):
• Occupancy: 68.6% (-3.5%)
• Average daily rate (ADR): $151.75 (+13.4%)
• Revenue per available room (RevPAR): $104.06 (+9.5%)
*Due to the pandemic impact, STR is measuring recovery against comparable time periods from 2019.
emphasis added
 Click on graph for larger image.
The red line is for 2022, black is 2020, blue is the median, and dashed light blue is for 2021. Dashed purple is 2019 (STR is comparing to a strong year for hotels).
The 4-week average of the occupancy rate above the median rate for the previous 20 years (Blue).
Note: Y-axis doesn't start at zero to better show the seasonal change.
The 4-week average of the occupancy rate will mostly move sideways seasonally until the summer travel season.
Realtor.com Reports Weekly Inventory Up 9% Year-over-year
by Calculated Risk on 5/26/2022 01:12:00 PM
Today, in the Calculated Risk Real Estate Newsletter: Realtor.com Reports Weekly Inventory Up 9% Year-over-year
Excerpt:
Realtor.com has monthly and weekly data on the existing home market. Here is their weekly report released this morning from Chief Economist Danielle Hale: Weekly Housing Trends View — Data Week Ending May 21, 2022.. Note: They have data on list prices, new listings and more, but this focus is on inventory.• Active inventory continued to grow, rising 9% above one year ago. In a few short weeks, we’ve observed a significant turnaround in the number of homes available for sale, going from essentially flat two weeks ago, to +5% last week, to +9% this week. This is the biggest year over year gain ever observed in our weekly data history which goes back to 2017, and the first consecutive weeks of gains since 2019. This is a milestone to celebrate, but should be understood in context. Our April Housing Trends Report showed that the active listings count remained 60 percent below its level right at the onset of the pandemic. This means that April’s buyers had just 2 homes to consider for every 5 homes that were available for sale just before the pandemic. May data in summary is likely to show that even as the market is adjusting rapidly, the number of homes for sale remains limited compared to pre-pandemic conditions.Here is a graph of the year-over-year change in inventory according to realtor.com. Note: I corrected a sign error in the data for Feb 26, 2022.
Note the rapid increase in the YoY change, from down 30% at the beginning of the year, to up 9% YoY now. It will be important to watch if that trend continues. It appears that inventory growth is accelerating, as demand declines.

There is much more in the article. You can subscribe at https://calculatedrisk.substack.com/
May Vehicle Sales Forecast: Decrease to 13.4 million SAAR
by Calculated Risk on 5/26/2022 12:42:00 PM
From WardsAuto: May U.S. Light-Vehicle Sales to Fall from April, But Q2 Still Expected to Improve on Q1 (pay content). Brief excerpt:
"With expectations that higher inventory at the end of the month will lead June’s results to rebound from May’s sequential decline, the second quarter's annualized rate is pegged to rise to 14.3 million units from Q1's 14.1 million."
 Click on graph for larger image.
This graph shows actual sales from the BEA (Blue), and Wards forecast for May (Red).
The Wards forecast of 13.4 million SAAR, would be down about 6% from last month, and down 20% from a year ago (sales were solid in May 2021, as sales recovered from the depths of the pandemic, and weren't yet significantly impacted by supply chain issues).
NAR: Pending Home Sales Decreased 3.9% in April
by Calculated Risk on 5/26/2022 10:03:00 AM
From the NAR: Pending Home Sales Descend 3.9% in April
Pending home sales slipped in April, as contract activity decreased for the sixth consecutive month, the National Association of Realtors® reported. Only the Midwest region saw signings increase month-over-month, while the other three major regions reported declines. Each of the four regions registered a drop in year-over-year contract activity.This was below expectations of a 1.9% decrease for this index. Note: Contract signings usually lead sales by about 45 to 60 days, so this would usually be for closed sales in May and June.
The Pending Home Sales Index (PHSI), a forward-looking indicator of home sales based on contract signings, slid 3.9% to 99.3 in April. Year-over-year, transactions fell 9.1%. An index of 100 is equal to the level of contract activity in 2001.
"Pending contracts are telling, as they better reflect the timelier impact from higher mortgage rates than do closings," said Lawrence Yun, NAR's chief economist. "The latest contract signings mark six consecutive months of declines and are at the slowest pace in nearly a decade."
...
Month-over-month, the Northeast PHSI fell 16.20% to 74.8 in April, a 14.3% drop from a year ago. In the Midwest, the index rose 6.6% to 100.7 last month, down 2.8% from April 2021.
Pending home sales transactions in the South dipped 4.7% to an index of 119.0 in April, down 10.3% from April 2021. The index in the West slipped 4.3% in April to 85.9, a 10.5% decrease from a year prior.
emphasis added
Weekly Initial Unemployment Claims Decrease to 210,000
by Calculated Risk on 5/26/2022 08:38:00 AM
The DOL reported:
In the week ending May 21, the advance figure for seasonally adjusted initial claims was 210,000, a decrease of 8,000 from the previous week's unrevised level of 218,000. The 4-week moving average was 206,750, an increase of 7,250 from the previous week's unrevised average of 199,500.The following graph shows the 4-week moving average of weekly claims since 1971.
emphasis added
 Click on graph for larger image.
The dashed line on the graph is the current 4-week average. The four-week average of weekly unemployment claims increased to 206,750.
The previous week was unrevised.
Weekly claims were lower than the consensus forecast.
Q1 GDP Growth Revised down to minus 1.5% Annual Rate
by Calculated Risk on 5/26/2022 08:33:00 AM
From the BEA: Gross Domestic Product (Second Estimate) and Corporate Profits (Preliminary), First Quarter 2022
Real gross domestic product (GDP) decreased at an annual rate of 1.5 percent in the first quarter of 2022 (table 1), according to the "second" estimate released by the Bureau of Economic Analysis. In the fourth quarter, real GDP increased 6.9 percent.Here is a Comparison of Second and Advance Estimates. PCE growth was revised up from 2.7% to 3.1%. Residential investment was revised down from 2.1% to 0.4%.
The GDP estimate released today is based on more complete source data than were available for the "advance" estimate issued last month. In the advance estimate, the decrease in real GDP was 1.4 percent. The update primarily reflects downward revisions to private inventory investment and residential investment that were partly offset by an upward revision to consumer spending
emphasis added


