 RSS Feed
 by Calculated Risk on 1/31/2022 08:24:00 AM
Monday, January 31, 2022
Six High Frequency Indicators for the Economy
These indicators are mostly for travel and entertainment. It is interesting to watch these sectors recover as the pandemic subsides.
There is a clear negative impact from the omicron variant of COVID.
Note: Gasoline consumption returned to pre-pandemic levels.
----- Airlines: Transportation Security Administration -----
The TSA is providing daily travel numbers.
This data is as of January 30th.
 Click on graph for larger image.
This data shows the 7-day average of daily total traveler throughput from the TSA for 2019 (Light Blue), 2020 (Black), 2021 (Blue) and 2021 (Red).
The dashed line is the percent of 2019 for the seven-day average.
The 7-day average is down 23.4% from the same day in 2019 (76.6% of 2019). (Dashed line)
----- Restaurants: OpenTable -----
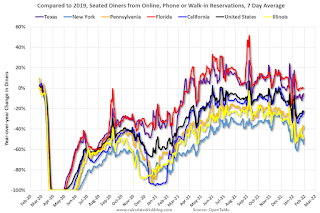
The second graph shows the 7-day average of the year-over-year change in diners as tabulated by OpenTable for the US and several selected cities.
----- Movie Tickets: Box Office Mojo -----
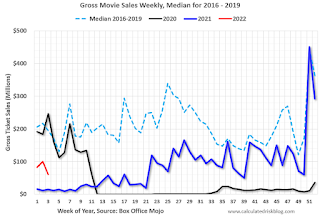 This data shows domestic box office for each week and the median for the years 2016 through 2019 (dashed light blue).
----- Hotel Occupancy: STR -----
 This graph shows the seasonal pattern for the hotel occupancy rate using the four-week average.
The red line is for 2022, black is 2020, blue is the median, and dashed light blue is for 2021.
This data is through January 22nd. The occupancy rate was down 15.9% compared to the same week in 2019.
----- Transit: Apple Mobility -----
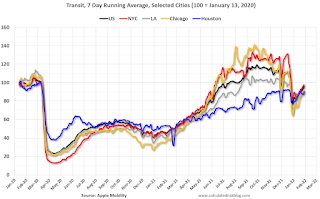
This graph is from Apple mobility. From Apple: "This data is generated by counting the number of requests made to Apple Maps for directions in select countries/regions, sub-regions, and cities." This is just a general guide - people that regularly commute probably don't ask for directions.
 This data is through January 28th
----- New York City Subway Usage -----
Here is some interesting data on New York subway usage (HT BR).
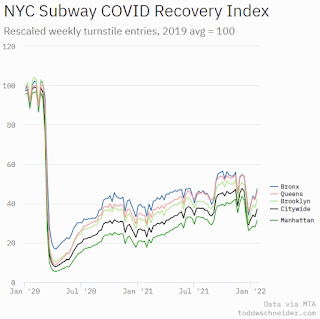 This graph is from Todd W Schneider.
This data is through Friday,January 28th.
He notes: "Data updates weekly from the MTA’s public turnstile data, usually on Saturday mornings".
Note: Gasoline consumption returned to pre-pandemic levels.
The TSA is providing daily travel numbers.
This data is as of January 30th.
Click on graph for larger image.This data shows the 7-day average of daily total traveler throughput from the TSA for 2019 (Light Blue), 2020 (Black), 2021 (Blue) and 2021 (Red).
The dashed line is the percent of 2019 for the seven-day average.
The 7-day average is down 23.4% from the same day in 2019 (76.6% of 2019). (Dashed line)
Air travel had been off about 20% relative to 2019 for most of the second half of 2021 (with some ups and downs) - but picked up over the Thanksgiving and Christmas holidays (solid leisure travel) - and has declined in early 2022 (omicron / weak business travel).
The second graph shows the 7-day average of the year-over-year change in diners as tabulated by OpenTable for the US and several selected cities.
IMPORTANT: OpenTable notes: "we’ve updated the data including downloadable dataset from January 1, 2021, onward to compare seated diners from 2021 to 2019, as opposed to year over year." Thanks!
 Thanks to OpenTable for providing this restaurant data:
This data is updated through January 29, 2022.
This data is "a sample of restaurants on the OpenTable network across all channels: online reservations, phone reservations, and walk-ins. For year-over-year comparisons by day, we compare to the same day of the week from the same week in the previous year."
Dining was mostly moving sideways, but there has been some decline recently, probably due to the winter wave of COVID. The 7-day average for the US is down 23% compared to 2019.
Thanks to OpenTable for providing this restaurant data:This data is updated through January 29, 2022.
This data is "a sample of restaurants on the OpenTable network across all channels: online reservations, phone reservations, and walk-ins. For year-over-year comparisons by day, we compare to the same day of the week from the same week in the previous year."
Dining was mostly moving sideways, but there has been some decline recently, probably due to the winter wave of COVID. The 7-day average for the US is down 23% compared to 2019.
This data shows domestic box office for each week and the median for the years 2016 through 2019 (dashed light blue). Black is 2020, Blue is 2021 and Red is 2022.
The data is from BoxOfficeMojo through January 27th.
Note that the data is usually noisy week-to-week and depends on when blockbusters are released.
Movie ticket sales were at $61 million last week, down about 69% from the median for the week.
Note that the data is usually noisy week-to-week and depends on when blockbusters are released.
Movie ticket sales were at $61 million last week, down about 69% from the median for the week.
This graph shows the seasonal pattern for the hotel occupancy rate using the four-week average. The red line is for 2022, black is 2020, blue is the median, and dashed light blue is for 2021.
This data is through January 22nd. The occupancy rate was down 15.9% compared to the same week in 2019.
The 4-week average of the occupancy rate is below the median rate for the previous 20 years (Blue).
Notes: Y-axis doesn't start at zero to better show the seasonal change.
Notes: Y-axis doesn't start at zero to better show the seasonal change.
The 4-week average of the occupancy rate will increase seasonally over the next few months. The key question is: How much business travel will return?
This graph is from Apple mobility. From Apple: "This data is generated by counting the number of requests made to Apple Maps for directions in select countries/regions, sub-regions, and cities." This is just a general guide - people that regularly commute probably don't ask for directions.
This data is through January 28th for the United States and several selected cities.
The graph is the running 7-day average to remove the impact of weekends.
IMPORTANT: All data is relative to January 13, 2020. This data is NOT Seasonally Adjusted. People walk and drive more when the weather is nice, so I'm just using the transit data.
According to the Apple data directions requests, public transit in the 7-day average for the US is at 96% of the January 2020 level.
Here is some interesting data on New York subway usage (HT BR).
This graph is from Todd W Schneider. This graph shows how much MTA traffic has recovered in each borough (Graph starts at first week in January 2020 and 100 = 2019 average).
Manhattan is at about 31% of normal.
This data is through Friday,January 28th.
He notes: "Data updates weekly from the MTA’s public turnstile data, usually on Saturday mornings".
Sunday, January 30, 2022
Sunday Night Futures
by Calculated Risk on 1/30/2022 08:28:00 PM
Weekend:
• Schedule for Week of January 30, 2022
Monday:
• At 9:45 AM ET, Chicago Purchasing Managers Index for January. The consensus is for a reading of 61.7, down from 64.3 in December.
• At 10:30 AM, Dallas Fed Survey of Manufacturing Activity for January. This is the last of the regional Fed manufacturing surveys for November.
• At 2:00 PM, Senior Loan Officer Opinion Survey on Bank Lending Practices for January.
From CNBC: Pre-Market Data and Bloomberg futures S&P 500 futures are down 15 and DOW futures are down 100 (fair value).
Oil prices were up over the last week with WTI futures at $86.82 per barrel and Brent at $90.03 per barrel. A year ago, WTI was at $52, and Brent was at $55 - so WTI oil prices are up about 65% year-over-year.
Here is a graph from Gasbuddy.com for nationwide gasoline prices. Nationally prices are at $3.35 per gallon. A year ago prices were at $2.41 per gallon, so gasoline prices are up $0.94 per gallon year-over-year.
Q4 2021 GDP Details on Residential and Commercial Real Estate
by Calculated Risk on 1/30/2022 12:37:00 PM
The BEA released the underlying details for the Q4 advance GDP report on Friday.
The BEA reported that investment in non-residential structures decreased at a 11.4% annual pace in Q4. Note that weakness in non-residential structures started in 2019, before the pandemic.
Investment in petroleum and natural gas structures increased sharply in Q4 compared to Q3 and was up 49% year-over-year.

The first graph shows investment in offices, malls and lodging as a percent of GDP.
Investment in offices (blue) increased slightly in Q4 and was up 2.9% year-over-year. (Still declining as a percent of GDP).
Investment in multimerchandise shopping structures (malls) peaked in 2007 and was up about 12% year-over-year in Q4 - from a very low level. The vacancy rate for malls is still very high, so investment will probably stay low for some time.
Lodging investment increased slightly in Q4 compared to Q3, and lodging investment was down 25% year-over-year.
All three sectors - offices, malls, and hotels - are being hurt significantly by the pandemic.
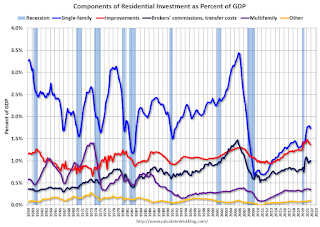 The second graph is for Residential investment components as a percent of GDP. According to the Bureau of Economic Analysis, RI includes new single-family structures, multifamily structures, home improvement, Brokers’ commissions and other ownership transfer costs, and a few minor categories (dormitories, manufactured homes).
Even though investment in single family structures has increased from the bottom, single family investment is just approaching normal levels as a percent of GDP.
Investment in single family structures was $416 billion (SAAR) (about 1.7% of GDP), and up 18% year-over-year.
Investment in multi-family structures decreased slightly in Q4.
Investment in home improvement was at a $328 billion Seasonally Adjusted Annual Rate (SAAR) in Q2 (about 1.4% of GDP). Home improvement spending has been strong during the pandemic.
The second graph is for Residential investment components as a percent of GDP. According to the Bureau of Economic Analysis, RI includes new single-family structures, multifamily structures, home improvement, Brokers’ commissions and other ownership transfer costs, and a few minor categories (dormitories, manufactured homes).Even though investment in single family structures has increased from the bottom, single family investment is just approaching normal levels as a percent of GDP.
Investment in single family structures was $416 billion (SAAR) (about 1.7% of GDP), and up 18% year-over-year.
Investment in multi-family structures decreased slightly in Q4.
Investment in home improvement was at a $328 billion Seasonally Adjusted Annual Rate (SAAR) in Q2 (about 1.4% of GDP). Home improvement spending has been strong during the pandemic.
Note that Brokers' commissions (black) increased sharply last year as existing home sales increased in the second half of 2020 but was down in Q2 and Q3. Brokers' commissions were up 3% year-over-year in Q4.
Saturday, January 29, 2022
Real Estate Newsletter Articles this Week
by Calculated Risk on 1/29/2022 02:11:00 PM
At the Calculated Risk Real Estate Newsletter this week:
• Final Look at Local Housing Markets in December No Signs of Slowing; Inventory at Record Lows
• Case-Shiller National Index up 18.8% Year-over-year in November FHFA: "House price levels remained elevated in November, but the data indicate a pivot"
• December New Home Sales: Inventory of homes under construction highest since 2007 New Home Sales increase to 811,000 Annual Rate in December; Sales down 7.3% in 2021
• Real House Prices, Price-to-Rent Ratio and Price-to-Median Income in NovemberAnd a look at "Affordability"
This is usually published several times a week, and provides more in-depth analysis of the housing market.
The blog will continue as always!
You can subscribe at https://calculatedrisk.substack.com/ Most content is available for free, but please subscribe!.
You can subscribe at https://calculatedrisk.substack.com/ Most content is available for free, but please subscribe!.
Schedule for Week of January 30, 2022
by Calculated Risk on 1/29/2022 08:11:00 AM
The key report scheduled for this week is the January employment report.
Other key indicators include January ISM manufacturing and services surveys, and January vehicle sales.
9:45 AM: Chicago Purchasing Managers Index for January. The consensus is for a reading of 61.7, down from 64.3 in December.
10:30 AM: Dallas Fed Survey of Manufacturing Activity for January. This is the last of the regional Fed manufacturing surveys for November.
2:00 PM: Senior Loan Officer Opinion Survey on Bank Lending Practices for January.
8:00 AM: Corelogic House Price index for December.
10:00 AM: Construction Spending for December. The consensus is for a 0.6% increase in construction spending.
 10:00 AM ET: Job Openings and Labor Turnover Survey for December from the BLS.
 This graph shows job openings (yellow line), hires (purple), Layoff, Discharges and other (red column), and Quits (light blue column) from the JOLTS.
Jobs openings decreased in November to 10.6 million from 11.1 million in October.
10:00 AM: ISM Manufacturing Index for January. The consensus is for the ISM to be at 57.5, down from 58.8 in December.
7:00 AM ET: The Mortgage Bankers Association (MBA) will release the results for the mortgage purchase applications index.
8:15 AM: The ADP Employment Report for January. This report is for private payrolls only (no government). The consensus is for 208,000 payroll jobs added in January, down from 807,000 added in December.
10:00 AM: the Q4 2021 Housing Vacancies and Homeownership from the Census Bureau.
8:30 AM: The initial weekly unemployment claims report will be released. The consensus is for a decrease to 250 thousand from 260 thousand last week.
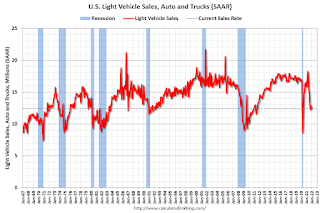 All day: Light vehicle sales for January. The consensus is for light vehicle sales to be 12.6 million SAAR in January, up from 12.4 million in December (Seasonally Adjusted Annual Rate).
This graph shows light vehicle sales since the BEA started keeping data in 1967. The dashed line is the December sales rate.
10:00 AM: the ISM Services Index for January.
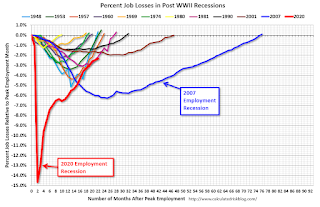 8:30 AM: Employment Report for January. The consensus is for 155 thousand jobs added, and for the unemployment rate to be unchanged at 3.9%. There were 199 thousand jobs added in December, and the unemployment rate was at 3.9%.
This graph shows the job losses from the start of the employment recession, in percentage terms.
The current employment recession was by far the worst recession since WWII in percentage terms. However, the current employment recession, 20 months after the onset, is now significantly better than the "Great Recession".
Friday, January 28, 2022
COVID Update: January 28, 2022: Falling Cases and Hospitalizations; 2,300 Deaths per Day
by Calculated Risk on 1/28/2022 09:01:00 PM
On COVID (focus on hospitalizations and deaths):
| COVID Metrics | ||||
|---|---|---|---|---|
| Now | Week Ago | Goal | ||
| Percent fully Vaccinated | 63.7% | --- | ≥70.0%1 | |
| Fully Vaccinated (millions) | 211.3 | --- | ≥2321 | |
| New Cases per Day3 | 577,748 | 726,986 | ≤5,0002 | |
| Hospitalized3 | 139,164 | 146,333 | ≤3,0002 | |
| Deaths per Day3🚩 | 2,300 | 1,910 | ≤502 | |
| 1 Minimum to achieve "herd immunity" (estimated between 70% and 85%). 2my goals to stop daily posts, 37-day average for Cases, Currently Hospitalized, and Deaths 🚩 Increasing 7-day average week-over-week for Cases, Hospitalized, and Deaths ✅ Goal met. | ||||
 Click on graph for larger image.
This graph shows the daily (columns) and 7-day average (line) of positive tests reported.
New cases and hospitalizations are now declining.
Unfortunately, deaths are still rising - now averaging over 2 thousand deaths per day - but below the previous 7-day average record of 3,421 in January 2021.
Hotels: Occupancy Rate Down 16% Compared to Same Week in 2019
by Calculated Risk on 1/28/2022 01:52:00 PM
U.S. hotel performance remained relatively flat from the previous week, according to STR‘s latest data through Jan. 22.The following graph shows the seasonal pattern for the hotel occupancy rate using the four-week average.
Jan. 16-22, 2022 (percentage change from comparable week in 2019*):
• Occupancy: 48.7% (-15.9%)
• Average daily rate (ADR): $122.17 (-1.4%)
• Revenue per available room (RevPAR): $59.52 (-17.1%)
*Due to the pandemic impact, STR is measuring recovery against comparable time periods from 2019.
emphasis added
Click on graph for larger image.The red line is for 2022, black is 2020, blue is the median, and dashed light blue is for 2021.
The 4-week average of the occupancy rate is below the median rate for the previous 20 years (Blue).
Note: Y-axis doesn't start at zero to better show the seasonal change.
The 4-week average of the occupancy rate will increase seasonally over the next few months.
NMHC: January Apartment Market Survey shows "Strong Demand, Record-High Occupancy, Double Digit Rent Growth"
by Calculated Risk on 1/28/2022 11:01:00 AM
From the National Multifamily Housing Council (NMHC): January Apartment Market Conditions Show Improvement
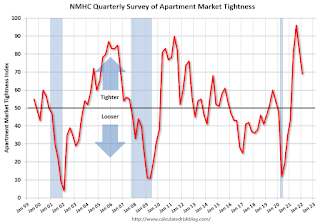
Apartment market conditions generally improved according to the National Multifamily Housing Council’s Quarterly Survey of Apartment Market Conditions for January 2022. The Market Tightness (69), Sales Volume (59), and Equity Financing (67) indexes all came in above the breakeven level (50) for the fourth quarter in a row, though many respondents indicated conditions remained unchanged across the indexes. The Debt Financing (36) index indicated weaker conditions for the second consecutive quarter.
“We are continuing to witness strong demand for apartments across the entire U.S., but most notably in the Sun Belt, where most markets have seen double-digit rent growth that has more than made up for the pandemic slowdown,” noted NMHC’s Chief Economist, Mark Obrinsky. “And even as construction continues to rebound from the lows of 2020, absorptions have more than kept pace, such that apartment occupancy remains at record-highs.”
Click on graph for larger image.
This graph shows the quarterly Apartment Tightness Index. Any reading above 50 indicates tighter conditions from the previous quarter.
Even though the index declined in January, this indicates market conditions tightened further in January for the fourth consecutive quarter, after being especially weak during the early months of the pandemic.
LA Area Port Traffic: Disappointing Traffic in December
by Calculated Risk on 1/28/2022 10:16:00 AM
Notes: The expansion to the Panama Canal was completed in 2016 (As I noted a few years ago), and some of the traffic that used the ports of Los Angeles and Long Beach is probably going through the canal. This might be impacting TEUs on the West Coast.
Also, incoming port traffic is backed up significantly in the LA area with numerous ships at anchor waiting to unload.
Container traffic gives us an idea about the volume of goods being exported and imported - and usually some hints about the trade report since LA area ports handle about 40% of the nation's container port traffic.
The following graphs are for inbound and outbound traffic at the ports of Los Angeles and Long Beach in TEUs (TEUs: 20-foot equivalent units or 20-foot-long cargo container).
To remove the strong seasonal component for inbound traffic, the first graph shows the rolling 12-month average.
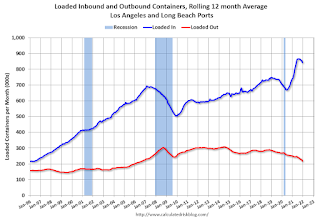
On a rolling 12-month basis, inbound traffic was down 1.2% in December compared to the rolling 12 months ending in November. Outbound traffic was down 2.5% compared to the rolling 12 months ending the previous month.
The 2nd graph is the monthly data (with a strong seasonal pattern for imports).

2021 started off incredibly strong for imports - and with the backlog of ships, traffic should remain strong. So, it is disappointing that traffic dipped in December compared to the previous months since there are quite a few ships still waiting to unload.
Imports were down 14% YoY in December, and exports were down 27% YoY.
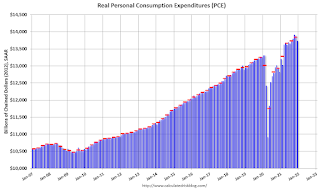
Personal Income increased 0.3% in December; Spending decreased 0.6%
by Calculated Risk on 1/28/2022 08:37:00 AM
The BEA released the Personal Income and Outlays report for December:
Personal income increased $70.7 billion (0.3 percent) in December according to estimates released today by the Bureau of Economic Analysis. Disposable personal income (DPI) increased $39.9 billion (0.2 percent) and personal consumption expenditures (PCE) decreased $95.2 billion (0.6 percent).The December PCE price index increased 5.8 percent year-over-year and the PCE price index, excluding food and energy, increased 4.9 percent year-over-year.
Real DPI decreased 0.2 percent in December and Real PCE decreased 1.0 percent; goods decreased 3.1 percent and services increased 0.1 percent. The PCE price index increased 0.4 percent. Excluding food and energy, the PCE price index increased 0.5 percent
emphasis added
The following graph shows real Personal Consumption Expenditures (PCE) through December 2021 (2012 dollars). Note that the y-axis doesn't start at zero to better show the change.
 Click on graph for larger image.
The dashed red lines are the quarterly levels for real PCE.
Personal income was slightly below expectations, and the decrease in PCE was also slightly below expectations.


