 RSS Feed
 by Calculated Risk on 1/30/2022 12:37:00 PM
Sunday, January 30, 2022
Q4 2021 GDP Details on Residential and Commercial Real Estate
The BEA released the underlying details for the Q4 advance GDP report on Friday.
The BEA reported that investment in non-residential structures decreased at a 11.4% annual pace in Q4. Note that weakness in non-residential structures started in 2019, before the pandemic.
Investment in petroleum and natural gas structures increased sharply in Q4 compared to Q3 and was up 49% year-over-year.

The first graph shows investment in offices, malls and lodging as a percent of GDP.
Investment in offices (blue) increased slightly in Q4 and was up 2.9% year-over-year. (Still declining as a percent of GDP).
Investment in multimerchandise shopping structures (malls) peaked in 2007 and was up about 12% year-over-year in Q4 - from a very low level. The vacancy rate for malls is still very high, so investment will probably stay low for some time.
Lodging investment increased slightly in Q4 compared to Q3, and lodging investment was down 25% year-over-year.
All three sectors - offices, malls, and hotels - are being hurt significantly by the pandemic.
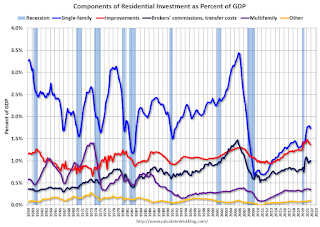 The second graph is for Residential investment components as a percent of GDP. According to the Bureau of Economic Analysis, RI includes new single-family structures, multifamily structures, home improvement, Brokers’ commissions and other ownership transfer costs, and a few minor categories (dormitories, manufactured homes).
Even though investment in single family structures has increased from the bottom, single family investment is just approaching normal levels as a percent of GDP.
Investment in single family structures was $416 billion (SAAR) (about 1.7% of GDP), and up 18% year-over-year.
Investment in multi-family structures decreased slightly in Q4.
Investment in home improvement was at a $328 billion Seasonally Adjusted Annual Rate (SAAR) in Q2 (about 1.4% of GDP). Home improvement spending has been strong during the pandemic.
The second graph is for Residential investment components as a percent of GDP. According to the Bureau of Economic Analysis, RI includes new single-family structures, multifamily structures, home improvement, Brokers’ commissions and other ownership transfer costs, and a few minor categories (dormitories, manufactured homes).Even though investment in single family structures has increased from the bottom, single family investment is just approaching normal levels as a percent of GDP.
Investment in single family structures was $416 billion (SAAR) (about 1.7% of GDP), and up 18% year-over-year.
Investment in multi-family structures decreased slightly in Q4.
Investment in home improvement was at a $328 billion Seasonally Adjusted Annual Rate (SAAR) in Q2 (about 1.4% of GDP). Home improvement spending has been strong during the pandemic.
Note that Brokers' commissions (black) increased sharply last year as existing home sales increased in the second half of 2020 but was down in Q2 and Q3. Brokers' commissions were up 3% year-over-year in Q4.


