 RSS Feed
 by Calculated Risk on 1/29/2022 08:11:00 AM
Saturday, January 29, 2022
Schedule for Week of January 30, 2022
The key report scheduled for this week is the January employment report.
Other key indicators include January ISM manufacturing and services surveys, and January vehicle sales.
9:45 AM: Chicago Purchasing Managers Index for January. The consensus is for a reading of 61.7, down from 64.3 in December.
10:30 AM: Dallas Fed Survey of Manufacturing Activity for January. This is the last of the regional Fed manufacturing surveys for November.
2:00 PM: Senior Loan Officer Opinion Survey on Bank Lending Practices for January.
8:00 AM: Corelogic House Price index for December.
10:00 AM: Construction Spending for December. The consensus is for a 0.6% increase in construction spending.
 10:00 AM ET: Job Openings and Labor Turnover Survey for December from the BLS.
 This graph shows job openings (yellow line), hires (purple), Layoff, Discharges and other (red column), and Quits (light blue column) from the JOLTS.
Jobs openings decreased in November to 10.6 million from 11.1 million in October.
10:00 AM: ISM Manufacturing Index for January. The consensus is for the ISM to be at 57.5, down from 58.8 in December.
7:00 AM ET: The Mortgage Bankers Association (MBA) will release the results for the mortgage purchase applications index.
8:15 AM: The ADP Employment Report for January. This report is for private payrolls only (no government). The consensus is for 208,000 payroll jobs added in January, down from 807,000 added in December.
10:00 AM: the Q4 2021 Housing Vacancies and Homeownership from the Census Bureau.
8:30 AM: The initial weekly unemployment claims report will be released. The consensus is for a decrease to 250 thousand from 260 thousand last week.
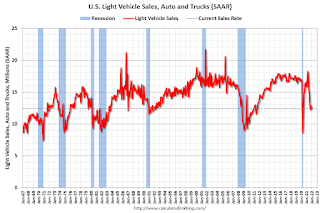 All day: Light vehicle sales for January. The consensus is for light vehicle sales to be 12.6 million SAAR in January, up from 12.4 million in December (Seasonally Adjusted Annual Rate).
This graph shows light vehicle sales since the BEA started keeping data in 1967. The dashed line is the December sales rate.
10:00 AM: the ISM Services Index for January.
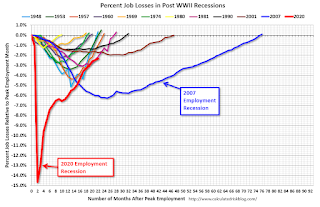 8:30 AM: Employment Report for January. The consensus is for 155 thousand jobs added, and for the unemployment rate to be unchanged at 3.9%. There were 199 thousand jobs added in December, and the unemployment rate was at 3.9%.
This graph shows the job losses from the start of the employment recession, in percentage terms.
The current employment recession was by far the worst recession since WWII in percentage terms. However, the current employment recession, 20 months after the onset, is now significantly better than the "Great Recession".


