 RSS Feed
 by Calculated Risk on 1/21/2021 11:26:00 AM
Thursday, January 21, 2021
Comments on December Housing Starts
Earlier: Housing Starts increased to 1.669 Million Annual Rate in December
Total housing starts in December were above expectations, and starts in October and November were revised up. The single family sectors has increased sharply, but the volatile multi-family sector is down significantly year-over-year (apartments are under pressure from COVID).
The housing starts report showed starts were up 5.8% in December compared to November, and starts were up 5.2% year-over-year compared to December 2019.
Single family starts were up 28% year-over-year. Single family starts are at the highest level since 2006. Low mortgage rates and limited existing home inventory have given a boost to single family housing starts.
The first graph shows the month to month comparison for total starts between 2019 (blue) and 2020 (red). A key point: Housing starts averaged 1.590 million SAAR in the three months prior to the pandemic. That is about the same as the last three months. 2020 was off to a strong start before the pandemic, and with low interest rates and little competing existing home inventory, starts finished the year strong.
 Click on graph for larger image.
Starts were up 5.2% in December compared to December 2019.
In 2019, starts picked up at the end of the year - and were strong in early 2020 - so the comparisons for the next couple of months will be difficult - and then the comparisons will be easy in March, April and May. Don't be surprised if starts are down year-over-year sometime over the next two months.
Starts were up 7.0% in 2020 from 2019. This is close to my forecast for 2020, although I didn't expect a pandemic!
I expect starts to remain solid, but the growth rate will slow.
Below is an update to the graph comparing multi-family starts and completions. Since it usually takes over a year on average to complete a multi-family project, there is a lag between multi-family starts and completions. Completions are important because that is new supply added to the market, and starts are important because that is future new supply (units under construction is also important for employment).
These graphs use a 12 month rolling total for NSA starts and completions.
 The blue line is for multifamily starts and the red line is for multifamily completions.
The rolling 12 month total for starts (blue line) increased steadily for several years following the great recession - then mostly moved sideways. Completions (red line) had lagged behind - then completions caught up with starts- then starts picked up a little again late last year, but have fallen off with the pandemic.
 The last graph shows single family starts and completions. It usually only takes about 6 months between starting a single family home and completion - so the lines are much closer. The blue line is for single family starts and the red line is for single family completions.
Single family starts are getting back to more normal levels, and I expect some further increases in single family starts and completions on a rolling 12 month basis.
Housing Starts increased to 1.669 Million Annual Rate in December
by Calculated Risk on 1/21/2021 08:47:00 AM
From the Census Bureau: Permits, Starts and Completions
Housing Starts:
Privately-owned housing starts in December were at a seasonally adjusted annual rate of 1,669,000. This is 5.8 percent above the revised November estimate of 1,578,000 and is 5.2 percent above the December 2019 rate of 1,587,000. Single-family housing starts in December were at a rate of 1,338,000; this is 12.0 percent above the revised November figure of 1,195,000. The December rate for units in buildings with five units or more was 312,000.
An estimated 1,380,300 housing units were started in 2020. This is 7.0 percent above the 2019 figure of 1,290,000.
Building Permits:
Privately-owned housing units authorized by building permits in December were at a seasonally adjusted annual rate of 1,709,000. This is 4.5 percent above the revised November rate of 1,635,000 and is 17.3 percent above the December 2019 rate of 1,457,000. Single-family authorizations in December were at a rate of 1,226,000; this is 7.8 percent above the revised November figure of 1,137,000. Authorizations of units in buildings with five units or more were at a rate of 437,000 in December.
emphasis added
 Click on graph for larger image.
The first graph shows single and multi-family housing starts for the last several years.
Multi-family starts (red, 2+ units) decreased in December compared to November. Multi-family starts were down 39% year-over-year in December.
Single-family starts (blue) increased in December, and were up 28% year-over-year. This is the highest level for single family starts since 2006.
 The second graph shows total and single unit starts since 1968.
 The second graph shows the huge collapse following the housing bubble, and then eventual recovery (but still historically low).
Total housing starts in December were above expectations, and starts in October and November were revised up. A very strong report.
I'll have more later …
Weekly Initial Unemployment Claims decreased to 900,000
by Calculated Risk on 1/21/2021 08:37:00 AM
The DOL reported:
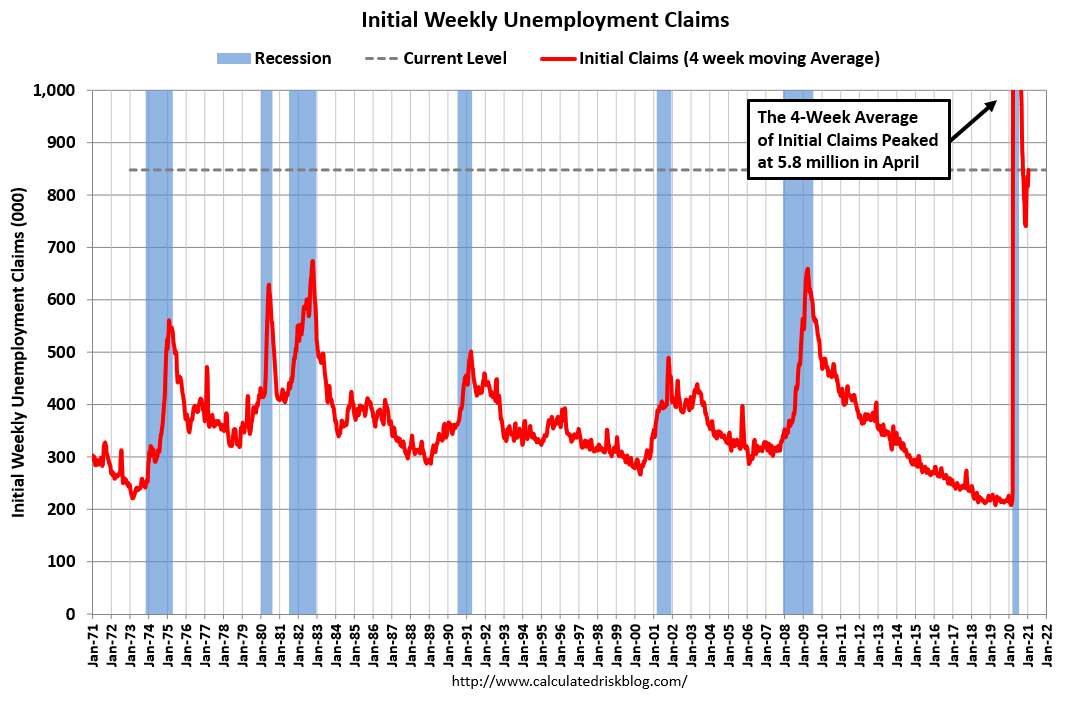
In the week ending January 16, the advance figure for seasonally adjusted initial claims was 900,000, a decrease of 26,000 from the previous week's revised level. The previous week's level was revised down by 39,000 from 965,000 to 926,000. The 4-week moving average was 848,000, an increase of 23,500 from the previous week's revised average. The previous week's average was revised down by 9,750 from 834,250 to 824,500.This does not include the 423,734 initial claims for Pandemic Unemployment Assistance (PUA) that was up from 284,886 the previous week.
emphasis added
The following graph shows the 4-week moving average of weekly claims since 1971.
 Click on graph for larger image.
The dashed line on the graph is the current 4-week average. The four-week average of weekly unemployment claims increased to 848,000.
The previous week was revised down.
The second graph shows seasonally adjust continued claims since 1967 (lags initial by one week).
 At the worst of the Great Recession, continued claims peaked at 6.635 million, but then steadily declined.
Regular state continued claims decreased to 5,054,000 (SA) from 5,181,000 (SA) the previous week and will likely stay at a high level until the crisis abates.
Note: There are an additional 5,707,397 receiving Pandemic Unemployment Assistance (PUA) that decreased from 7,442,888 the previous week (there are questions about these numbers). This is a special program for business owners, self-employed, independent contractors or gig workers not receiving other unemployment insurance.
An additional 3,026,952 are receiving Pandemic Emergency Unemployment Compensation (PEUC) that decreased from 4,166,261 the previous week. These numbers will increase now that the programs have been extended.
Wednesday, January 20, 2021
Thursday: Housing Starts, Unemployment Claims, Philly Fed Mfg
by Calculated Risk on 1/20/2021 09:11:00 PM
Thursday:
• At 8:30 AM ET, The initial weekly unemployment claims report will be released. The consensus is for a decrease to 910 thousand from 965 thousand last week.
• Also at 8:30 AM, Housing Starts for December. The consensus is for 1.560 million SAAR, up from 1.547 million SAAR.
• Also at 8:30 AM, the Philly Fed manufacturing survey for January. The consensus is for a reading of 12.3, up from 9.1.
January 20 COVID-19 Test Results
by Calculated Risk on 1/20/2021 06:51:00 PM
Note: Bloomberg has great data on vaccinations.
"Vaccinations in the U.S. began Dec. 14 with health-care workers, and so far 17.2 million shots have been given, according to a state-by-state tally by Bloomberg and data from the Centers for Disease Control and Prevention. In the last week, an average of 912,497 doses per day were administered."It is possible the 7-day average cases has peaked. Stay safe! I'm looking forward to not posting this data in a few months.
The US is now averaging close to 2 million tests per day. Based on the experience of other countries, for adequate test-and-trace (and isolation) to reduce infections, the percent positive needs to be under 5% (probably close to 1%), so the US has far too many daily cases - and percent positive - to do effective test-and-trace.
There were 1,788,698 test results reported over the last 24 hours.
There were 185,822 positive tests.
Over 60,000 US deaths have been reported so far in January. See the graph on US Daily Deaths here.
 Click on graph for larger image.
This data is from the COVID Tracking Project.
The percent positive over the last 24 hours was 10.4% (red line is 7 day average). The percent positive is calculated by dividing positive results by total tests (including pending).
And check out COVID Act Now to see how each state is doing. (updated link to new site)
 The second graph shows the 7 day average of positive tests reported and daily hospitalizations.
It is possible cases and hospitalizations have peaked, but are still at a very high level.
AIA: "Architecture Billings continue to lose ground" in December
by Calculated Risk on 1/20/2021 01:03:00 PM
Note: This index is a leading indicator primarily for new Commercial Real Estate (CRE) investment.
From the AIA: Architecture Billings continue to lose ground
Demand for design services from U.S. architecture firms took a pointed dip last month, according to a new report from the American Institute of Architects (AIA).
The pace of decline during December accelerated from November, posting an Architecture Billings Index (ABI) score of 42.6 from 46.3 (any score below 50 indicates a decline in firm billings). Meanwhile, the pace of growth of inquiries into new projects remained flat from November to December with a score of 52.4, though the value of new design contracts stayed in negative territory with a score of 48.5.
“Since the national economic recovery appears to have stalled, architecture firms are entering 2021 facing a continued sluggish design market,” said AIA Chief Economist Kermit Baker, PhD, Hon. AIA. “However, the recently passed federal stimulus funding should help shore up the economy in the short-term, and hopefully by later this year there should be relief as COVID vaccinations become more widespread. Recent project inquiries from prospective and former clients have been positive, suggesting that new work may begin picking up as we move into the spring and summer months.”
...
• Regional averages: South (46.8); Midwest (43.6); West (43.4); Northeast (38.8)
• Sector index breakdown: mixed practice (48.0); commercial/industrial (47.2); multi-family residential (46.1); institutional (38.5)
emphasis added
 Click on graph for larger image.
This graph shows the Architecture Billings Index since 1996. The index was at 42.6 in December, down from 46.3 in November. Anything below 50 indicates contraction in demand for architects' services.
Note: This includes commercial and industrial facilities like hotels and office buildings, multi-family residential, as well as schools, hospitals and other institutions.
This index has been below 50 for ten consecutive months. This represents a significant decrease in design services, and suggests a decline in CRE investment through most of 2021 (This usually leads CRE investment by 9 to 12 months).
This weakness is not surprising since certain segments of CRE are struggling, especially offices and retail.
LA Area Port Traffic: Strong Imports, Weak Exports in December
by Calculated Risk on 1/20/2021 11:51:00 AM
Note: The expansion to the Panama Canal was completed in 2016 (As I noted a few years ago), and some of the traffic that used the ports of Los Angeles and Long Beach is probably going through the canal. This might be impacting TEUs on the West Coast.
Container traffic gives us an idea about the volume of goods being exported and imported - and usually some hints about the trade report since LA area ports handle about 40% of the nation's container port traffic.
The following graphs are for inbound and outbound traffic at the ports of Los Angeles and Long Beach in TEUs (TEUs: 20-foot equivalent units or 20-foot-long cargo container).
To remove the strong seasonal component for inbound traffic, the first graph shows the rolling 12 month average.
 Click on graph for larger image.
On a rolling 12 month basis, inbound traffic was up 2.0% in December compared to the rolling 12 months ending in October. Outbound traffic was down 0.1% compared to the rolling 12 months ending the previous month.
The 2nd graph is the monthly data (with a strong seasonal pattern for imports).
 Usually imports peak in the July to October period as retailers import goods for the Christmas holiday, and then decline sharply and bottom in February or March depending on the timing of the Chinese New Year.
Imports were up 24% YoY in December, and exports were down 1% YoY.
NAHB: Builder Confidence Decreased to 83 in January
by Calculated Risk on 1/20/2021 10:04:00 AM
The National Association of Home Builders (NAHB) reported the housing market index (HMI) was at 83, down from 86 in December. Any number above 50 indicates that more builders view sales conditions as good than poor.
From the NAHB: Builder Confidence Down on Rising Material Prices, Upsurge in COVID-19 Cases
Rising material costs led by a huge upsurge in lumber prices, along with a resurgence of the coronavirus across much of the nation, pushed builder confidence in the market for newly built single-family homes down three points to 83 in January, according to the latest NAHB/Wells Fargo Housing Market Index (HMI) released today. Despite the drop, builder sentiment remains at a strong level.
“Despite robust housing demand and low mortgage rates, buyers are facing a dearth of new homes on the market, which is exacerbating affordability problems,” said NAHB Chairman Chuck Fowke. “Builders are grappling with supply-side constraints related to lumber and other material costs, a lack of affordable lots and labor shortages that delay delivery times and put upward pressure on home prices. They are also concerned about a changing regulatory environment.”
“While housing continues to help lead the economy forward, limited inventory is constraining more robust growth,” said NAHB Chief Economist Robert Dietz. “A shortage of buildable lots is making it difficult to meet strong demand and rising material prices are far outpacing increases in home prices, which in turn is harming housing affordability.”
...
All three major HMI indices fell in January. The HMI index gauging current sales conditions dropped two points to 90, the component measuring sales expectations in the next six months fell two points to 83 and the gauge charting traffic of prospective buyers decreased five points to 68.
Looking at the three-month moving averages for regional HMI scores, the Northeast fell six points to 76, the Midwest was up two points to 83, the South fell one point to 86 and the West posted a one-point loss to 95.
 Click on graph for larger image.
This graph show the NAHB index since Jan 1985.
This was below the consensus forecast, but still a very strong reading..
Housing and homebuilding have been one of the best performing sectors during the pandemic.
MBA: Mortgage Applications Decrease in Latest Weekly Survey
by Calculated Risk on 1/20/2021 07:00:00 AM
From the MBA: Mortgage Applications Decrease in Latest MBA Weekly Survey
Mortgage applications decreased 1.9 percent from one week earlier, according to data from the Mortgage Bankers Association’s (MBA) Weekly Mortgage Applications Survey for the week ending January 15, 2021.
... The Refinance Index decreased 5 percent from the previous week and was 87 percent higher than the same week one year ago. The seasonally adjusted Purchase Index increased 3 percent from one week earlier. The unadjusted Purchase Index increased 9 percent compared with the previous week and was 15 percent higher than the same week one year ago.
“Mortgage rates increased across the board last week, with the 30-year fixed rate rising to 2.92 percent – its highest level since November 2020 – and the 15-year fixed rate increasing for the first time in seven weeks to 2.48 percent. Market expectations of a larger than anticipated fiscal relief package, which is expected to further boost economic growth and lower unemployment, have driven Treasury yields higher the last two weeks,” said Joel Kan, MBA’s Associate Vice President of Economic and Industry Forecasting. “After a post-holiday surge of refinances, higher rates chipped away at demand. There was a 5 percent drop in refinance activity, driven by a 13.5 percent pullback in government refinances.”
Added Kan, “Purchase applications remained strong based on current housing demand, rising over the week and up a noteworthy 15 percent from last year. Homebuyers in early 2021 continue to seek newer, larger homes. The average loan size for purchase loans jumped to $384,000, the second highest level in the survey.”
...
The average contract interest rate for 30-year fixed-rate mortgages with conforming loan balances ($510,400 or less) increased to 2.92 percent from 2.88 percent, with points increasing to 0.37 from 0.33 (including the origination fee) for 80 percent loan-to-value ratio (LTV) loans.
emphasis added
 Click on graph for larger image.
The first graph shows the refinance index since 1990.
The refinance index has been very volatile recently depending on rates and liquidity.
But with record low rates, the index remains up significantly from last year. Note that refinance activity really picked up in February 2020.
 The second graph shows the MBA mortgage purchase index
According to the MBA, purchase activity is up 15% year-over-year unadjusted.
Note: Red is a four-week average (blue is weekly).
Tuesday, January 19, 2021
Wednesday: Homebuilder Survey
by Calculated Risk on 1/19/2021 09:03:00 PM
Wednesday:
• At 7:00 AM ET, The Mortgage Bankers Association (MBA) will release the results for the mortgage purchase applications index.
• At 10:00 AM, The January NAHB homebuilder survey. The consensus is for a reading of 86, unchanged from 86 in December. Any number above 50 indicates that more builders view sales conditions as good than poor.
• During the day, The AIA's Architecture Billings Index for December (a leading indicator for commercial real estate).


