by Calculated Risk on 1/28/2020 06:28:00 PM
Tuesday, January 28, 2020
Wednesday: FOMC Statement and Press Conference, Pending Home Sales
Wednesday:
• At 7:00 AM ET, The Mortgage Bankers Association (MBA) will release the results for the mortgage purchase applications index.
• At 10:00 AM, Pending Home Sales Index for December. The consensus is for a 0.5% increase in the index.
• At 2:00 PM, FOMC Meeting Announcement. No change to policy is expected at this meeting.
• At 2:30 PM, Fed Chair Jerome Powell holds a press briefing following the FOMC announcement.
CBO Projection: Annual Budget Deficit to be above 4% GDP for the Next Decade
by Calculated Risk on 1/28/2020 03:57:00 PM
Remember the promise that the 2017 Tax Cuts and Jobs Act (TCJA) would "pay for itself", and that the current administration would reduce the deficit? Hoocoodanode? ("Who could have known?",Popularized by my former co-blogger Tanta!)
The Congressional Budget Office (CBO) released their new The Budget and Economic Outlook: 2020 to 2030
In CBO’s projections, the federal budget deficit is $1.0 trillion in 2020 and averages $1.3 trillion between 2021 and 2030. Projected deficits rise from 4.6 percent of gross domestic product (GDP) in 2020 to 5.4 percent in 2030.The CBO projects the deficit will above 4% for the next decade. I think their projections are optimistic.
Other than a six-year period during and immediately after World War II, the deficit over the past century has not exceeded 4.0 percent for more than five consecutive years. And during the past 50 years, deficits have averaged 1.5 percent of GDP when the economy was relatively strong (as it is now).
Because of the large deficits, federal debt held by the public is projected to grow, from 81 percent of GDP in 2020 to 98 percent in 2030 (its highest percentage since 1946). By 2050, debt would be 180 percent of GDP—far higher than it has ever been
emphasis added
 Click on graph for larger image.
This graph shows the actual (purple) budget deficit each year as a percent of GDP, and an estimate for the next ten years based on estimates from the CBO.
Note: the Federal government's deficit usually increases sharply during a recession - it is the only entity that can be countercyclical - and then decreases during an expansion. So no one should compare the deficit to 2008 (under Bush) or 2009 (under Obama) during the great recession.
From a policy perspective and using these projections, the TCJA was a policy failure on this issue (the TCJA was also a failure on GDP growth, business investment, and the typical tax cut for most Americans).
Update: A few comments on the Seasonal Pattern for House Prices
by Calculated Risk on 1/28/2020 12:53:00 PM
CR Note: This is a repeat of earlier posts with updated graphs.
A few key points:
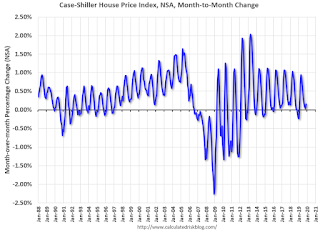
1) There is a clear seasonal pattern for house prices.
2) The surge in distressed sales during the housing bust distorted the seasonal pattern.
3) Even though distressed sales are down significantly, the seasonal factor is based on several years of data - and the factor is now overstating the seasonal change (second graph below).
4) Still the seasonal index is probably a better indicator of actual price movements than the Not Seasonally Adjusted (NSA) index.
For in depth description of these issues, see former Trulia chief economist Jed Kolko's article "Let’s Improve, Not Ignore, Seasonal Adjustment of Housing Data"
Note: I was one of several people to question the change in the seasonal factor (here is a post in 2009) - and this led to S&P Case-Shiller questioning the seasonal factor too (from April 2010). I still use the seasonal factor (I think it is better than using the NSA data).

This graph shows the month-to-month change in the NSA Case-Shiller National index since 1987 (through November 2019). The seasonal pattern was smaller back in the '90s and early '00s, and increased once the bubble burst.
The seasonal swings have declined since the bubble.

The swings in the seasonal factors have started to decrease, and I expect that over the next several years - as recent history is included in the factors - the seasonal factors will move back towards more normal levels.
However, as Kolko noted, there will be a lag with the seasonal factor since it is based on several years of recent data.
Richmond Fed: Manufacturing Activity Rebounded in January
by Calculated Risk on 1/28/2020 10:41:00 AM
From the Richmond Fed: Manufacturing Activity Rebounded in January
Fifth District manufacturing activity rebounded in January, according to the most recent survey from the Richmond Fed. The composite index rose from −5 in December to 20 in January, as all three components— shipments, new orders, and employment— increased. Local business conditions also improved as this index saw its largest increase since February 2013. Manufacturers were optimistic that conditions would continue to strengthen in the coming monthsThis was the last of the regional Fed surveys for January.
Survey results indicate that both employment and wages rose for survey participants in January. However, firms continued to struggle to find workers with the necessary skills. They expected this difficulty to persist but wages and employment to continue to grow in the next six months.
emphasis added
Here is a graph comparing the regional Fed surveys and the ISM manufacturing index:
 Click on graph for larger image.
The New York and Philly Fed surveys are averaged together (yellow, through January), and five Fed surveys are averaged (blue, through January) including New York, Philly, Richmond, Dallas and Kansas City. The Institute for Supply Management (ISM) PMI (red) is through December (right axis).
Based on these regional surveys, it seems likely the ISM manufacturing index will show expansion in January after five consecutive months of contraction.
Case-Shiller: National House Price Index increased 3.5% year-over-year in November
by Calculated Risk on 1/28/2020 09:06:00 AM
S&P/Case-Shiller released the monthly Home Price Indices for November ("November" is a 3 month average of September, October and November prices).
This release includes prices for 20 individual cities, two composite indices (for 10 cities and 20 cities) and the monthly National index.
Note: Case-Shiller reports Not Seasonally Adjusted (NSA), I use the SA data for the graphs.
From S&P: S&P CoreLogic Case-Shiller Index Continues Upward Trend for Annual Home Price Gains
The S&P CoreLogic Case-Shiller U.S. National Home Price NSA Index, covering all nine U.S. census divisions, reported a 3.5% annual gain in November, up from 3.2% in the previous month. The 10-City Composite annual increase came in at 2.0%, up from 1.7% in the previous month. The 20-City Composite posted a 2.6% year-over-year gain, up from 2.2% in the previous month.
Phoenix, Charlotte and Tampa reported the highest year-over-year gains among the 20 cities. In November, Phoenix led the way with a 5.9% year-over-year price increase, followed by Charlotte with a 5.2% increase and Tampa with a 5.0% increase. Fifteen of the 20 cities reported greater price increases in the year ending November 2019 versus the year ending October 2019.
...
The National Index posted a month-over-month increase of 0.2%, while the 10-City and 20-City Composites both posted a month-over-month increase of 0.1% before seasonal adjustment in November. After seasonal adjustment, the National Index, 10-City and 20-City Composites all posted a 0.5% increase. In November, 13 of 20 cities reported increases before seasonal adjustment while all 20 cities reported increases after seasonal adjustment.
"The U.S. housing market was stable in November,” says Craig J. Lazzara, Managing Director and Global Head of Index Investment Strategy at S&P Dow Jones Indices. “With the month’s 3.5% increase in the national composite index, home prices are currently 59% above the trough reached in February 2012, and 15% above their pre-financial crisis peak. November’s results were broad-based, with gains in every city in our 20-city composite.
“At a regional level, Phoenix retains the top spot for the sixth consecutive month, with a gain of 5.9% for November. Charlotte and Tampa rose by 5.2% and 5.0% respectively, leading the Southeast region. The Southeast has led all regions since January 2019.”
“As was the case last month, after a long period of decelerating price increases, the National, 10-city, and 20-city Composites all rose at a modestly faster rate in November than they had done in October. This increase was broad-based, reflecting data in 15 of 20 cities. It is, of course, still too soon to say whether this marks an end to the deceleration or is merely a pause in the longer-term trend.”
emphasis added
 Click on graph for larger image.
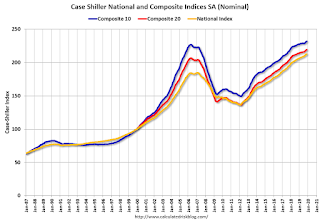
 The first graph shows the nominal seasonally adjusted Composite 10, Composite 20 and National indices (the Composite 20 was started in January 2000).
The Composite 10 index is up 2.2% from the bubble peak, and up 0.5% in November (SA) from September.
The Composite 20 index is 6.1% above the bubble peak, and up 0.5% (SA) in November.
The National index is 15.3% above the bubble peak (SA), and up 0.5% (SA) in November. The National index is up 55.9% from the post-bubble low set in December 2011 (SA).
 The second graph shows the Year over year change in all three indices.
The Composite 10 SA is up 2.0% compared to November 2018. The Composite 20 SA is up 2.5% year-over-year.
The National index SA is up 3.5% year-over-year.
Note: According to the data, prices increased in 20 of 20 cities month-over-month seasonally adjusted.
I'll have more later.
Monday, January 27, 2020
Tuesday: Case-Shiller House Prices
by Calculated Risk on 1/27/2020 06:47:00 PM
Tuesday:
• At 8:30 AM ET, Durable Goods Orders for December. The consensus is for a 0.5% increase in durable goods.
• At 9:00 AM, S&P/Case-Shiller House Price Index for December. The consensus is for a 2.4% year-over-year increase in the Comp 20 index for December.
• At 10:30 AM, Richmond Fed Survey of Manufacturing Activity for January. This is the last of regional manufacturing surveys for January.
Freddie Mac: Mortgage Serious Delinquency Rate increased slightly in December
by Calculated Risk on 1/27/2020 04:34:00 PM
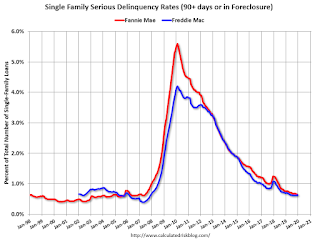
Freddie Mac reported that the Single-Family serious delinquency rate in December was 0.63%, up from 0.62% in November. Freddie's rate is down from 0.69% in December 2018.
Freddie's serious delinquency rate peaked in February 2010 at 4.20%.
These are mortgage loans that are "three monthly payments or more past due or in foreclosure".

I expect the delinquency rate to decline to a cycle bottom in the 0.4% to 0.6% range - so this is close to a bottom.
Note: Fannie Mae will report for December soon.
New Home Prices
by Calculated Risk on 1/27/2020 03:12:00 PM
As part of the new home sales report released today, the Census Bureau reported the number of homes sold by price and the average and median prices.
From the Census Bureau: "The median sales price of new houses sold in December 2019 was $331,400. The average sales price was $384,500."
The following graph shows the median and average new home prices.

During the housing bust, the builders had to build smaller and less expensive homes to compete with all the distressed sales. When housing started to recovery - with limited finished lots in recovering areas - builders moved to higher price points to maximize profits.
Now it appears the home builders are offering some less expensive (and probably smaller) homes.
The average price in December 2019 was $384,500, and the median price was $311,400.
The second graph shows the percent of new homes sold by price.

The $400K+ bracket increased significantly since the housing recovery started, but has been holding steady recently. Still, a majority of new homes (about 57%) in the U.S., are in the $200K to $400K range.
A few Comments on December New Home Sales
by Calculated Risk on 1/27/2020 11:26:00 AM
New home sales for December were reported at 694,000 on a seasonally adjusted annual rate basis (SAAR). Sales for the previous three months were revised down.
Annual sales in 2019 were at 681,000, up 10.3% from annual sales in 2018, and the best year for new home sales since 2007. This was well above analysts forecast for sales in 2019, and the growth mostly happened in the second half of the year.
Earlier: New Home Sales at 694,000 Annual Rate in December.

This graph shows new home sales for 2018 and 2019 by month (Seasonally Adjusted Annual Rate).
The year-over-year comparison was easy in December, and sales in December were up 23.0% year-over-year compared to December 2018.
Note that the comparisons will be fairly easy for the first five months of 2020, but will be more difficult in the second half of the year.
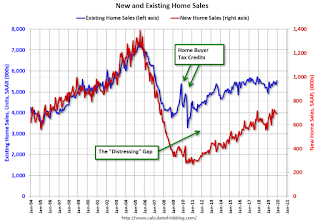
And here is another update to the "distressing gap" graph that I first started posting a number of years ago to show the emerging gap caused by distressed sales.

Following the housing bubble and bust, the "distressing gap" appeared mostly because of distressed sales.
Even though distressed sales are down significantly, following the bust, new home builders focused on more expensive homes - so the gap closed slowly.
Now the gap is mostly closed, and I expect it to close a little more. However, this assumes that the builders will offer some smaller, less expensive homes.
Note: Existing home sales are counted when transactions are closed, and new home sales are counted when contracts are signed. So the timing of sales is different.
Dallas Fed: "Growth in Texas Manufacturing Activity Picks Up"
by Calculated Risk on 1/27/2020 10:38:00 AM
From the Dallas Fed: Growth in Texas Manufacturing Activity Picks Up
Growth in Texas factory activity accelerated in January, according to business executives responding to the Texas Manufacturing Outlook Survey. The production index, a key measure of state manufacturing conditions, rose seven points to 10.5, suggesting stronger output growth than last month.This was another weak regional report for January with the General business activity index at zero. The last of the regional Fed surveys for January will be released tomorrow (Richmond Fed).
Other measures of manufacturing activity also pointed to an acceleration in January. The new orders index shot up 16 points to 17.6, its highest reading in 15 months. The growth rate of orders index returned to positive territory, rising from -5.0 to 6.1. The capacity utilization and shipments indexes pushed further positive, coming in at 11.5 and 8.6, respectively.
Perceptions of broader business conditions were largely unchanged in January. The general business activity index came in at zero, with three-fourths of respondents noting no change this month and the rest split between improved and worsened activity.
Labor market measures suggested slower employment growth and no change in workweek length this month. The employment index retreated from 6.2 to 1.9, indicative of an abatement in hiring. Sixteen percent of firms noted net hiring, while 14 percent noted net layoffs. The hours worked index came in at zero.
emphasis added


