by Calculated Risk on 1/30/2020 12:54:00 PM
Thursday, January 30, 2020
Q4 GDP: Investment
Investment was weak again in Q4, although residential investment picked up (increased at a 5.8% annual rate).
The first graph below shows the contribution to GDP from residential investment, equipment and software, and nonresidential structures (3 quarter trailing average). This is important to follow because residential investment tends to lead the economy, equipment and software is generally coincident, and nonresidential structure investment trails the economy.
In the graph, red is residential, green is equipment and software, and blue is investment in non-residential structures. So the usual pattern - both into and out of recessions is - red, green, blue.
The dashed gray line is the contribution from the change in private inventories.

Residential investment (RI) increased in Q4 (5.8% annual rate in Q3). Equipment investment decreased at a 2.9% annual rate, and investment in non-residential structures decreased at a 10.1% annual rate.
On a 3 quarter trailing average basis, RI (red) is up, equipment (green) is negative, and nonresidential structures (blue) is also down.
I'll post more on the components of non-residential investment once the supplemental data is released.

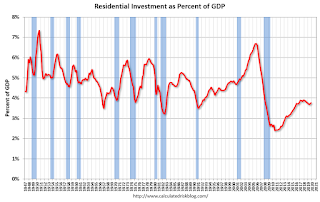
Residential Investment as a percent of GDP increased in Q4. RI as a percent of GDP is close to the bottom of the previous recessions - and I expect RI to continue to increase further in this cycle.
I'll break down Residential Investment into components after the GDP details are released.
Note: Residential investment (RI) includes new single family structures, multifamily structures, home improvement, broker's commissions, and a few minor categories.

HVS: Q4 2019 Homeownership and Vacancy Rates
by Calculated Risk on 1/30/2020 10:09:00 AM
The Census Bureau released the Residential Vacancies and Homeownership report for Q4 2019.
This report is frequently mentioned by analysts and the media to track household formation, the homeownership rate, and the homeowner and rental vacancy rates. However, there are serious questions about the accuracy of this survey.
This survey might show the trend, but I wouldn't rely on the absolute numbers. he Census Bureau is investigating the differences between the HVS, ACS and decennial Census, and analysts probably shouldn't use the HVS to estimate the excess vacant supply or household formation, or rely on the homeownership rate, except as a guide to the trend.
"National vacancy rates in the fourth quarter 2019 were 6.4 percent for rental housing and 1.4 percent for homeowner housing. The rental vacancy rate of 6.4 percent was not statistically different from the rate in the fourth quarter 2018 (6.6 percent), but 0.4 percentage points lower than the rate in the third quarter 2019 (6.8 percent). The homeowner vacancy rate of 1.4 percent was not statistically different from the rate in the fourth quarter 2018 (1.5 percent) and virtually unchanged from the rate in the third quarter 2019.
The homeownership rate of 65.1 percent was not statistically different from the rate in the fourth quarter 2018 (64.8 percent) nor from the rate in the third quarter 2019 (also 64.8 percent). "
 Click on graph for larger image.
The Red dots are the decennial Census homeownership rates for April 1st 1990, 2000 and 2010. The HVS homeownership rate increased to 65.1% in Q4, from 64.8% in Q3.
I'd put more weight on the decennial Census numbers. However, given changing demographics, the homeownership rate has bottomed.
 The HVS homeowner vacancy was unchanged at 1.4%.
 Once again - this probably shows the general trend, but I wouldn't rely on the absolute numbers.
 The rental vacancy rate decreased to 6.4% in Q4.
The quarterly HVS is the most timely survey on households, but there are many questions about the accuracy of this survey.
Overall this suggests that vacancies have declined significantly, and my guess is the homeownership rate has bottomed - and that the rental vacancy rate is close to the bottom for this cycle.
Weekly Initial Unemployment Claims Decrease to 216,000
by Calculated Risk on 1/30/2020 08:39:00 AM
The DOL reported:
In the week ending January 25, the advance figure for seasonally adjusted initial claims was 216,000, a decrease of 7,000 from the previous week's revised level. The previous week's level was revised up by 12,000 from 211,000 to 223,000. The 4-week moving average was 214,500, a decrease of 1,750 from the previous week's revised average. The previous week's average was revised up by 3,000 from 213,250 to 216,250.The previous week was revised up significantly.
emphasis added
The following graph shows the 4-week moving average of weekly claims since 1971.
 Click on graph for larger image.
The dashed line on the graph is the current 4-week average. The four-week average of weekly unemployment claims decreased to 214,500.
This was close to the consensus forecast.
BEA: Real GDP increased at 2.1% Annualized Rate in Q4
by Calculated Risk on 1/30/2020 08:34:00 AM
From the BEA: Gross Domestic Product, Fourth Quarter and Year 2019 (Advance Estimate)
Real gross domestic product (GDP) increased at an annual rate of 2.1 percent in the fourth quarter of 2019, according to the "advance" estimate released by the Bureau of Economic Analysis. In the third quarter, real GDP increased 2.1 percent. ...The advance Q4 GDP report, with 2.1% annualized growth, was at expectations.
The increase in real GDP in the fourth quarter reflected positive contributions from personal consumption expenditures (PCE), federal government spending, state and local government spending, residential fixed investment, and exports, that were partly offset by negative contributions from private inventory investment and nonresidential fixed investment. Imports, which are a subtraction in the calculation of GDP, decreased.
Real GDP growth in the fourth quarter was the same as that in the third. In the fourth quarter, a downturn in imports, an acceleration in government spending, and a smaller decrease in nonresidential investment were offset by a larger decrease in private inventory investment and a slowdown in PCE.
emphasis added
Personal consumption expenditures (PCE) increased at 1.8% annualized rate in Q4, down from 3.2% in Q3. Residential investment (RI) increased at a 5.8% rate in Q4. Equipment investment decreased at a 2.9% annualized rate, and investment in non-residential structures decreased at a 10.1% pace.
I'll have more later ...
Wednesday, January 29, 2020
Thursday: GDP, Unemployment Claims
by Calculated Risk on 1/29/2020 07:22:00 PM
Thursday:
• At 8:30 AM ET, The initial weekly unemployment claims report will be released. The consensus is for 215,000 initial claims, up from 211,000 last week.
• At 8:30 AM, Gross Domestic Product, 4th quarter 2019 (Advance estimate). The consensus is that real GDP increased 2.1% annualized in Q4, the same as in Q3.
• At 10:00 AM, the Q4 2019 Housing Vacancies and Homeownership from the Census Bureau.
Zillow Case-Shiller Forecast: House Price Gains "Primed for an Upswing"
by Calculated Risk on 1/29/2020 04:40:00 PM
The Case-Shiller house price indexes for November were released yesterday. Zillow forecasts Case-Shiller a month early, and I like to check the Zillow forecasts since they have been pretty close.
From Matthew Speakman at Zillow: November Case-Shiller Results and December Forecast: Primed for an Upswing
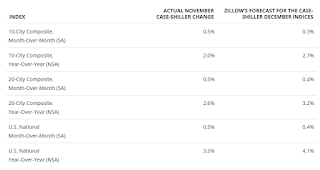
The S&P CoreLogic Case-Shiller U.S. National Home Price Index® rose 3.5% year-over-year in November (non-seasonally adjusted), up from 3.2% in October. Annual growth was also up from September in the smaller 10-city index (to 2%, from 1.7%) and in the 20-city index (to 2.6%, from 2.2%).
...
After a yearlong slowdown in 2019, home values appear primed to go back on the upswing to start 2020.
The main driver in this acceleration is clearly the ongoing and historic lack of for-sale inventory, though a strong job market, stabilizing geopolitical tensions and still-low mortgage rates have played their part. Even taking seasonal factors into consideration, the number of homes available for sale fell consistently through the latter part of 2019 and now sits near the lowest level on record. This lack of homes has made competition among buyers — buoyed by otherwise favorable economic conditions — even more fierce, in turn helping to push up prices even faster. Indeed, homebuying activity has picked up in recent months, with sales of existing homes reaching their highest level in nearly two years in December.
emphasis added
 The Zillow forecast is for the year-over-year change for the Case-Shiller National index to be at 4.1% in December, up from 3.5% in December.
 The Zillow forecast is for the 20-City index to be up 3.2% YoY in December from 2.6% in November, and for the 10-City index to increase to 2.7% YoY compared to 2.0% YoY in November.
FOMC Statement: No Change to Policy
by Calculated Risk on 1/29/2020 02:01:00 PM
Information received since the Federal Open Market Committee met in December indicates that the labor market remains strong and that economic activity has been rising at a moderate rate. Job gains have been solid, on average, in recent months, and the unemployment rate has remained low. Although household spending has been rising at a moderate pace, business fixed investment and exports remain weak. On a 12‑month basis, overall inflation and inflation for items other than food and energy are running below 2 percent. Market-based measures of inflation compensation remain low; survey-based measures of longer-term inflation expectations are little changed.
Consistent with its statutory mandate, the Committee seeks to foster maximum employment and price stability. The Committee decided to maintain the target range for the federal funds rate at 1‑1/2 to 1-3/4 percent. The Committee judges that the current stance of monetary policy is appropriate to support sustained expansion of economic activity, strong labor market conditions, and inflation returning to the Committee's symmetric 2 percent objective. The Committee will continue to monitor the implications of incoming information for the economic outlook, including global developments and muted inflation pressures, as it assesses the appropriate path of the target range for the federal funds rate.
In determining the timing and size of future adjustments to the target range for the federal funds rate, the Committee will assess realized and expected economic conditions relative to its maximum employment objective and its symmetric 2 percent inflation objective. This assessment will take into account a wide range of information, including measures of labor market conditions, indicators of inflation pressures and inflation expectations, and readings on financial and international developments.
Voting for the monetary policy action were Jerome H. Powell, Chair; John C. Williams, Vice Chair; Michelle W. Bowman; Lael Brainard; Richard H. Clarida; Patrick Harker; Robert S. Kaplan; Neel Kashkari; Loretta J. Mester; and Randal K. Quarles
emphasis added
Philly Fed: State Coincident Indexes increased in 37 states in December
by Calculated Risk on 1/29/2020 11:00:00 AM
From the Philly Fed:
The Federal Reserve Bank of Philadelphia has released the coincident indexes for the 50 states for December 2019. Over the past three months, the indexes increased in 39 states, decreased in eight states, and remained stable in three, for a threemonth diffusion index of 62. In the past month, the indexes increased in 37 states, decreased in nine states, and remained stable in four, for a one-month diffusion index of 56.Note: These are coincident indexes constructed from state employment data. An explanation from the Philly Fed:
emphasis added
The coincident indexes combine four state-level indicators to summarize current economic conditions in a single statistic. The four state-level variables in each coincident index are nonfarm payroll employment, average hours worked in manufacturing by production workers, the unemployment rate, and wage and salary disbursements deflated by the consumer price index (U.S. city average). The trend for each state’s index is set to the trend of its gross domestic product (GDP), so long-term growth in the state’s index matches long-term growth in its GDP.
 Click on map for larger image.
Here is a map of the three month change in the Philly Fed state coincident indicators. This map was all red during the worst of the recession, and all or mostly green during most of the recent expansion.
The map is mostly green on a three month basis, but there are some red and gray states.
Source: Philly Fed.
Note: For complaints about red / green issues, please contact the Philly Fed.
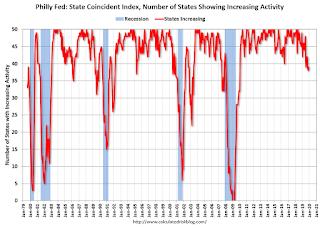
 And here is a graph is of the number of states with one month increasing activity according to the Philly Fed. This graph includes states with minor increases (the Philly Fed lists as unchanged).
In December, 39 states had increasing activity including states with minor increases.
NAR: "Pending Home Sales Skid 4.9% in December"
by Calculated Risk on 1/29/2020 10:03:00 AM
From the NAR: Pending Home Sales Skid 4.9% in December
Pending home sales fell in December, taking a step back after increasing slightly in November, according to the National Association of Realtors®. Each of the four major regions reported a drop in month-over-month contract activity, with the South experiencing the steepest fall. However, year-over-year pending home sales activity was up nationally compared to one year ago.This was well below expectations for this index. Note: Contract signings usually lead sales by about 45 to 60 days, so this would usually be for closed sales in January and February.
The Pending Home Sales Index (PHSI), a forward-looking indicator based on contract signings, fell 4.9% to 103.2 in December. Year-over-year contract signings increased 4.6%. An index of 100 is equal to the level of contract activity in 2001.
...
All regional indices were down in December. The Northeast PHSI slipped 4.0% to 92.4 in December, 0.1% lower than a year ago. In the Midwest, the index dropped 3.6% to 98.8 last month, 1.3% higher than in December 2018.
Pending home sales in the South decreased 5.5% to an index of 118.1 in December, a 7.4% increase from December 2018. The index in the West fell 5.4% in December 2019 to 93.1, an increase of 7.0% from a year ago.
emphasis added
MBA: Mortgage Applications Increased in Latest Weekly Survey
by Calculated Risk on 1/29/2020 07:00:00 AM
From the MBA: Mortgage Applications Increase in Latest MBA Weekly Survey
Mortgage applications increased 7.2 percent from one week earlier, according to data from the Mortgage Bankers Association’s (MBA) Weekly Mortgage Applications Survey for the week ending January 24, 2020. This week’s results include an adjustment for the Martin Luther King Jr. Holiday.
... The Refinance Index increased 8 percent from the previous week and was 146 percent higher than the same week one year ago. The seasonally adjusted Purchase Index increased 5 percent from one week earlier. The unadjusted Purchase Index increased 2 percent compared with the previous week and was 17 percent higher than the same week one year ago.
...
“Mortgage applications continued their strong start to the year, as borrowers acted on the drop in mortgage rates last week. Rates were driven lower by investors’ increased concern about the economic impact from China’s coronavirus outbreak, in addition to existing concerns over trade and other geo-political risks,” said Joel Kan, MBA’s Associate Vice President of Economic and Industry Forecasting. “With the 30-year fixed rate at its lowest level since November 2016, refinances jumped 7.5 percent. Purchase applications grew 2 percent and were more than 16 percent higher than the same week last year. Thanks to low rates and the healthy job market, purchase activity continues to run stronger than in 2019.”
...
The average contract interest rate for 30-year fixed-rate mortgages with conforming loan balances ($510,400 or less) decreased to 3.81 percent from 3.87 percent, with points increasing to 0.28 from 0.27 (including the origination fee) for 80 percent loan-to-value ratio (LTV) loans.
emphasis added
 Click on graph for larger image.
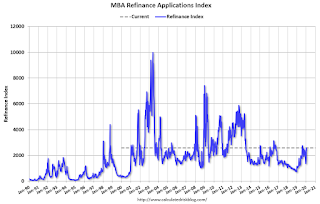
The first graph shows the refinance index since 1990.
With lower rates, we saw a sharp increase in refinance activity, but mortgage rates would have to decline further to see a huge refinance boom.
 The second graph shows the MBA mortgage purchase index
According to the MBA, purchase activity is up 17% year-over-year.


