 RSS Feed
 by Calculated Risk on 8/21/2019 10:11:00 AM
Wednesday, August 21, 2019
NAR: Existing-Home Sales Increased to 5.42 million in July
From the NAR: Existing-Home Sales Climb 2.5% in July
Existing-home sales strengthened in July, a positive reversal after total sales were down slightly in the previous month, according to the National Association of Realtors®. Although Northeast transactions declined, the other three major U.S. regions recorded sales increases, including vast growth in the West last month.
Total existing-home sales, completed transactions that include single-family homes, townhomes, condominiums and co-ops, rose 2.5% from June to a seasonally adjusted annual rate of 5.42 million in July. Overall sales are up 0.6% from a year ago (5.39 million in July 2018).
...
Total housing inventory at the end of July decreased to 1.89 million, down from 1.92 million existing-homes available for sale in June, and a 1.6% decrease from 1.92 million one year ago. Unsold inventory is at a 4.2-month supply at the current sales pace, down from the 4.4 month-supply recorded in June and down from the 4.3-month supply recorded in July of 2018.
emphasis added
 Click on graph for larger image.
This graph shows existing home sales, on a Seasonally Adjusted Annual Rate (SAAR) basis since 1993.
Sales in July (5.42 million SAAR) were up 2.5% from last month, and were 0.6% above the July 2018 sales rate.
The second graph shows nationwide inventory for existing homes.
 According to the NAR, inventory decreased to 1.89 million in July from 1.92 million in June. Headline inventory is not seasonally adjusted, and inventory usually decreases to the seasonal lows in December and January, and peaks in mid-to-late summer.
The last graph shows the year-over-year (YoY) change in reported existing home inventory and months-of-supply. Since inventory is not seasonally adjusted, it really helps to look at the YoY change. Note: Months-of-supply is based on the seasonally adjusted sales and not seasonally adjusted inventory.
 Inventory was down 1.6% year-over-year in July compared to July 2018.
 Months of supply decreased to 4.2 months in July.
This was at the consensus forecast. For existing home sales, a key number is inventory - and inventory is still low. I'll have more later …
MBA: Mortgage Applications Decreased in Latest Weekly Survey
by Calculated Risk on 8/21/2019 07:00:00 AM
From the MBA: Mortgage Applications Decrease in Latest MBA Weekly Survey
Mortgage applications decreased 0.9 percent from one week earlier, according to data from the Mortgage Bankers Association’s (MBA) Weekly Mortgage Applications Survey for the week ending August 16, 2019.
... The Refinance Index increased 0.4 percent from the previous week and was 180 percent higher than the same week one year ago. The seasonally adjusted Purchase Index decreased 4 percent from one week earlier. The unadjusted Purchase Index decreased 5 percent compared with the previous week and was 5 percent higher than the same week one year ago.
...
“In a week where worries over global economic growth drove U.S. Treasury yields 13 basis points lower, the 30-year fixed mortgage rate decreased just three basis points. As a result, the refinance index saw only a slight increase but remained at its highest level since July 2016,” said Joel Kan, MBA’s Associate Vice President of Economic and Industry Forecasting. “The small moves in rates and refinancing are potentially signs that lenders may be approaching capacity constraints as they continue to deal with the largest wave of refinance activity in three years. The refinance share of applications, at almost 63 percent, was also at its highest level since September 2016.”
Added Kan, “Lower mortgage rates have yet to lead to a notable rise in homebuyer demand. Purchase applications fell more than 3 percent, but were still 5 percent higher than a year ago.”
...
The average contract interest rate for 30-year fixed-rate mortgages with conforming loan balances ($484,350 or less) decreased to 3.90 percent from 3.93 percent, with points remaining unchanged at 0.35 (including the origination fee) for 80 percent loan-to-value ratio (LTV) loans.
emphasis added
 Click on graph for larger image.
The first graph shows the refinance index since 1990.
Mortgage rates have declined from close to 5% late last year to under 4%.
With lower rates, we saw a recent sharp increase in refinance activity.
 The second graph shows the MBA mortgage purchase index
According to the MBA, purchase activity is up 5% year-over-year.
Tuesday, August 20, 2019
Wednesday: Existing Home Sales, FOMC Minutes, BLS Preliminary Benchmark Revision and More
by Calculated Risk on 8/20/2019 06:34:00 PM
Wednesday:
• At 7:00 AM ET: The Mortgage Bankers Association (MBA) will release the results for the mortgage purchase applications index.
• At 10:00 AM: Existing Home Sales for July from the National Association of Realtors (NAR). The consensus is for 5.39 million SAAR, up from 5.27 million last month. Housing economist Tom Lawler expects the NAR to report 5.40 million SAAR.
• At 10:00 AM: the Bureau of Labor Statistics (BLS) will release the preliminary estimate of the upcoming annual benchmark revision.
• At 11:00 AM: CBO to Release Updated Budget and Economic Projections
• During the day: The AIA's Architecture Billings Index for July (a leading indicator for commercial real estate).
• At 2:00 PM: FOMC Minutes, Meeting of July 30-31, 2019
"ATA Truck Tonnage Index Surged 6.6% in July"
by Calculated Risk on 8/20/2019 04:02:00 PM
CR Note: I've heard reports that trucking has been soft, but this index is solid.
From the ATA: ATA Truck Tonnage Index Surged 6.6% in July
American Trucking Associations’ advanced seasonally adjusted (SA) For-Hire Truck Tonnage Index increased 6.6% in July after falling 1.2% in June. In July, the index equaled 122.7 (2015=100) compared with 115.1 in June.
“Tonnage in 2019 has been on a rollercoaster ride, plagued with large monthly swings, which continued in July as tonnage surged after falling significantly in May and June,” said ATA Chief Economist Bob Costello. “However, take out the month-to-month noise, and you see that truck tonnage is still on a nice upward path. It is important to note that ATA’s tonnage data is dominated by contract freight, which is performing significantly better than the plunge in spot market freight this year.”
 Click on graph for larger image.
June’s reading was revised down compared with our July press release. Compared with July 2018, the SA index surged 7.3%, the largest year-over-year gain since April.
…
Trucking serves as a barometer of the U.S. economy, representing 70.2% of tonnage carried by all modes of domestic freight transportation, including manufactured and retail goods. Trucks hauled 10.77 billion tons of freight in 2017. Motor carriers collected $700.1 billion, or 79.3% of total revenue earned by all transport modes.
emphasis added
Update: The Failed Promises of the 2017 Tax Cuts and Jobs Act (TCJA)
by Calculated Risk on 8/20/2019 12:30:00 PM
Yesterday I wrote: The Failed Promises of the 2017 Tax Cuts and Jobs Act (TCJA)
I included this quote:
"This change, along with a lower business tax rate, would likely give the typical American household around a $4,000 pay raise." Donald Trump, October 19, 2017
However I didn't provide any analysis of the $4,000 number.
Here are two articles with analysis (ht JF)
From Motley Fool: Want a Tax Cut? Here's How Much Typical Americans Saved in 2018. The analysis suggests around $1,600 to $1,900, not $4,000.
And from the Heritage Foundation: The Truth About How Much Americans Are Paying in Taxes.
"the average American household paid about $1,400 less in taxes"
Existing Home Sales: Lawler vs. the Consensus
by Calculated Risk on 8/20/2019 09:51:00 AM
The NAR is scheduled to release Existing Home Sales for July at 10:00 AM tomorrow (Wednesday, Aug 20th).
The consensus is for 5.39 million SAAR, up from 5.27 million in June. Housing economist Tom Lawler estimates the NAR will report sales of 5.40 million SAAR and that inventory will be down 1.6% year-over-year. Based on Lawler's estimate, I expect existing home sales to be close to the consensus.
Housing economist Tom Lawler has been sending me his predictions of what the NAR will report for over 9 years. The table below shows the consensus for each month, Lawler's predictions, and the NAR's initially reported level of sales.
Lawler hasn't always been closer than the consensus, but usually when there has been a fairly large spread between Lawler's estimate and the "consensus", Lawler has been closer.
Last month the consensus was for sales of 5.34 million on a seasonally adjusted annual rate (SAAR) basis. Lawler estimated the NAR would report 5.25 million, and the NAR reported 5.27 million (as usual Lawler was closer than the consensus).
NOTE: There have been times when Lawler "missed", but then he pointed out an apparent error in the NAR data - and the subsequent revision corrected that error. As an example, see: The “Curious Case” of Existing Home Sales in the South in April
Over the last 9 years, the consensus average miss was 145 thousand, and Lawler's average miss was 68 thousand.
| Existing Home Sales, Forecasts and NAR Report millions, seasonally adjusted annual rate basis (SAAR) | |||
|---|---|---|---|
| Month | Consensus | Lawler | NAR reported1 |
| May-10 | 6.20 | 5.83 | 5.66 |
| Jun-10 | 5.30 | 5.30 | 5.37 |
| Jul-10 | 4.66 | 3.95 | 3.83 |
| Aug-10 | 4.10 | 4.10 | 4.13 |
| Sep-10 | 4.30 | 4.50 | 4.53 |
| Oct-10 | 4.50 | 4.46 | 4.43 |
| Nov-10 | 4.85 | 4.61 | 4.68 |
| Dec-10 | 4.90 | 5.13 | 5.28 |
| Jan-11 | 5.20 | 5.17 | 5.36 |
| Feb-11 | 5.15 | 5.00 | 4.88 |
| Mar-11 | 5.00 | 5.08 | 5.10 |
| Apr-11 | 5.20 | 5.15 | 5.05 |
| May-11 | 4.75 | 4.80 | 4.81 |
| Jun-11 | 4.90 | 4.71 | 4.77 |
| Jul-11 | 4.92 | 4.69 | 4.67 |
| Aug-11 | 4.75 | 4.92 | 5.03 |
| Sep-11 | 4.93 | 4.83 | 4.91 |
| Oct-11 | 4.80 | 4.86 | 4.97 |
| Nov-11 | 5.08 | 4.40 | 4.42 |
| Dec-11 | 4.60 | 4.64 | 4.61 |
| Jan-12 | 4.69 | 4.66 | 4.57 |
| Feb-12 | 4.61 | 4.63 | 4.59 |
| Mar-12 | 4.62 | 4.59 | 4.48 |
| Apr-12 | 4.66 | 4.53 | 4.62 |
| May-12 | 4.57 | 4.66 | 4.55 |
| Jun-12 | 4.65 | 4.56 | 4.37 |
| Jul-12 | 4.50 | 4.47 | 4.47 |
| Aug-12 | 4.55 | 4.87 | 4.82 |
| Sep-12 | 4.75 | 4.70 | 4.75 |
| Oct-12 | 4.74 | 4.84 | 4.79 |
| Nov-12 | 4.90 | 5.10 | 5.04 |
| Dec-12 | 5.10 | 4.97 | 4.94 |
| Jan-13 | 4.90 | 4.94 | 4.92 |
| Feb-13 | 5.01 | 4.87 | 4.98 |
| Mar-13 | 5.03 | 4.89 | 4.92 |
| Apr-13 | 4.92 | 5.03 | 4.97 |
| May-13 | 5.00 | 5.20 | 5.18 |
| Jun-13 | 5.27 | 4.99 | 5.08 |
| Jul-13 | 5.13 | 5.33 | 5.39 |
| Aug-13 | 5.25 | 5.35 | 5.48 |
| Sep-13 | 5.30 | 5.26 | 5.29 |
| Oct-13 | 5.13 | 5.08 | 5.12 |
| Nov-13 | 5.02 | 4.98 | 4.90 |
| Dec-13 | 4.90 | 4.96 | 4.87 |
| Jan-14 | 4.70 | 4.67 | 4.62 |
| Feb-14 | 4.64 | 4.60 | 4.60 |
| Mar-14 | 4.56 | 4.64 | 4.59 |
| Apr-14 | 4.67 | 4.70 | 4.65 |
| May-14 | 4.75 | 4.81 | 4.89 |
| Jun-14 | 4.99 | 4.96 | 5.04 |
| Jul-14 | 5.00 | 5.09 | 5.15 |
| Aug-14 | 5.18 | 5.12 | 5.05 |
| Sep-14 | 5.09 | 5.14 | 5.17 |
| Oct-14 | 5.15 | 5.28 | 5.26 |
| Nov-14 | 5.20 | 4.90 | 4.93 |
| Dec-14 | 5.05 | 5.15 | 5.04 |
| Jan-15 | 5.00 | 4.90 | 4.82 |
| Feb-15 | 4.94 | 4.87 | 4.88 |
| Mar-15 | 5.04 | 5.18 | 5.19 |
| Apr-15 | 5.22 | 5.20 | 5.04 |
| May-15 | 5.25 | 5.29 | 5.35 |
| Jun-15 | 5.40 | 5.45 | 5.49 |
| Jul-15 | 5.41 | 5.64 | 5.59 |
| Aug-15 | 5.50 | 5.54 | 5.31 |
| Sep-15 | 5.35 | 5.56 | 5.55 |
| Oct-15 | 5.41 | 5.33 | 5.36 |
| Nov-15 | 5.32 | 4.97 | 4.76 |
| Dec-15 | 5.19 | 5.36 | 5.46 |
| Jan-16 | 5.32 | 5.36 | 5.47 |
| Feb-16 | 5.30 | 5.20 | 5.08 |
| Mar-16 | 5.27 | 5.27 | 5.33 |
| Apr-16 | 5.40 | 5.44 | 5.45 |
| May-16 | 5.64 | 5.55 | 5.53 |
| Jun-16 | 5.48 | 5.62 | 5.57 |
| Jul-16 | 5.52 | 5.41 | 5.39 |
| Aug-16 | 5.44 | 5.49 | 5.33 |
| Sep-16 | 5.35 | 5.55 | 5.47 |
| Oct-16 | 5.44 | 5.47 | 5.60 |
| Nov-16 | 5.54 | 5.60 | 5.61 |
| Dec-16 | 5.54 | 5.55 | 5.49 |
| Jan-17 | 5.55 | 5.60 | 5.69 |
| Feb-17 | 5.55 | 5.41 | 5.48 |
| Mar-17 | 5.61 | 5.74 | 5.71 |
| Apr-17 | 5.67 | 5.56 | 5.57 |
| May-17 | 5.55 | 5.65 | 5.62 |
| Jun-17 | 5.58 | 5.59 | 5.52 |
| Jul-17 | 5.57 | 5.38 | 5.44 |
| Aug-17 | 5.48 | 5.39 | 5.35 |
| Sep-17 | 5.30 | 5.38 | 5.39 |
| Oct-17 | 5.30 | 5.60 | 5.48 |
| Nov-17 | 5.52 | 5.77 | 5.81 |
| Dec-17 | 5.75 | 5.66 | 5.57 |
| Jan-18 | 5.65 | 5.48 | 5.38 |
| Feb-18 | 5.42 | 5.44 | 5.54 |
| Mar-18 | 5.28 | 5.51 | 5.60 |
| Apr-18 | 5.60 | 5.48 | 5.46 |
| May-18 | 5.56 | 5.47 | 5.43 |
| Jun-18 | 5.45 | 5.35 | 5.38 |
| Jul-18 | 5.43 | 5.40 | 5.34 |
| Aug-18 | 5.36 | 5.36 | 5.34 |
| Sep-18 | 5.30 | 5.20 | 5.15 |
| Oct-18 | 5.20 | 5.31 | 5.22 |
| Nov-18 | 5.19 | 5.23 | 5.32 |
| Dec-18 | 5.24 | 4.97 | 4.99 |
| Jan-19 | 5.05 | 4.92 | 4.94 |
| Feb-19 | 5.08 | 5.46 | 5.51 |
| Mar-19 | 5.30 | 5.40 | 5.21 |
| Apr-19 | 5.36 | 5.31 | 5.19 |
| May-19 | 5.29 | 5.40 | 5.34 |
| Jun-19 | 5.34 | 5.25 | 5.27 |
| Jul-19 | 5.39 | 5.40 | --- |
| 1NAR initially reported before revisions. | |||
Monday, August 19, 2019
30 Year Fixed Mortgage: 3.5% to 3.625%
by Calculated Risk on 8/19/2019 08:54:00 PM
From Matthew Graham at Mortgage News Daily: Mortgage Rates Hold Relatively Steady Despite Bond Market Weakness
Mortgage rates mostly held steady today, despite a move higher in broader interest rate indicators like the 10yr Treasury yield. Treasuries and mortgage rates typically track each other quite well, but that relationship has broken down in recent weeks due to the rapid drop in rates and the increase in volatility. The mortgage sector has a much tougher time adjusting to new realities compared to Treasuries. [Most Prevalent Rates 30YR FIXED - 3.5% - 3.625%]
emphasis added
Housing Inventory Tracking
by Calculated Risk on 8/19/2019 04:46:00 PM
Update: Watching existing home "for sale" inventory is very helpful. As an example, the increase in inventory in late 2005 helped me call the top for housing.
And the decrease in inventory eventually helped me correctly call the bottom for house prices in early 2012, see: The Housing Bottom is Here.
And in 2015, it appeared the inventory build in several markets was ending, and that boosted price increases.
I don't have a crystal ball, but watching inventory helps understand the housing market.
Inventory, on a national basis, was unchanged year-over-year (YoY) in June. That followed ten consecutive months with a YoY increase.
The graph below shows the YoY change for non-contingent inventory in Houston, Las Vegas, and Sacramento and Phoenix (through July), and total existing home inventory as reported by the NAR (through June).
 Click on graph for larger image.
The black line is the year-over-year change in inventory as reported by the NAR.
Note that inventory was up 71% YoY in Las Vegas in July (red), the thirteenth consecutive month with a YoY increase. But the YoY change is slowing.
Houston is a special case, and inventory was up for several years due to lower oil prices, but declined when oil prices increased. Inventory was up 9.7% year-over-year in Houston in July.
Inventory is a key for the housing market. Right now it appears the inventory build that started last year has ended.
Los Angeles Area Home Sales Unchanged YoY in July, Inventory Down 1% YoY
by Calculated Risk on 8/19/2019 02:24:00 PM
From Pacific Union chief economist Selma Hepp: How are lower interest rates impacting Los Angeles housing markets?
After a large dip in housing market activity starting in the last quarter of 2018 and first quarter of 2019, housing markets in recent months have mostly bounced back to where they were last summer. The number of home sales trends about the same, home prices have recovered to again show annual increases, inventories are scarce, and absorption rates have returned to the same rates.CR Note: there is much more data at Hepp's report.
...
Home sales activity picked up speed in July, after some slowing in June, bringing activity back in line with stronger numbers seen in May. In July, total sales in Los Angeles County trended at the same level as July of last year, [5,417 in July 2019 compared to 5,424 in July 2018] with an increase in sales of homes priced between $1 million and $2 million, up 5 percent year-over-year, being offset by slower sales in other price segments.
…
[F]or-sale inventory is once again trending below last year’s levels with July’s year-over-year decline for the overall inventory down one percent, and inventory priced below $1 million down 5 percent. Declines follow almost a year of year-over-year increases. And the lower priced inventory is now 24 percent below the 2015 levels.
emphasis added
The Failed Promises of the 2017 Tax Cuts and Jobs Act (TCJA)
by Calculated Risk on 8/19/2019 11:52:00 AM
We all remember the promises for the 2017 Tax Cuts and Jobs Act (TCJA):
1) "Boost growth to 3.5 percent per year on average, with the potential to reach a 4 percent growth rate."
2) Boost business investment
3) Pay for itself (Not increase deficit)
4) Give the typical American household around a $4,000 pay raise
Here are a few quotes from 2017:
"This change, along with a lower business tax rate, would likely give the typical American household around a $4,000 pay raise." Donald Trump, October 19, 2017
“Not only will this tax plan pay for itself, but it will pay down debt,” Treasury Secretary Steve Mnuchin, Sept 2017
“I think this tax bill is going to reduce the size of our deficits going forward,” Sen. Pat Toomey (R-PA), November 2017
"I think to the extent we get the tax deal done, the stock market will go up higher." Treasury Secretary Steven Mnuchin, October 2017
The following table shows quarterly real GDP growth (annualized) from the BEA since the TCJA was signed. The average growth in the first six quarters was 2.5% - nothing special - and definitely not the promised "3.5 percent per year on average".
And it appears Q3 2019 will be another slow growth quarter.
Note: There was some pickup in 2018 (as expected), but growth has slowed in 2019.
| Quarter | Real GDP Growth Annualized | |
|---|---|---|
| Q1 2018 | 2.5% | |
| Q2 2018 | 3.5% | |
| Q3 2018 | 2.9% | |
| Q4 2018 | 1.1% | |
| Q1 2019 | 3.1% | |
| Q2 2019 | 2.1% | |
| Q3 20191 | 2.0% | |
| 1 Q3 2019 Estimated | ||
What about investment?
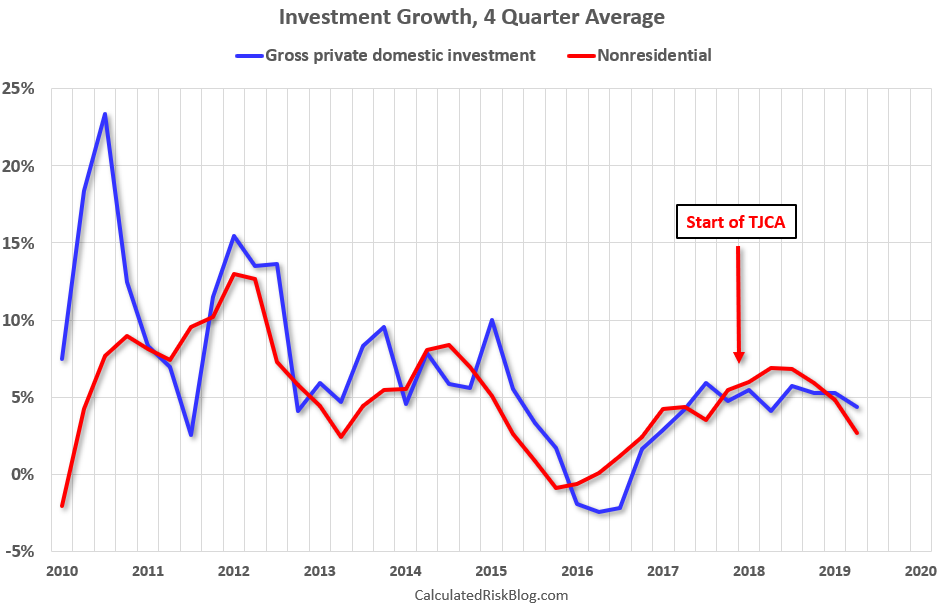 Click on graph for larger image.
This graph shows a 4 quarter average growth in Gross private domestic investment (Blue) and Nonresidential Private Investment (Red).
There was a slump in investment in 2015 and 2016 due to the collapse in oil prices, but there has been no discernible pickup in investment growth since the passage of the TCJA.
And what about the deficit?
From the CBO July monthly budget review:
The federal budget deficit was $867 billion for the first 10 months of fiscal year 2019, the Congressional Budget Office estimates—$184 billion more than the deficit recorded during the same period last year. Revenues were $92 billion higher and outlays were $276 billion higher than in the same period in fiscal year 2018.On pace for a trillion dollar deficit for the current fiscal year, up sharply from a few years ago.
Note: The CBO will release updated budget and economic projections this Wednesday.
Note: the Federal government's deficit usually increases sharply during a recession - it is the only entity that can be countercyclical - and the decreases during an expansion. So no one should compare the deficit to 2008 (under Bush) or 2009 (under Obama) during the great recession.
So the TCJA didn't pay for itself and caused a significant increase in the deficit.
Supporters of the TCJA could argue that other policies (the trade war and/or monetary policy) have limited the impact of the TCJA. Yes, the trade was has had a negative impact on the economy, but the TCJA was never going to meet these promises. Also I don't think monetary policy is to blame.
In summary, there was no discernible boost in investment. No sustained increase in GDP growth. No $4,000 pay raise. And the TCJA didn't pay for itself (significant increase in deficit).


