 RSS Feed
 by Calculated Risk on 4/06/2018 06:13:00 PM
Friday, April 06, 2018
AAR: Rail Carloads Up 3.6% YoY, Best March Ever for Intermodal
From the Association of American Railroads (AAR) Rail Time Indicators. Graphs and excerpts reprinted with permission.
Intermodal did great in March: container plus trailer volume was up 6.5% (66,151 units) over last year, the 14th straight year-over-year monthly gain. Average weekly intermodal volume in March 2018 was easily the most for any March in history. Total U.S. rail carloads were up 3.6% (36,157 carloads) in March 2018 over March 2017, the best percentage gain in nine months.
 Click on graph for larger image.
This graph from the Rail Time Indicators report shows U.S. average weekly rail carloads (NSA). Light blue is 2018.
Rail carloads have been weak over the last decade due to the decline in coal shipments.
U.S. railroads originated 1,050,653 carloads in March 2018, up 36,157 carloads, or 3.6%, over March 2017. That’s just the second year-over-year monthly gain in the past nine months (December 2017 was the other). Weekly average carloads in March 2018 were 262,663, the most for March since 2014.
 The second graph is for intermodal traffic (using intermodal or shipping containers):
U.S. railroads originated 1,082,239 containers and trailers in March 2018, up 6.5%, or 66,151 units, over March 2017. It was easily the best March in history for U.S. intermodal.
For the first three months of 2018, U.S. intermodal volume was up 5.5%, or 181,304 units, over the same period in 2017. At this point, there’s no reason to think this won’t be a record year for intermodal, breaking the record set last year.
Oil Rigs "Are the Permian's Go-Go Days Ending?"
by Calculated Risk on 4/06/2018 04:15:00 PM
A few comments from Steven Kopits of Princeton Energy Advisors LLC on Apr 6, 2018:
• Total US oil rigs were up sharply this week, +11 to 808.
• Horizontal oil rigs were up, +17 to 717.
...
• The Permian horizontal oil rig count is essentially unchanged in two months. Are we reaching some limit there? Does Conoco’s sale of non-core Permian assets suggest the go-go days are ending?
• All the other basins, major and minor, are essentially back at the prior peak of July 2017
• The overall impression is of risks gathering to the downside
• The Brent spread is near $5 / barrel again – quite bullish
 Click on graph for larger image.
CR note: This graph shows the US horizontal rig count by basin.
Graph and comments Courtesy of Steven Kopits of Princeton Energy Advisors LLC.
Fed Chair Powell: The Outlook for the U.S. Economy
by Calculated Risk on 4/06/2018 01:34:00 PM
Note: You can Watch Live on YouTube, At the Economic Club of Chicago, Chicago, Illinois
From Fed Chair Jerome Powell: The Outlook for the U.S. Economy
Unemployment has fallen from 10 percent at its peak in October 2009 to 4.1 percent, the lowest level in nearly two decades. Seventeen million jobs have been created in this expansion, and the monthly pace of job growth remains more than sufficient to employ new entrants to the labor force. The labor market has been strong, and my colleagues and I on the Federal Open Market Committee (FOMC) expect it to remain strong. Inflation has continued to run below the FOMC's 2 percent objective but we expect it to move up in coming months and to stabilize around 2 percent over the medium term.
...
Over the next few years, we will continue to aim for 2 percent inflation and for a sustained economic expansion with a strong labor market. As I mentioned, my FOMC colleagues and I believe that, as long as the economy continues broadly on its current path, further gradual increases in the federal funds rate will best promote these goals. It remains the case that raising rates too slowly would make it necessary for monetary policy to tighten abruptly down the road, which could jeopardize the economic expansion. But raising rates too quickly would increase the risk that inflation would remain persistently below our 2 percent objective. Our path of gradual rate increases is intended to balance these two risks.
Of course, our views about appropriate monetary policy in the months and years ahead will be informed by incoming economic data and the evolving outlook. If the outlook changes, so too will monetary policy. Our overarching objective will remain the same: fostering a strong economy for all Americans--one that provides plentiful jobs and low and stable inflation.
emphasis added
Public and Private Sector Payroll Jobs During Presidential Terms
by Calculated Risk on 4/06/2018 12:59:00 PM
By request, here is another update of tracking employment during Presidential terms. We frequently use Presidential terms as time markers - we could use Speaker of the House, Fed Chair, or any other marker.
NOTE: Several readers have asked if I could add a lag to these graphs (obviously a new President has zero impact on employment for the month they are elected). But that would open a debate on the proper length of the lag, so I'll just stick to the beginning of each term.
Important: There are many differences between these periods. Overall employment was smaller in the '80s, however the participation rate was increasing in the '80s (younger population and women joining the labor force), and the participation rate is generally declining now. But these graphs give an overview of employment changes.
The first graph shows the change in private sector payroll jobs from when each president took office until the end of their term(s). Presidents Carter and George H.W. Bush only served one term.
Mr. G.W. Bush (red) took office following the bursting of the stock market bubble, and left during the bursting of the housing bubble. Mr. Obama (dark blue) took office during the financial crisis and great recession. There was also a significant recession in the early '80s right after Mr. Reagan (dark red) took office.
There was a recession towards the end of President G.H.W. Bush (light purple) term, and Mr Clinton (light blue) served for eight years without a recession.
 Click on graph for larger image.
The first graph is for private employment only.
Mr. Trump is in Orange (just 14 months).
The employment recovery during Mr. G.W. Bush's (red) first term was sluggish, and private employment was down 804,000 jobs at the end of his first term. At the end of Mr. Bush's second term, private employment was collapsing, and there were net 391,000 private sector jobs lost during Mr. Bush's two terms.
Private sector employment increased by 20,964,000 under President Clinton (light blue), by 14,717,000 under President Reagan (dark red), 9,041,000 under President Carter (dashed green), 1,509,000 under President G.H.W. Bush (light purple), and 11,907,000 under President Obama (dark blue).
During the first 14 months of Mr. Trump's term, the economy has added 2,521,000 private sector jobs.
 A big difference between the presidencies has been public sector employment. Note: the bumps in public sector employment due to the decennial Census in 1980, 1990, 2000, and 2010.
The public sector grew during Mr. Carter's term (up 1,304,000), during Mr. Reagan's terms (up 1,414,000), during Mr. G.H.W. Bush's term (up 1,127,000), during Mr. Clinton's terms (up 1,934,000), and during Mr. G.W. Bush's terms (up 1,744,000 jobs). However the public sector declined significantly while Mr. Obama was in office (down 266,000 jobs).
During the first 14 months of Mr. Trump's term, the economy has added 13,000 public sector jobs.
 The third graph shows the progress towards the Trump goal of adding 10 million jobs over the next 4 years.
After 14 months of Mr. Trump's presidency, the economy has added 2,534,000 jobs, about 383,000 behind the projection.
Comments on March Employment Report
by Calculated Risk on 4/06/2018 09:59:00 AM
The headline jobs number at 103,000 for March was well below consensus expectations of 175 thousand, and the previously two months were revised down a combined 50 thousand. Looking at just March, this was a disappointing employment report.
However some of weakness was due to payback from the nice weather in February (as expected in my jobs preview). Job growth has been solid for the first three months of 2018.
Earlier: March Employment Report: 103,000 Jobs Added, 4.1% Unemployment Rate
In March, the year-over-year employment change was 2.261 million jobs. This has been generally trending down, but is still solid year-over-year growth.
Average Hourly Earnings
Wage growth was about as expected in March, although hourly wages for February were revised down slightly. From the BLS:
"In March, average hourly earnings for all employees on private nonfarm payrolls rose by 8 cents to $26.82. Over the year, average hourly earnings have increased by 71 cents, or 2.7 percent."
 Click on graph for larger image.
This graph is based on “Average Hourly Earnings” from the Current Employment Statistics (CES) (aka "Establishment") monthly employment report. Note: There are also two quarterly sources for earnings data: 1) “Hourly Compensation,” from the BLS’s Productivity and Costs; and 2) the Employment Cost Index which includes wage/salary and benefit compensation.
The graph shows the nominal year-over-year change in "Average Hourly Earnings" for all private employees. Nominal wage growth was at 2.7% YoY in March.
Wage growth had been trending up, although growth has been moving sideways recently.
Prime (25 to 54 Years Old) Participation
 Since the overall participation rate has declined due to cyclical (recession) and demographic (aging population, younger people staying in school) reasons, here is the employment-population ratio for the key working age group: 25 to 54 years old.
In the earlier period the participation rate for this group was trending up as women joined the labor force. Since the early '90s, the participation rate moved more sideways, with a downward drift starting around '00 - and with ups and downs related to the business cycle.
The 25 to 54 participation rate decreased in March at 82.1%, and the 25 to 54 employment population ratio decreased to 79.2%.
The participation rate had been trending down for this group since the late '90s, however, with more younger workers (and fewer 50+ age workers), the prime participation rate might move up some more.
Part Time for Economic Reasons
 From the BLS report:
"The number of persons employed part time for economic reasons (sometimes referred to as involuntary part-time workers) was little changed at 5.0 million in March. These individuals, who would have preferred full-time employment, were working part time because their hours had been reduced or because they were unable to find full- time jobs."The number of persons working part time for economic reasons has been generally trending down, and the number decreased in March. The number working part time for economic reasons suggests a little slack still in the labor market.
These workers are included in the alternate measure of labor underutilization (U-6) that was decreased to 8.0% in March. This is the lowest level for U-6 since last November.
Unemployed over 26 Weeks
 This graph shows the number of workers unemployed for 27 weeks or more.
 According to the BLS, there are 1.322 million workers who have been unemployed for more than 26 weeks and still want a job. This was down from 1.397 million in February.
This is the lowest level since October 2007.
This is trending down, but remains a little elevated.
The headline jobs number was disappointing, however the weakness was probably related to payback due to the nice weather in February. For the first three months of 2018, job growth has been solid.
March Employment Report: 103,000 Jobs Added, 4.1% Unemployment Rate
by Calculated Risk on 4/06/2018 08:43:00 AM
From the BLS:
Total nonfarm payroll employment edged up by 103,000 in March, and the unemployment rate was unchanged at 4.1 percent, the U.S. Bureau of Labor Statistics reported today. Employment increased in manufacturing, health care, and mining.
...
The change in total nonfarm payroll employment for January was revised down from +239,000 to +176,000, and the change for February was revised up from +313,000 to +326,000. With these revisions, employment gains in January and February combined were 50,000 less than previously reported.
...
In March, average hourly earnings for all employees on private nonfarm payrolls rose by 8 cents to $26.82. Over the year, average hourly earnings have increased by 71 cents, or 2.7 percent.
emphasis added
 Click on graph for larger image.
The first graph shows the monthly change in payroll jobs, ex-Census (meaning the impact of the decennial Census temporary hires and layoffs is removed - mostly in 2010 - to show the underlying payroll changes).
Total payrolls increased by 103 thousand in March (private payrolls increased 102 thousand).
Payrolls for January and February were revised down by a combined 50 thousand.
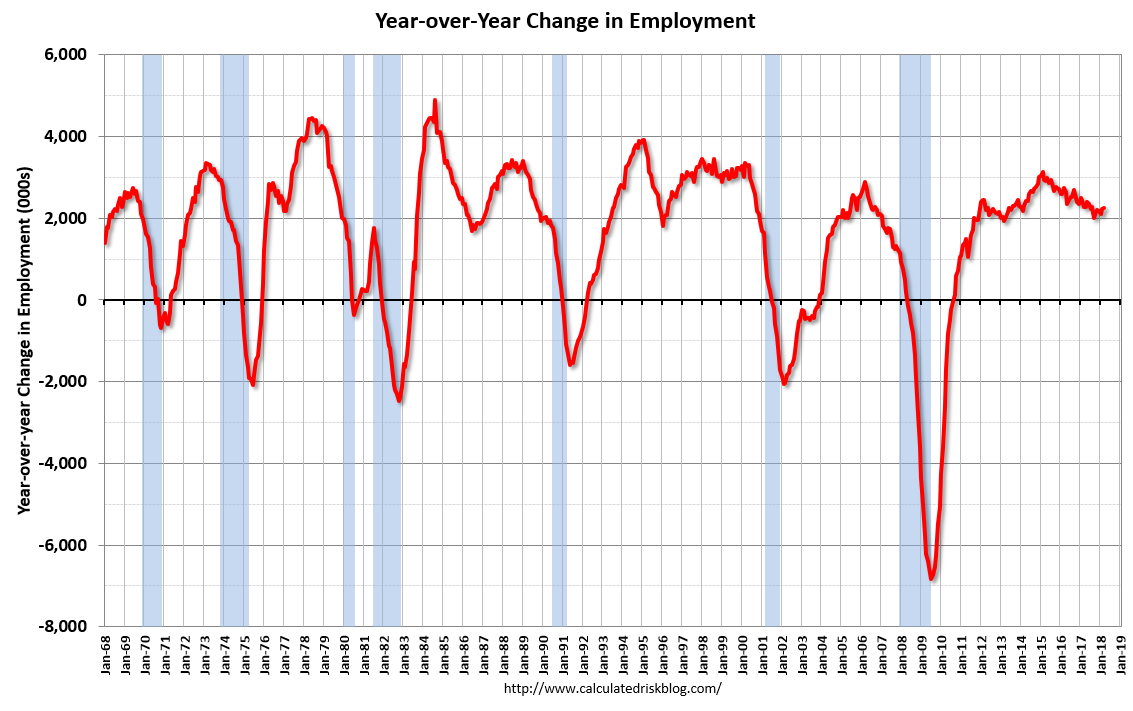 This graph shows the year-over-year change in total non-farm employment since 1968.
In March the year-over-year change was 2.261 million jobs.
The third graph shows the employment population ratio and the participation rate.
 The Labor Force Participation Rate was decreased in March to 62.9%. This is the percentage of the working age population in the labor force. A large portion of the recent decline in the participation rate is due to demographics.
 The Employment-Population ratio was unchanged at 60.4% (black line).
I'll post the 25 to 54 age group employment-population ratio graph later.
 The fourth graph shows the unemployment rate.
 The unemployment rate was unchanged in March at 4.1%.
This was well below the consensus expectations of 175,000 jobs, and the previous two months combined were revised down by 50,000.
I'll have much more later ...
Las Vegas Real Estate in March: Sales Down Slightly YoY, Inventory down 26%
by Calculated Risk on 4/06/2018 08:00:00 AM
This is a key distressed market to follow since Las Vegas saw the largest price decline, following the housing bubble, of any of the Case-Shiller composite 20 cities.
The Greater Las Vegas Association of Realtors reported Southern Nevada home prices continue to bloom heading into spring season; GLVAR housing statistics for March 2018
Local home prices rose again in March while the local housing supply stayed tight, according to a report released today by the Greater Las Vegas Association of REALTORS® (GLVAR).1) Overall sales were down slightly year-over-year from 3,903 in March 2017 to 3,886 in March 2018.
...
The total number of existing local homes, condos and townhomes sold during March was 3,886. Compared to one year ago, March sales were down 1.3 percent for homes, but up 3.7 percent for condos and townhomes.
By the end of March, GLVAR reported 3,835 single-family homes listed for sale without any sort of offer. That’s down 30.1 percent from one year ago. For condos and townhomes, the 761 properties listed without offers in March represented a 6.4 percent increase from one year ago.
Southern Nevada still has less than a two-month supply of existing homes available for sale when a six-month supply is considered a balanced market.
“We still need more homes to sell,” Bishop said. “But at least our inventory didn’t shrink any further between February and March.”
...
Meanwhile, the number of so-called distressed sales continues to decline. GLVAR reported that short sales and foreclosures combined accounted for 2.9 percent of all existing local home sales in March, compared to 9.8 percent of all sales one year ago.
emphasis added
2) Active inventory (single-family and condos) is down sharply from a year ago, from a total of 6,203 in March 2017 to 4,596 in March 2018. Note: Total inventory was down 26% year-over-year - a large decline - but the smallest year-over-year decline in inventory since 2016.
3) Fewer distressed sales.
Thursday, April 05, 2018
Friday: Employment Report, Speech by Fed Chair Jerome Powell
by Calculated Risk on 4/05/2018 06:56:00 PM
On the impact of weather from Chicago Fed economist Francois Gourio
"Updated weather effect estimates - weather should lower NFP in March by 60K according to our preferred model - a payback from unusually warm February"My March Employment Preview
Goldman: March Payrolls Preview
Friday:
• At 8:30 AM ET, Employment Report for March. The consensus is for an increase of 175,000 non-farm payroll jobs added in March, down from the 313,000 non-farm payroll jobs added in February. The consensus is for the unemployment rate to decrease to 4.0%.
• At 1:30 PM, Speech by Fed Chair Jerome Powell, Economic Outlook, Watch Live on YouTube, At the Economic Club of Chicago, Chicago, Illinois
• At 3:00 PM, Consumer Credit from the Federal Reserve. The consensus is for consumer credit to increase $15.0 billion in February.
Goldman: March Payrolls Preview
by Calculated Risk on 4/05/2018 02:34:00 PM
A few brief excerpts from a note by Goldman Sachs economist Spencer Hill:
We estimate that nonfarm payrolls increased 200k in March, 15k above consensus. While we believe elevated snowfall will cause job growth to decelerate from the +276k average pace in the prior two months, labor market fundamentals remain solid and appear to have improved further.
...
we estimate the unemployment rate fell to 4.0% in March. ... We estimate a 0.3% month-over-month increase in average hourly earnings (and 2.7% year-on-year), reflecting somewhat favorable calendar effects. ...
emphasis added
March Employment Preview
by Calculated Risk on 4/05/2018 11:12:00 AM
On Friday at 8:30 AM ET, the BLS will release the employment report for March. The consensus, according to Bloomberg, is for an increase of 175,000 non-farm payroll jobs in March (with a range of estimates between 112,000 to 225,000), and for the unemployment rate to decline to 4.0%.
The BLS reported 313,000 jobs added in February.
Note on Weather: Most estimates show that warmer than normal weather boosted February employment by 80,000 to 90,000 jobs, and there should be some payback in the March report.
Here is a summary of recent data:
• The ADP employment report showed an increase of 241,000 private sector payroll jobs in March. This was well above consensus expectations of 180,000 private sector payroll jobs added. The ADP report hasn't been very useful in predicting the BLS report for any one month, but in general, this suggests employment growth above expectations.
• The ISM manufacturing employment index decreased in March to 57.3%. A historical correlation between the ISM manufacturing employment index and the BLS employment report for manufacturing, suggests that private sector BLS manufacturing payroll increased about 20,000 in March. The ADP report indicated manufacturing jobs increased 29,000 in March.
The ISM non-manufacturing employment index increased in March to 56.6%. A historical correlation between the ISM non-manufacturing employment index and the BLS employment report for non-manufacturing, suggests that private sector BLS non-manufacturing payroll jobs increased about 250,000 in March.
Combined, the ISM indexes suggests employment gains of about 270,000. This suggests employment growth above expectations.
• Initial weekly unemployment claims averaged 228,000 in March, up from 224,000 in February. For the BLS reference week (includes the 12th of the month), initial claims were at 227,000, up from 220,000 during the reference week in February.
The slight increase during the reference week suggests a weaker employment report in March than in February.
• The final March University of Michigan consumer sentiment index increased to 101.4 from the February reading of 99.7. Sentiment is frequently coincident with changes in the labor market, but there are other factors too like gasoline prices and politics.
• Merrill Lynch has introduced a new payrolls tracker based on private internal BAC data. The tracker suggests private payrolls increased by 223,000 in March, and this suggests employment growth above expectations.
• Conclusion: In general, these reports suggest a solid employment report. However, there should be some payback from the weather boost in February. My guess is that the employment report will be below the consensus in March.


