by Calculated Risk on 4/06/2018 06:13:00 PM
Friday, April 06, 2018
AAR: Rail Carloads Up 3.6% YoY, Best March Ever for Intermodal
From the Association of American Railroads (AAR) Rail Time Indicators. Graphs and excerpts reprinted with permission.
Intermodal did great in March: container plus trailer volume was up 6.5% (66,151 units) over last year, the 14th straight year-over-year monthly gain. Average weekly intermodal volume in March 2018 was easily the most for any March in history. Total U.S. rail carloads were up 3.6% (36,157 carloads) in March 2018 over March 2017, the best percentage gain in nine months.
 Click on graph for larger image.
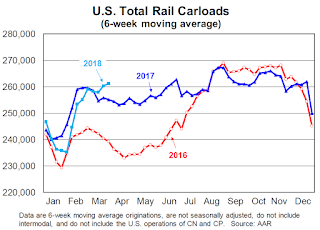
This graph from the Rail Time Indicators report shows U.S. average weekly rail carloads (NSA). Light blue is 2018.
Rail carloads have been weak over the last decade due to the decline in coal shipments.
U.S. railroads originated 1,050,653 carloads in March 2018, up 36,157 carloads, or 3.6%, over March 2017. That’s just the second year-over-year monthly gain in the past nine months (December 2017 was the other). Weekly average carloads in March 2018 were 262,663, the most for March since 2014.
 The second graph is for intermodal traffic (using intermodal or shipping containers):
U.S. railroads originated 1,082,239 containers and trailers in March 2018, up 6.5%, or 66,151 units, over March 2017. It was easily the best March in history for U.S. intermodal.
For the first three months of 2018, U.S. intermodal volume was up 5.5%, or 181,304 units, over the same period in 2017. At this point, there’s no reason to think this won’t be a record year for intermodal, breaking the record set last year.


