 RSS Feed
 by Calculated Risk on 4/06/2018 08:43:00 AM
Friday, April 06, 2018
March Employment Report: 103,000 Jobs Added, 4.1% Unemployment Rate
From the BLS:
Total nonfarm payroll employment edged up by 103,000 in March, and the unemployment rate was unchanged at 4.1 percent, the U.S. Bureau of Labor Statistics reported today. Employment increased in manufacturing, health care, and mining.
...
The change in total nonfarm payroll employment for January was revised down from +239,000 to +176,000, and the change for February was revised up from +313,000 to +326,000. With these revisions, employment gains in January and February combined were 50,000 less than previously reported.
...
In March, average hourly earnings for all employees on private nonfarm payrolls rose by 8 cents to $26.82. Over the year, average hourly earnings have increased by 71 cents, or 2.7 percent.
emphasis added
 Click on graph for larger image.
The first graph shows the monthly change in payroll jobs, ex-Census (meaning the impact of the decennial Census temporary hires and layoffs is removed - mostly in 2010 - to show the underlying payroll changes).
Total payrolls increased by 103 thousand in March (private payrolls increased 102 thousand).
Payrolls for January and February were revised down by a combined 50 thousand.
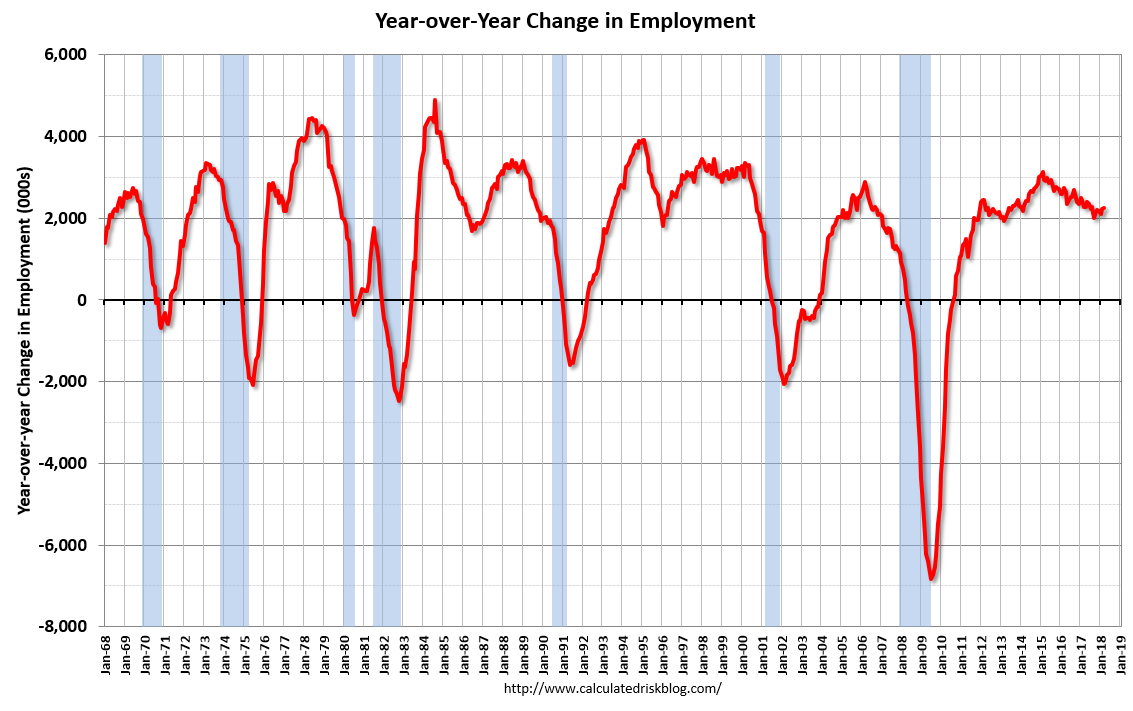 This graph shows the year-over-year change in total non-farm employment since 1968.
In March the year-over-year change was 2.261 million jobs.
The third graph shows the employment population ratio and the participation rate.
 The Labor Force Participation Rate was decreased in March to 62.9%. This is the percentage of the working age population in the labor force. A large portion of the recent decline in the participation rate is due to demographics.
 The Employment-Population ratio was unchanged at 60.4% (black line).
I'll post the 25 to 54 age group employment-population ratio graph later.
 The fourth graph shows the unemployment rate.
 The unemployment rate was unchanged in March at 4.1%.
This was well below the consensus expectations of 175,000 jobs, and the previous two months combined were revised down by 50,000.
I'll have much more later ...


